
beatnothing




Can your model beat doing nothing, after costs, without knowing the future?
Every quant paper has a chart that goes up and to the right. This benchmark asks that chart one question. It hands the same prices to the dumbest strategy imaginable, hold everything at equal weight and never think again, charges both of them the same fee on every trade, refuses to let either one see tomorrow, and measures the gap with an error bar. That gap is the Net Edge. Twenty five contestants have tried so far: four neural architectures, gradient boosted trees, the classic cross sectional factors, a cross sectional ranking network, and a 2026 financial foundation model used with no training at all. None of them clears the bar.
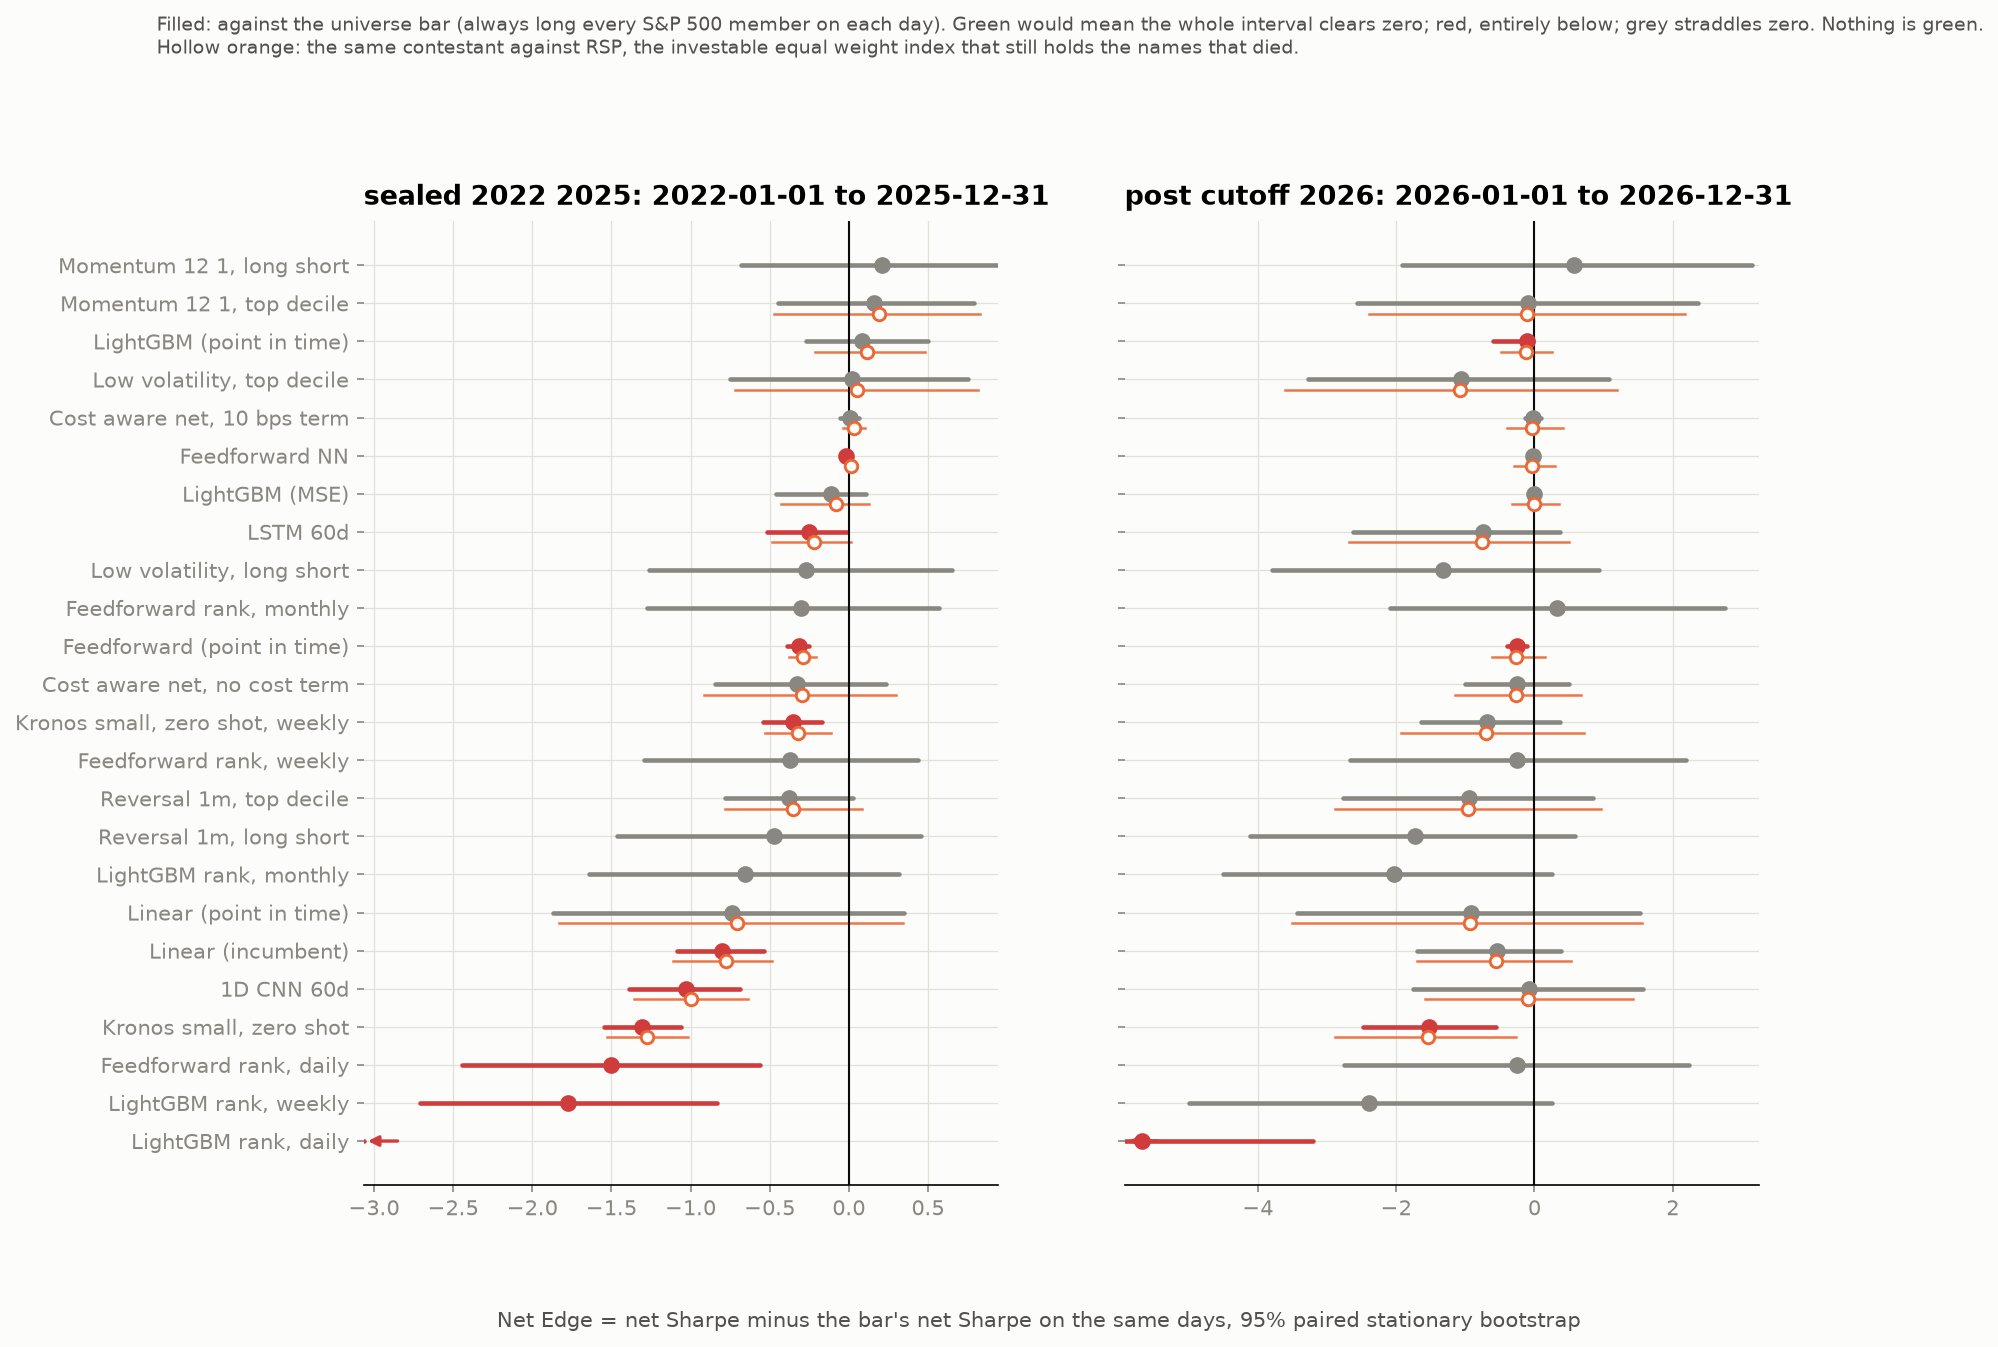
Every contestant, both windows, against the point in time bar. Green would mean the whole interval clears zero. Nothing is green.
pip install beatnothing
The rules of the game
| Rule | What it means in practice |
|---|---|
| One engine | Predictions become positions by one of three fixed rules a contestant declares: long every name with a positive value (the default), long the top decile, or long the top and short the bottom decile, dollar neutral, with a 50 bps a year borrow charge. Weights are used as given, gross exposure at most one, no leverage. Nobody gets a custom backtester. |
| One bar, and a second one that could not choose | The universe bar: always long, equal weight, same universe, same days, same costs. The thing you would earn with zero skill on the names you picked. Beside it, the investable bar: RSP, the equal weight S&P 500 ETF, which holds every index member by construction, dead ones included, and cannot have picked its universe with hindsight. The gap between the two bars is what picking the universe was worth. |
| Costs on every trade | 10 bps per unit of turnover, day one included. Gross and 20 bps numbers sit beside the net number so you can see who only wins for free. |
| One score | Net Edge = your net Sharpe minus the bar's net Sharpe on the same days, with a 95% paired stationary block bootstrap interval. You clear the bar only when the whole interval is above zero. |
| Frozen means frozen | Every submission records the sha256 of its model files and a registration date. A monthly job pulls new prices and rescores everything on the days that arrived after registration. Signals never change; only the calendar does. |
Scoreboard, first season
Sealed window 2022 to 2025, 48 large cap US stocks, net of 10 bps. Full detail with
drawdowns, exposure and dollars in leaderboard/LEADERBOARD.md.
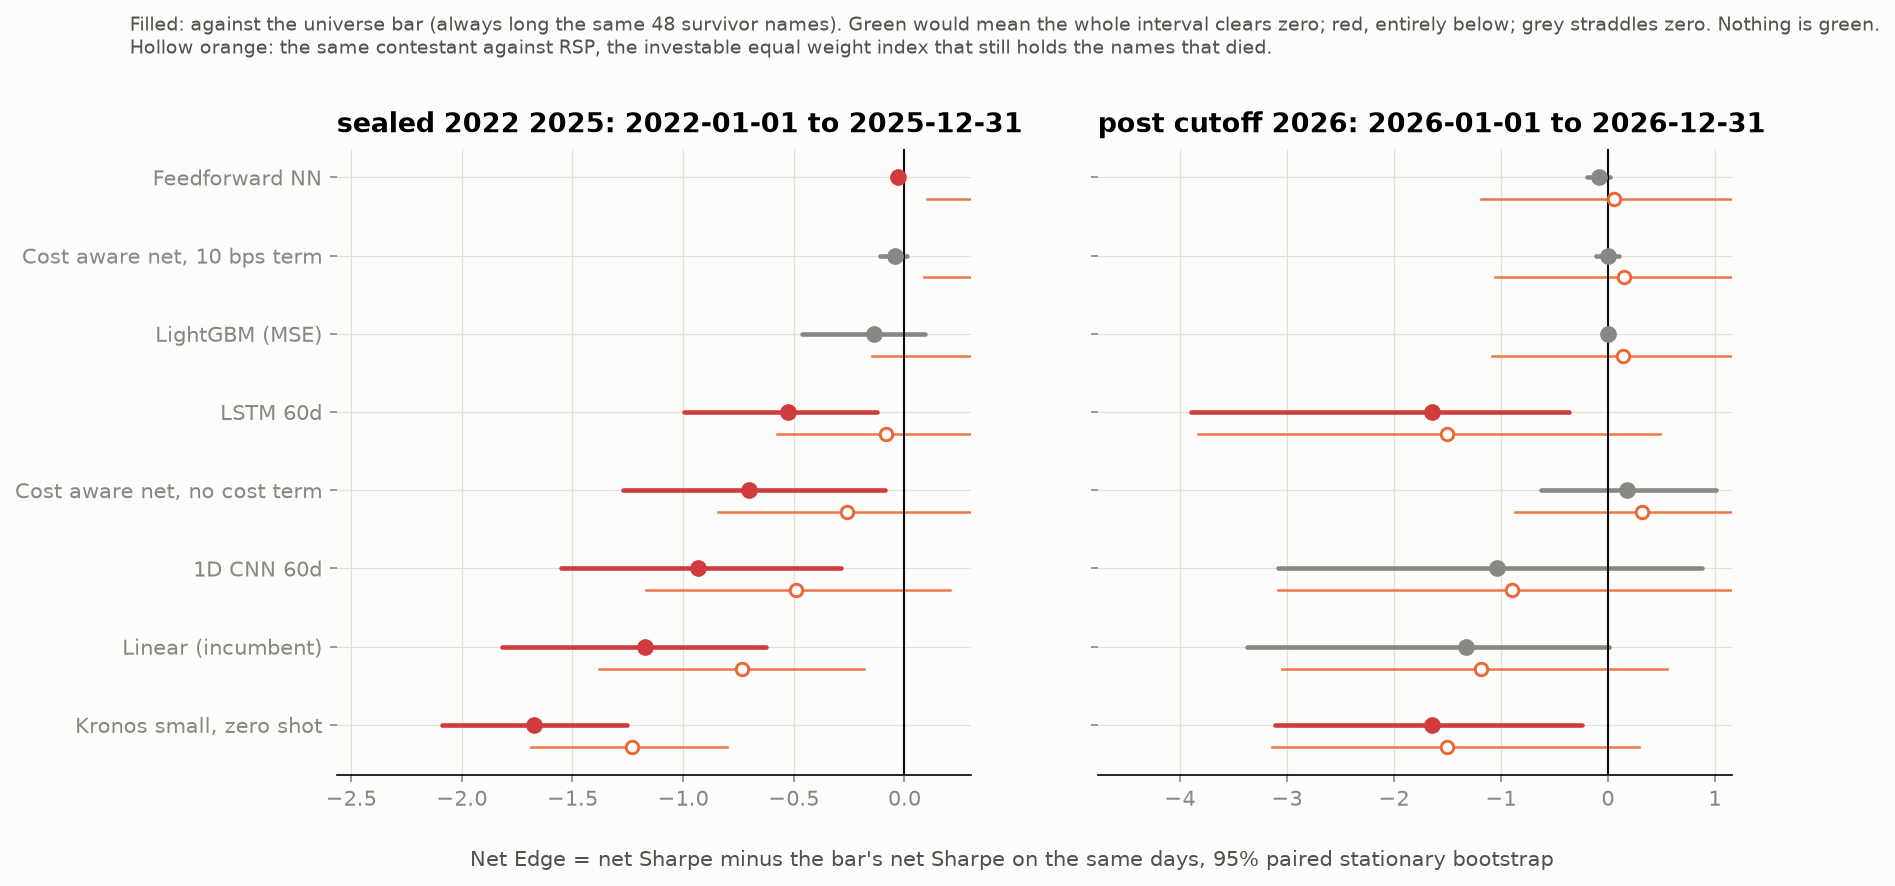
The nine season one entries on the survivor universe. The chart at the top of this page is the same picture with every contestant, on the universe that did not know the future.
| Contestant | Net Edge | 95% interval | Edge vs RSP | Net Sharpe | Gross Sharpe | Turnover a year |
|---|---|---|---|---|---|---|
| Always long, the universe bar | 0.00 | +0.44 [+0.19, +0.76] | +0.88 | +0.88 | 0.3× | |
| Feedforward network | −0.03 | [−0.06, −0.01] | +0.41 [+0.17, +0.72] | +0.85 | +0.88 | 4.3× |
| Cost aware network, 10 bps term | −0.04 | [−0.10, +0.01] | +0.40 [+0.15, +0.72] | +0.83 | +0.87 | 2.9× |
| LightGBM, MSE objective | −0.14 | [−0.45, +0.09] | +0.30 [−0.13, +0.72] | +0.74 | +0.79 | 7.2× |
| LSTM, 60 day windows | −0.53 | [−1.00, −0.12] | −0.08 [−0.61, +0.44] | +0.35 | +0.62 | 43× |
| Cost aware network, no cost term | −0.70 | [−1.27, −0.09] | −0.26 [−0.89, +0.35] | +0.18 | +0.53 | 11.5× |
| 1D CNN, 60 day windows | −0.93 | [−1.55, −0.29] | −0.49 [−1.17, +0.16] | −0.05 | +1.08 | 265× |
| Linear regression, the incumbent | −1.17 | [−1.82, −0.62] | −0.73 [−1.42, −0.10] | −0.30 | +0.51 | 159× |
| Kronos small, zero shot | −1.67 | [−2.09, −1.26] | −1.23 [−1.71, −0.79] | −0.79 | +0.52 | 241× |
Read the two edge columns together. Three contestants clear RSP on the sealed window, and so does the universe bar itself, by the same margin. They are not beating the index; the universe is. A contestant that clears the investable bar while failing the universe bar has demonstrated one thing only: that its universe was chosen with hindsight.
On the 176 trading days of 2026 that none of the frozen models had ever seen, the order reproduces, every interval widens to include zero, and the two bars converge (RSP 1.30, universe bar 1.44, gap inside the noise). Eight months cannot separate a network from a bar. The leaderboard says so instead of ranking noise.
What the first season taught us
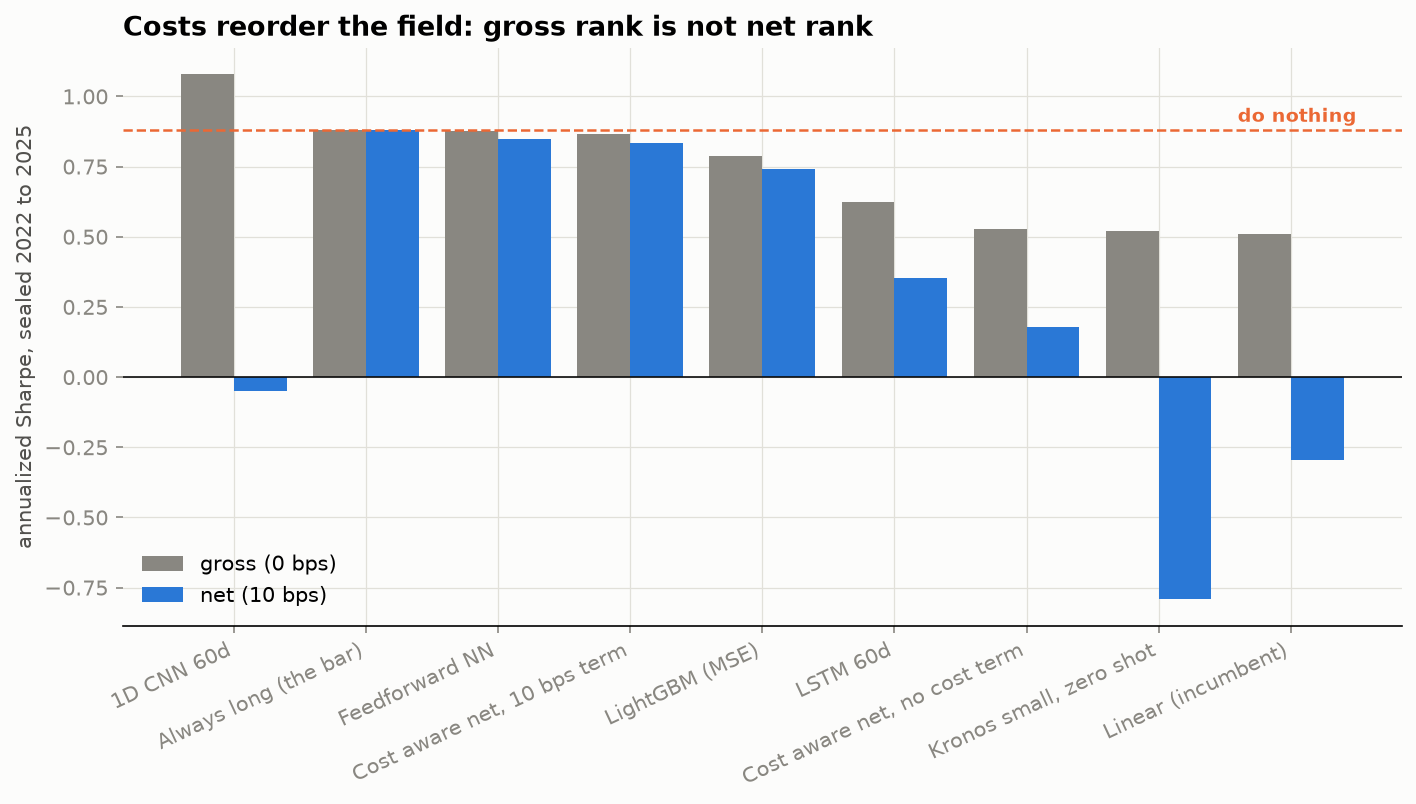
- Costs reorder the field. The 1D CNN has the highest gross Sharpe of anything, 1.08, and a negative net Sharpe, because it turns the book over 265 times a year. Gross rank is not net rank. Papers that report gross numbers are reporting a different sport.
- The MSE optimum is nearly always long. LightGBM, early stopped honestly on validation loss, stops after three trees and holds 47 of 48 names. Squared error on daily returns is minimised by predicting the drift, and the drift is the bar wearing a different hat.
- A foundation model obeys the same arithmetic as a linear regression. Kronos small, pretrained on 12 billion bars across 45 exchanges and used zero shot, has a gross Sharpe of 0.52 and a net Sharpe of minus 0.79, with a 53% drawdown, because it flips positions 241 times a year. A hundred times the parameters of the feedforward network; the same cost inversion as the incumbent.
- A cost aware objective repairs turnover, not alpha. A network trained end to end on net Sharpe with a 10 bps turnover term trades three times a year instead of twelve and lands within 0.05 of the bar across three seeds, holding half the book in cash. Remove the cost term and the identical architecture loses 0.7 of Sharpe to fees. Given the true objective, the optimiser finds the bar.
How we decide something is real
A leaderboard is a multiple test, and a Sharpe ratio is a badly behaved statistic. Three things stand between a number in the table above and a claim worth acting on.
The interval. Net Edge carries a studentized circular block bootstrap interval (Ledoit and Wolf, 2008): every resample recomputes not only the difference but a heteroskedasticity and autocorrelation robust standard error for it, using the delta method over the four moments that define two Sharpe ratios. The block length is chosen by the Politis and White rule applied to the statistic's influence function, not to the return series, because the difference of two return series has almost no autocorrelation in its level while its squares are strongly persistent.
The correction. With fifteen contestants tested separately at five percent, a false winner appears more than half the time. The same joint bootstrap resamples every contestant on the same dates and feeds a Romano and Wolf stepdown, which controls the chance of even one false claim across the whole board while keeping far more power than Bonferroni. The column that decides a verdict is p adj, not p.
The search. A submitter who tried forty variants and shows you the best one has told
you nothing. beatnothing.stats ships the combinatorially symmetric cross validation
probability of backtest overfitting and the deflated Sharpe ratio, so a contestant with
many variants can be scored on what the search itself would have produced.
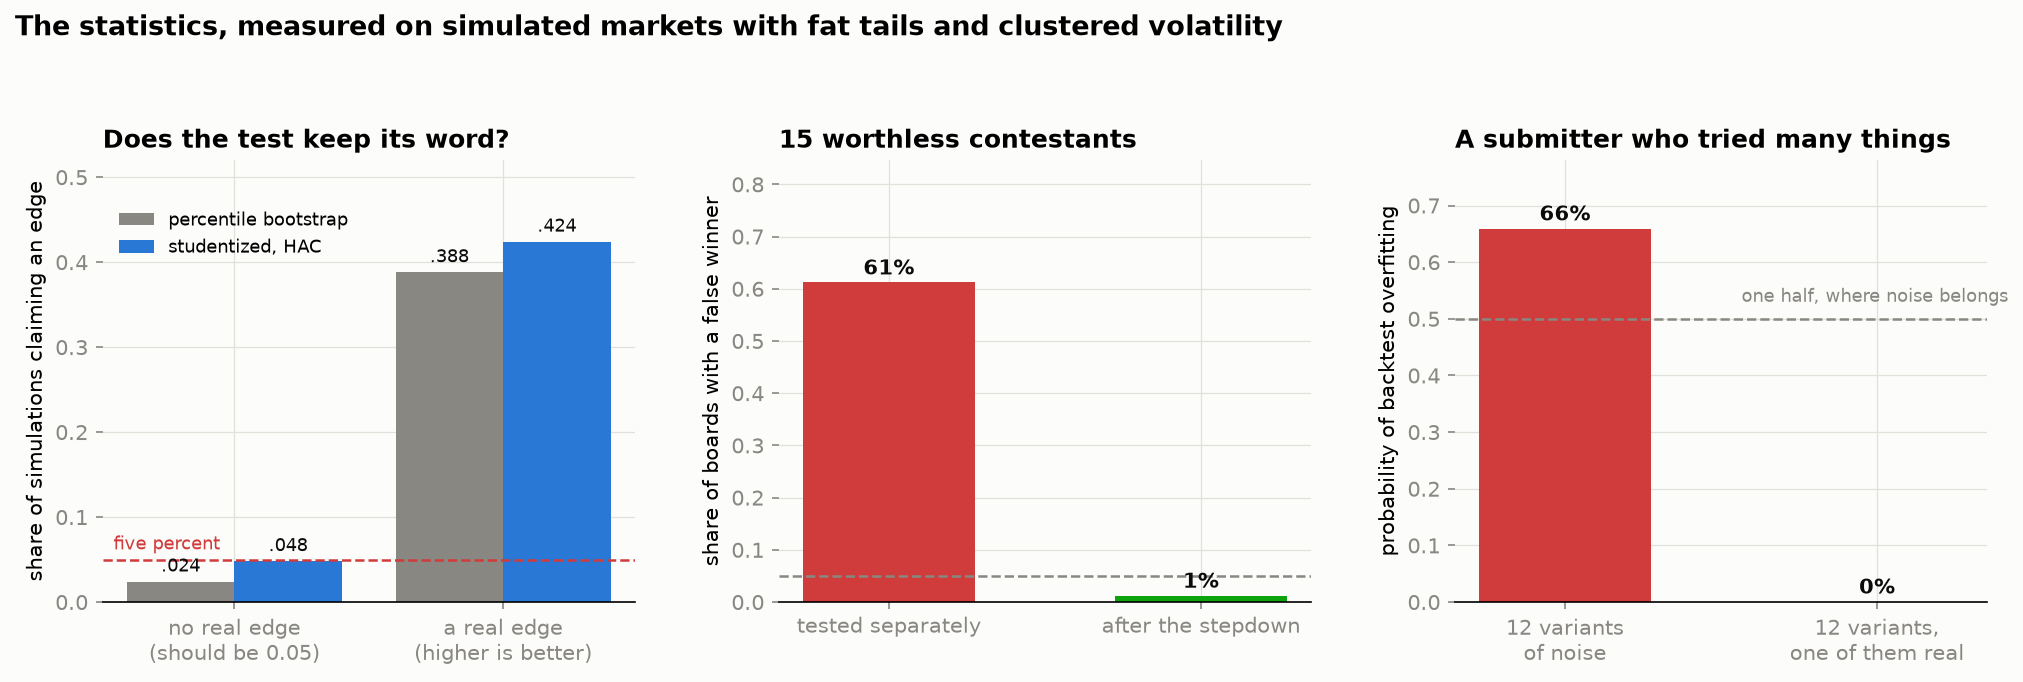
None of that is asserted. scripts/validate_stats.py simulates markets with fat tails and
clustered volatility, where the contestant is highly correlated with its bar because real
contestants are, and measures what the machinery actually does. On 250 simulations of four
years of daily data:
| Experiment | Result |
|---|---|
| No real edge exists. How often is one claimed? | studentized test 4.8% against a promise of 5%; percentile interval 2.4% |
| A real edge of a third of a Sharpe exists. How often is it found? | studentized test 42.4%; percentile interval 38.8% |
| Fifteen worthless contestants on one board. How often does one of them win? | tested separately 61%; after the stepdown 1% |
| Twelve variants of noise. What is the overfitting probability of the best? | 0.66, where one half is what pure noise deserves; with one genuinely good variant among the twelve, 0.00 |
The studentized test keeps its word. The older percentile interval fires at about half its nominal rate, and being conservative is not free: it misses real edges the studentized test finds. Size stays near five percent as the record lengthens from two years to sixteen, so what distortion remains is a finite sample effect and not a bug.
The third row is the one that matters most for a leaderboard, and it is why the verdict column reports an adjusted p value rather than an interval. Six boards in ten would have crowned somebody. On the real boards here the lowest adjusted p value is 0.97, so nothing comes close.
Getting that experiment right was harder than it looks, and the first attempt was silently
wrong: adding zero mean noise to the bar leaves the mean alone but raises the variance, so
every simulated contestant was genuinely worse than its bar and the board could not have
produced a false winner at all. It reported zero percent both ways, which looked like a
result. Full numbers in leaderboard/stats_validation.json.
Verify your verifier
Most leakage is not in the model. It is in the evaluation. So the harness ships contestants that cheat on purpose, and you run them through your pipeline first:
from beatnothing import Backtest, peek, off_by_one, hindsight_universe
Backtest(actual, predictions=peek(actual)).stats()["net_sharpe"]      # tomorrow's return as today's signal: absurd, or your pipeline is broken
Backtest(actual, predictions=hindsight_universe(actual, 10)).stats()  # the ten best names of the whole window, chosen at the start
If a canary does not score absurdly well, your pipeline is not measuring what you think.
The truncation_test in the same module proves a feature builder is trailing only by
deleting the future, recomputing, and demanding byte identical rows. Run on the point in
time panel it compares 46,605 rows across 60 names either side of a June 2024 cutoff and
finds a maximum difference of exactly zero on every one of the seventeen features
(data/pit/truncation_test.json).
The universe knew the future
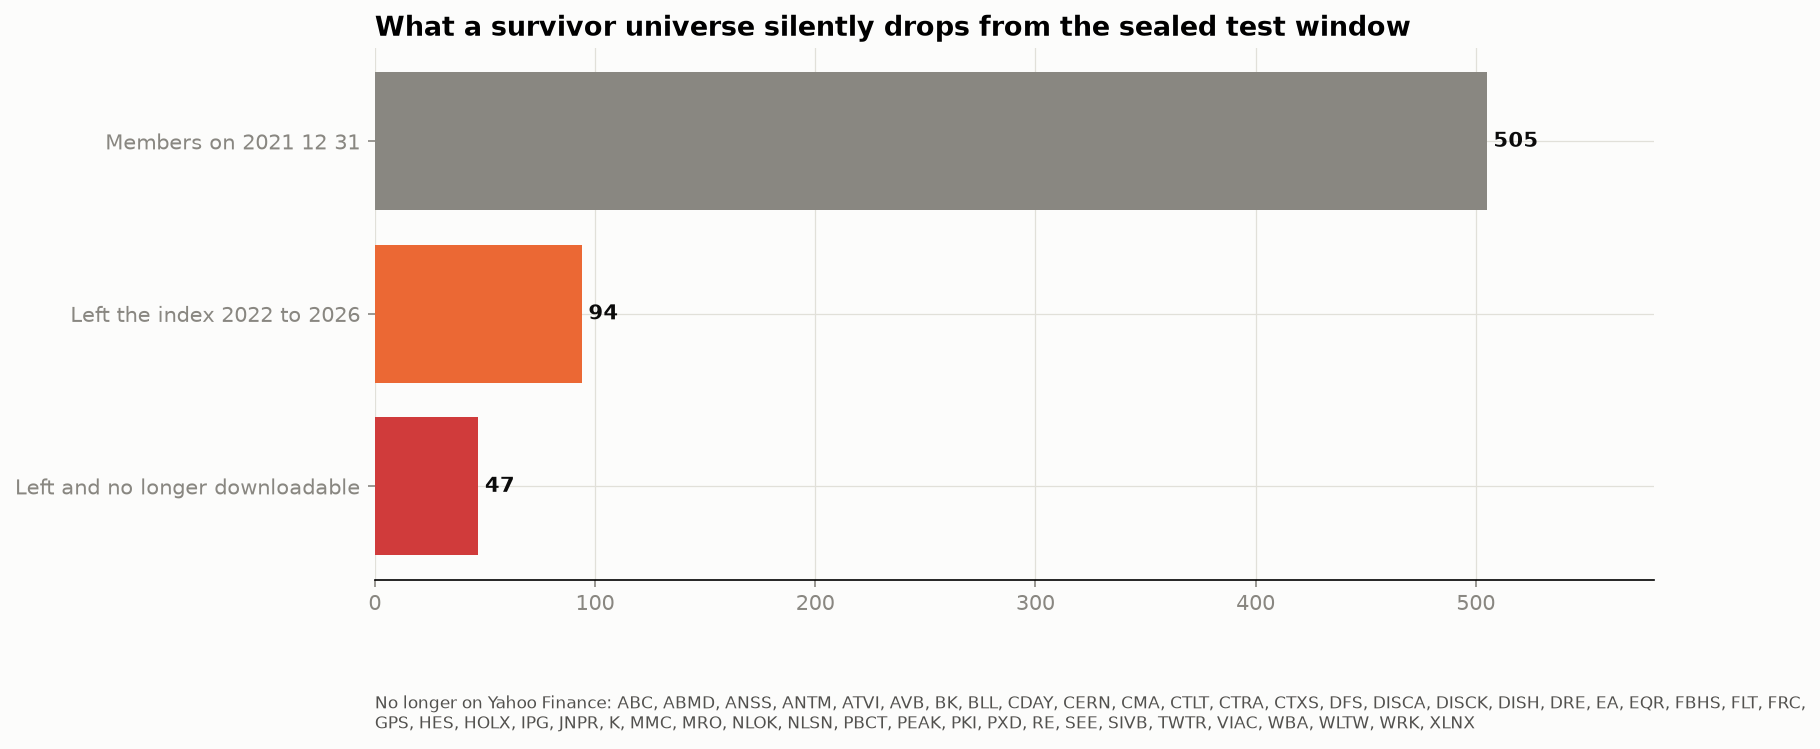
"The current S&P 500 constituents" is a list of companies that survived. The
package ships point in time membership from 1996 to 2026 (beatnothing members
2008-09-15 prints who was actually in the index on the Lehman weekend) and a coverage
report that states, in numbers, what a free price source can no longer supply. For the
sealed window: 94 of the 505 members on the last day of 2021 left the index, and 47 of
those have no prices on Yahoo Finance any more, both 2023 bank failures among them.
That is the residual survivorship gap in this first season, and it is stated rather
than hidden.
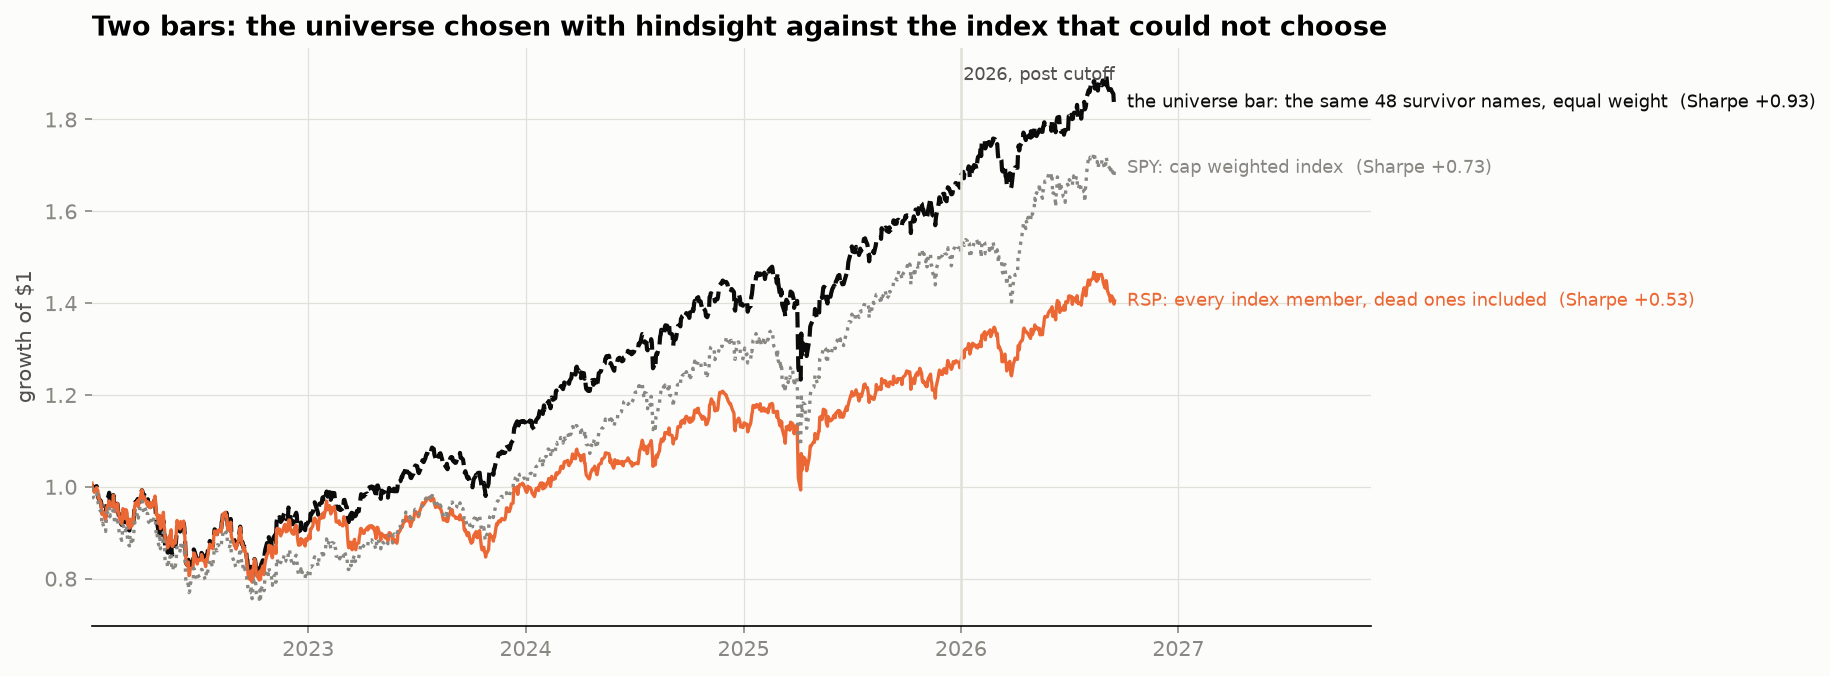
It is also priced. RSP, the equal weight S&P 500 ETF, is the same idea as the universe bar applied to the whole index, and it could not pick its members with hindsight. On the sealed window the 48 name bar earned a Sharpe of 0.88 against 0.44 for RSP, an edge of +0.44 with an interval of [+0.19, +0.76]. Part of that is a size effect, since the largest names ran hardest in 2023 to 2025, so read it as an upper bound on survivorship and a fair measure of hindsight in universe selection. In 2026, where no hindsight was possible, the two bars sit 0.14 apart with an interval that spans a full Sharpe point in each direction. Every contestant now carries an edge against both bars.
A probe of a paid archive found 45 of the 47 vanished names in its delisted index and the other two renamed and still trading, so season two can run on the universe that did not know the future.
Season two: the universe that did not know the future
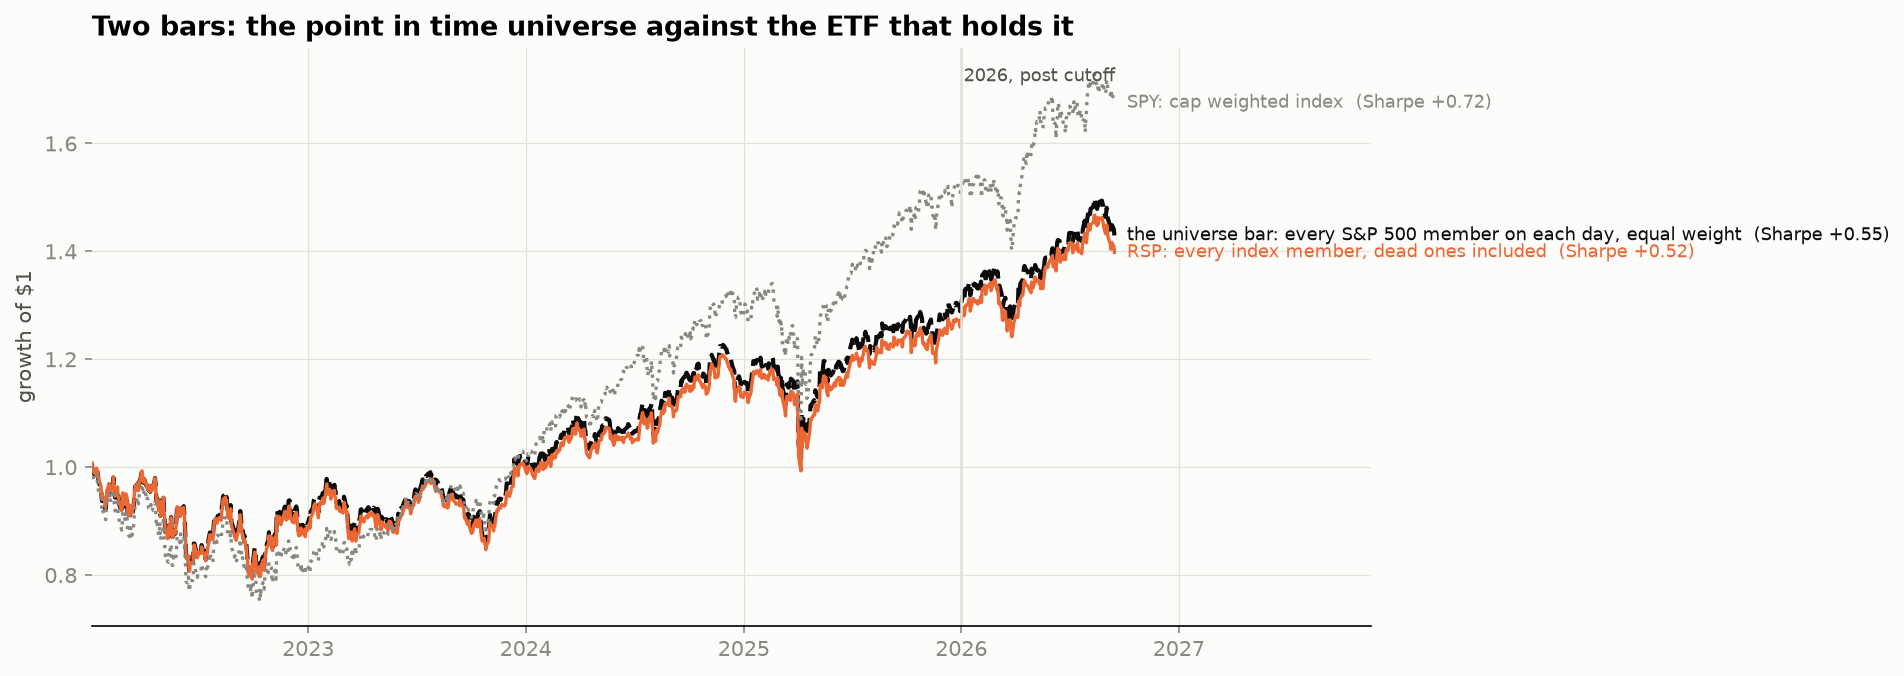
Every S&P 500 member on every day since 2022, 615 names in all, dead ones included, built entirely from free data: Yahoo for the 564 that still trade, Yahoo under a new ticker for 16 renames (the alias table ships with the package), and Tiingo's free tier for 39 names that were acquired or failed, each fetched to its last trading day. The membership table decides on which days a name exists. Coverage is 99.5% of the member days the index defines, about 501 names a day; the gap is one real hole (Equity Residential, which no free source serves after its 2026 merger) and four 2026 spin offs too young to have features.
The bar now agrees with the ETF that holds the same names: a Sharpe of 0.47 for the point in time universe against 0.44 for RSP on the sealed window, an edge of +0.03 with an interval of [−0.01, +0.06]. On the 48 name survivor universe that same gap was +0.44. The hindsight premium is gone, and with it the illusion that three contestants "beat the index".
The frozen contestants, trained on 48 survivors and now asked about 500 names including the ones that later died:
| Contestant, point in time track | Net Edge | 95% interval | Edge vs RSP | Net Sharpe | Gross Sharpe | Max drawdown | Turnover a year |
|---|---|---|---|---|---|---|---|
| Momentum 12 1, long short vs cash | +0.21 | [−0.79, +1.20] | +0.21 | +0.27 | −17% | 7.0× | |
| Momentum 12 1, long top decile | +0.16 | [−0.48, +0.80] | +0.63 | +0.66 | −24% | 7.2× | |
| Low volatility, long top decile | +0.02 | [−0.74, +0.76] | +0.49 | +0.55 | −14% | 7.7× | |
| Cost aware network, 10 bps term | +0.00 | [−0.06, +0.07] | +0.03 [−0.04, +0.11] | +0.47 | +0.50 | −12% | 3.2× |
| Always long, the universe bar | 0.00 | +0.03 [−0.01, +0.06] | +0.47 | +0.47 | −21% | 0.4× | |
| Feedforward network | −0.02 | [−0.03, −0.01] | +0.01 [−0.03, +0.05] | +0.45 | +0.47 | −21% | 4.3× |
| LightGBM, MSE objective | −0.11 | [−0.45, +0.12] | −0.08 [−0.37, +0.13] | +0.36 | +0.40 | −22% | 7.4× |
| LSTM, 60 day windows | −0.25 | [−0.53, +0.00] | −0.22 [−0.46, +0.00] | +0.21 | +0.52 | −22% | 51× |
| Low volatility, long short vs cash | −0.27 | [−1.25, +0.69] | −0.27 | −0.22 | −28% | 6.7× | |
| Cost aware network, no cost term | −0.33 | [−0.89, +0.24] | −0.30 [−0.84, +0.24] | +0.14 | +0.49 | −6% | 12× |
| Kronos small, zero shot, weekly | −0.35 | [−0.55, −0.16] | +0.12 | +0.38 | −25% | 50× | |
| Reversal 1m, long top decile | −0.38 | [−0.81, +0.03] | +0.09 | +0.17 | −27% | 21× | |
| Reversal 1m, long short vs cash | −0.47 | [−1.38, +0.49] | −0.47 | −0.25 | −21% | 21× | |
| Linear regression, the incumbent | −0.80 | [−1.09, −0.52] | −0.77 [−1.10, −0.48] | −0.34 | +0.47 | −38% | 151× |
| 1D CNN, 60 day windows | −1.03 | [−1.38, −0.70] | −1.00 [−1.42, −0.67] | −0.56 | +0.53 | −52% | 235× |
| Kronos small, zero shot, daily | −1.31 | [−1.56, −1.06] | −0.84 | +0.35 | −55% | 225× |
The foundation model's information does not live in the daily rebalance
Kronos runs twice here, forecasting every trading day and every fifth, the second holding its signal between. The pair separates what the model knows from what the trading costs:
| Kronos small, zero shot, sealed window | Gross Sharpe | Net Sharpe | Cost of trading | Turnover | Max drawdown |
|---|---|---|---|---|---|
| Forecasting daily | +0.35 | −0.84 | 1.19 of Sharpe | 225× | −55% |
| Forecasting weekly | +0.38 | +0.12 | 0.26 of Sharpe | 50× | −25% |
The gross numbers are the same within noise, so the model knows no more at a daily horizon than at a weekly one. Everything that separates a Sharpe of minus 0.84 from plus 0.12 is the cost of acting on it five times as often, and that is a property of the evaluation nobody sees without charging for turnover. It is also not a rescue: at plus 0.12 against the bar's plus 0.47, the weekly version is still significantly worse than holding everything, with an interval of [−0.55, −0.16] that sits entirely below zero.
Nothing clears either bar. Three contestants have a positive point estimate and every one of their intervals contains zero; after the stepdown across all fourteen, the lowest adjusted p value on the board is 0.97. The order is the same as on the survivor universe, the absolute numbers are roughly half, and the learned models neither collapse nor shine on ten times the names including the failures: a strategy that hugs the bar hugs whatever bar it is given. On 2026 to date every interval includes zero on both tracks.
Kronos is now on this track twice, daily and weekly. Five hundred names times twelve hundred days of autoregressive generation is 590,089 forecasts and just under five hours on a laptop card.
The classic factors, on the honest universe, after costs
A benchmark that only my own models have failed proves little. So the field now holds the strategies every quant knows, built from prices alone and traded the way the literature trades them, monthly rebalanced, decile portfolios: twelve month momentum skipping the last month, one month reversal, and low volatility. Each runs two ways. Long only the top decile, judged against the universe bar. And long the top decile, short the bottom decile, dollar neutral, paying 50 bps a year to borrow, judged against cash because a dollar neutral book competes with cash, not with an index.
Their rows are in the table above, mixed in with everything else, which is the point: a factor and a neural network are contestants under the same rules.
Momentum's positive edge, the only one on the board, rests entirely on cheap borrow. The bottom decile of a momentum screen is where hard to borrow names live, so the flat fifty basis points a year charged by default is the optimistic case. Raising it prices the optimism away:
| Dollar neutral contestant, net Sharpe | 50 bps borrow | 200 bps | 500 bps | 1000 bps |
|---|---|---|---|---|
| Momentum 12 1 | +0.21 | +0.14 | +0.01 | −0.21 |
| Low volatility 63d | −0.27 | −0.33 | −0.44 | −0.62 |
| Reversal 1m | −0.47 | −0.55 | −0.70 | −0.96 |
The leaderboard therefore carries a Sharpe at 500 basis points column for every contestant that shorts, beside the one at 20 basis points of turnover cost, so neither assumption can carry a result on its own.
This is what the literature would predict for four recent years. Momentum is the only factor with a positive net edge on both rules, and even so its interval spans zero: four years of a fifty name decile book is not enough to separate a Sharpe of 0.2 from luck, which is exactly why the intervals are printed. Short term reversal, a strong anomaly in the 1990s, is dead after costs at 21 turns a year. Low volatility is flat. Nothing clears either bar, and the models above now sit in a field that includes the strategies real money trades. The calibration also cuts the other way: a harness that had shown momentum at a Sharpe of 2 would have been reporting a bug.
Two notes on the data. The dead names' histories come from Tiingo's free tier, whose
terms cover personal use, so this repository carries their realised returns for the
scored window rather than their raw prices; scripts/build_pit_universe.py rebuilds
the full panel from your own free token in an afternoon. And the contestants here were
trained on survivors, which is the last hindsight left in the benchmark; retraining
them on the point in time universe is season three.
Season three: trained on the honest universe, and the one contestant with real information
The last hindsight left was in the training, not the evaluation: every learned contestant so far was fitted on forty eight survivors and then asked about five hundred. Season three removes it. The universe now reaches back to 2013, 797 names, 97.4% of the member days the index defines, fitted to the end of 2018, chosen on 2019 to 2021, and scored on the same sealed window as everyone else. It stops at 2013 rather than 2005 on purpose: the free tier cannot supply Lehman Brothers, Bear Stearns, Washington Mutual, Countrywide, Fannie Mae or Freddie Mac, so reaching back to 2008 would quietly put survivorship bias into the one window where it would matter most.
Alongside the usual architectures it adds the contestant the earlier results kept pointing at. A model trained to predict tomorrow's return under squared error is trained to predict the drift, and the drift is the bar; so instead, rank the names against each other within each day, which cancels the market move by construction, and trade the ranking long and short. Such a model cannot inherit the bar's return, so any edge would be its own.
It has the most information of anything on the board, and it still loses:
| Ranking network, rebalanced | Information coefficient | Gross Sharpe | Net Sharpe | Turnover | Paid to trade |
|---|---|---|---|---|---|
| daily | +0.0154 | +0.72 | −1.50 | 222× | 2.22 of Sharpe |
| weekly | +0.0007 | +0.32 | −0.37 | 67× | 0.69 |
| monthly | −0.0039 | −0.10 | −0.30 | 20× | 0.20 |
Read the first column down. The information is real at a one day horizon, the highest coefficient of any contestant here, and it is gone within a week. Read the last column up. Harvesting it daily costs 2.22 of Sharpe ratio, which is three times the gross it produces. The only contestant with genuine cross sectional information has information that decays faster than it can be traded profitably. Slow down to keep the costs and the signal is no longer there; trade fast enough to catch it and the costs take three times what it is worth. That is a more interesting way to fail than any of the sixteen contestants that simply tracked the bar, and it is the kind of statement this benchmark exists to make.
Twenty five contestants now. None clears the bar on either window.
Enter a contestant
From clone to a scored entry in five minutes, with no API key and no download, because the returns panel is committed to this repository:
git clone https://github.com/kaustubhspatil/beatnothing && cd beatnothing
pip install -e ".[dev]"
python scripts/starter_submission.py --name my_first_try --author "your handle"
beatnothing validate submissions_pit/my_first_try
That builds a genuine entry out of a five day reversal signal, and it loses: information
coefficient +0.0142, net Sharpe −1.14, turnover 201× a year. Which is the fastest possible
introduction to the problem. Now open scripts/starter_submission.py, replace
signal_from_returns with your own idea, and open a pull request with the folder.
You do not have to use that script, and you do not have to share your model. Any tool in any language can write the two files, and the signal plus its hash plus the date of the pull request are enough to freeze an entry.
A submission is a folder with a signal file and a metadata file; the engine does the
rest. Read contestants/README.md, then open a pull request
with submissions_pit/<name>/. Two reference scripts show the full path from raw prices
to a submission: a pretrained foundation model used without training, and a network
trained end to end on net Sharpe with three seeds.
Every entry is checked by a machine before a human looks at it, on every pull request: structure, the engine's exposure rules, complete metadata, and then a leakage smell test. A cross sectional signal on daily equity returns has an information coefficient of roughly 0.02 to 0.05; a submission an order of magnitude above that has not found something the field missed. The leakage canaries are used as tests of the checker itself, so the contestant that peeks at tomorrow's return cannot reach the board. Its first run refused four of my own factor submissions, which is exactly what it is for.
Frozen means frozen, and it is verifiable rather than promised: each entry pins the sha256 of its own signal file, and because entries arrive by pull request, the public git history dates the registration. Neither the content nor the date can move afterwards without leaving a trace.
python scripts/validate_submissions.py --folder submissions_pit/my_model
Use it as a library, or from the shell
from beatnothing import Backtest, net_edge
from beatnothing.leaderboard import load_actual, bar_returns
actual = load_actual("data/actual_returns.parquet")          # dates x tickers, next day returns
mine = Backtest(actual, predictions=my_predictions)           # or weights=my_weights
print(net_edge(mine.daily_returns, bar_returns(actual)))     # net edge, interval, clears_bar
beatnothing score my_signal.parquet --actual data/actual_returns.parquet
beatnothing members 2020-03-16
beatnothing leaderboard --root .
Every number in the tables above rebuilds from a clean clone in about two minutes, with no data download and no API key, because the realised returns and every contestant's frozen signal are in the repository. This was checked from a fresh clone into an empty environment, not assumed:
git clone https://github.com/kaustubhspatil/beatnothing && cd beatnothing
pip install -e ".[dev]"
pytest -q                                # 50 tests: engine, canaries, statistics, submission rules
beatnothing leaderboard --track pit      # rebuilds the board and its verdicts
To go further back, to the raw prices and the universe itself:
pip install -e ".[data,figures]"
python scripts/download_data.py          # prices, features, realised returns, a hashed manifest
python scripts/build_pit_universe.py     # the point in time universe, needs a free Tiingo token
python scripts/validate_stats.py         # remeasure the statistics themselves
python scripts/make_figures.py pit
Roadmap
Ordered by what a benchmark actually needs, which is not the same as what the code needs. The first item is worth more than the other six together.
- A contestant the author did not write. Every entry on the board is currently mine, and a benchmark with one contributor is a result with a leaderboard attached. The five minute starter kit above exists for this. The first external contestant is credited by name in the technical report.
- A cost model you can set yourself. The flat 10 bps is the friction a small book pays and nothing else. A configurable model with a spread term and a square root impact term lets a desk run the board under its own assumptions, which is the difference between a benchmark people read and one people use. It also makes the central finding falsifiable in the most obvious direction: if nothing clears the bar at 10 bps, at what cost level does something?
- A second market and a second horizon. One market, one currency and one daily horizon is a finding. The same conclusion reproduced on European equities, or on a weekly horizon, is a method. This is the item that separates the two.
- A citable report. A DOI and a preprint, so the survivorship number and the size simulation can be cited rather than linked. Anyone whose contestant is merged and survives a year of forward track is a named author.
- Reach 2008. The universe stops at 2013 because the free tier cannot supply the companies that died in the financial crisis. A crisis is the one regime nothing here has ever been tested in.
- A second maintainer with merge rights. A standard cannot be one person's to change.
The rules for how a published claim gets overturned are written down in
CONTRIBUTING.mdprecisely so that they do not depend on the author's mood. - An LLM agent contestant, in the spirit of StockBench, under the same costs and the same bar. And a year of forward track, which is armed already; the calendar does the rest.
What a skeptic should attack, and what happens when they do
Two things a quant would go for first, both checked rather than argued.
"Your dead companies quietly disappear before they lose the money." They do not. The bar holds Silicon Valley Bank through its 60.4% day on 8 March 2023 and keeps it until the index dropped it on the 15th, a cumulative 84.6% loss over its scored life. It holds First Republic to a 90.5% single day and a 99.8% loss before removal on 4 May. Those are the two largest single day losses in the whole panel, and they are in the bar's return, not excluded from it. Exactly one name in the entire window stops trading more than a week before its removal date, and that is Juniper being acquired.
"Your membership dates leak." Index changes are announced several days before they take effect, so a table built from announcements would drop a failing name early and quietly avoid part of its loss. The table here uses effective dates: Silicon Valley Bank leaves on 15 March 2023 and First Republic on 4 May 2023, both the effective dates, not the earlier announcements. Additions are treated the same way, so the benchmark also forgoes the pop that a stock gets on the announcement of its inclusion.
Honest limits
- The season one universe is a survivor universe: 48 names chosen in August 2026, ten of which joined the index after 2005. It flatters every contestant and the bar equally, so Net Edge survives it. Absolute numbers do not.
- The contestants were trained on that survivor universe and evaluated on the point in time one, which removes the hindsight from the evaluation but not from the training.
scripts/train_on_pit.pyis the fix and season three is the run. - Costs are a flat 10 bps of turnover with no market impact and no size dependence, which is the friction a small book pays, plus a borrow charge that is a constant rather than a per name rate. The sensitivity columns exist because neither number should be trusted alone.
- Five hundred large capitalization names. Most published cross sectional edge lives in smaller companies, which this universe does not contain.
- Net Edge compares Sharpe ratios. A contestant whose value is a lower drawdown, or a low correlation with everything else, is not measured by it.
- The leakage check is a smell test, not a proof. A determined submitter could add noise until the information coefficient drops under the threshold. What it catches is accidents, which is most of them.
- Eight months of forward track is not evidence. Check back in a year.
Overturn something
The most useful thing you can send is not a contestant, it is a correction. Every number here is produced by code in this repository from data in this repository, so every number is attackable, and a reproduction that overturns a published claim changes the claim and earns a credit in the technical report. The "challenge a result" issue template asks for the three things that make a challenge actionable: which claim, what you ran, and the mechanism you think is wrong. The list above is where the author would attack first.
Cite
Patil, K. (2026). beatnothing: a net of cost benchmark for daily equity signals. https://github.com/kaustubhspatil/beatnothing
A CITATION.cff is included. The first five contestants come frozen from the
deep learning equity signal capstone,
where their training is documented notebook by notebook.
Credits
Point in time membership: fja05680/sp500, MIT.
Kronos: Shi et al., Kronos: A Foundation Model for the Language of Financial Markets,
AAAI 2026, the Kronos repository, MIT. Stationary
bootstrap: Politis and Romano (1994). Probabilistic Sharpe ratio: Bailey and Lopez de
Prado (2012). Sharpe standard error: Lo (2002). Prices from Yahoo Finance through
yfinance; the snapshot hash is in data/MANIFEST.json.
MIT licensed. Built by Kaustubh Patil.
1 maintainer

Download files
Download the file for your platform. If you're not sure which to choose, learn more about installing packages.
Source Distribution
Built Distribution
Filter files by name, interpreter, ABI, and platform.
If you're not sure about the file name format, learn more about wheel file names.
Copy a direct link to the current filters
File details
Details for the file beatnothing-0.2.2.tar.gz.
File metadata
- Download URL: beatnothing-0.2.2.tar.gz
- Upload date:
- Size: 115.7 kB
- Tags: Source
- Uploaded using Trusted Publishing? No
- Uploaded via:
twine/7.0.0 CPython/3.11.9
File hashes
| Algorithm | Hash digest | |
|---|---|---|
| SHA256 |
b0bf53edaa7ac1600da2ca93d9d84b1c5100eef7546cd9ca56f5a39301088ab9
|
|
| MD5 |
e214c6b86d4de62e83a685557fc23ecc
|
|
| BLAKE2b-256 |
0cbcb319cf3d907402358665a4d7f4ed39ebb2629e52d68112e16ebaaf32dc62
|
File details
Details for the file beatnothing-0.2.2-py3-none-any.whl.
File metadata
- Download URL: beatnothing-0.2.2-py3-none-any.whl
- Upload date:
- Size: 86.8 kB
- Tags: Python 3
- Uploaded using Trusted Publishing? No
- Uploaded via:
twine/7.0.0 CPython/3.11.9
File hashes
| Algorithm | Hash digest | |
|---|---|---|
| SHA256 |
21cda95bcf87bfb4ec8c8a921cb8da1e3284fe53dc974cbe94419649215e99fa
|
|
| MD5 |
7efd6c2b88e3746528e4fcce43763906
|
|
| BLAKE2b-256 |
4465c22f1b80072b7774418d73596b3b2419f2f28604861f05c460a35348b66c
|














