
This release is a pre-release and may not be stable for production use.
Bedrock Token Usage Statistics Calculator

This CLI tool visualizes foundation model (FM) usage in Amazon Bedrock. It calculates the tokens-per-minute/TPM and requests-per-minute/RPM. It also aggregates the FM usage across Bedrock application inference profiles and provides visibility on current usage gap towards the service quotas.
The tool works in commercial AWS regions and in AWS GovCloud (US) (us-gov-east-1, us-gov-west-1); see AWS GovCloud (US) and other partitions. You can analyze a whole foundation model or pick specific application inference profiles.
While Amazon CloudWatch already provides metrics for the FMs used in Bedrock, it might not be straightforward to calculate TPM & RPM, to aggregate token usage across application inference profiles, and see how each profile contributes to usage. Also, the quota lookup needs to be done separately via AWS service quotas. With this tool, you can specify the region and model to analyze and it will fetch the usage across last 1 hour, 1 day, 7 days, 14 days, and 30 days, each with aggregated data across the application inference profiles. It will generate HTML report containing the statistics table and time series data.
This CLI tool can help answers:
- What is the usage TPM and RPM of this FM?
- What is the total TPM across all of Bedrock application inference profiles for that model?
- What project/application tags contribute the most to my usage of that model? (provided that you tag the application inference profile appropriately)
- When did the throttling occur for this model and which project/application contributed the most for that?
- How far is my current TPM against the quota?
- Which service (IAM role or user, or IAM principal tag) uses how much of a shared endpoint, when services do not have their own application inference profiles? See Attributing usage to IAM principals.
This tool works by calling AWS APIs from your local machine, including CloudWatch Get Metric Data and Bedrock List Inference Profiles. It then generates a JSON and HTML output file per model/system inference profile being analyzed inside results folder. The tool uses bundled metadata files to obtain the list of available regions and FMs and to map each FM into the AWS service quotas L code (L-xxx).
You can refresh the available regions, the available foundation models, and the service quotas mapping for the FMs using the bedrock-usage-analyzer refresh commands (or bua refresh for short). The FM to service quotas mapping is done intelligently with the help of foundation model called through Bedrock.
⚠️ Important Disclaimer This tool is currently under 0.7.0-beta version. Before using this tool in any production or critical environment, you are strongly advised to review all code thoroughly and evaluate it against best practices, security and compliance standards, and other requirements.
Example Output
The tool generates HTML report showing token usage over time with quota limits. Please find the example screenshots in the following.
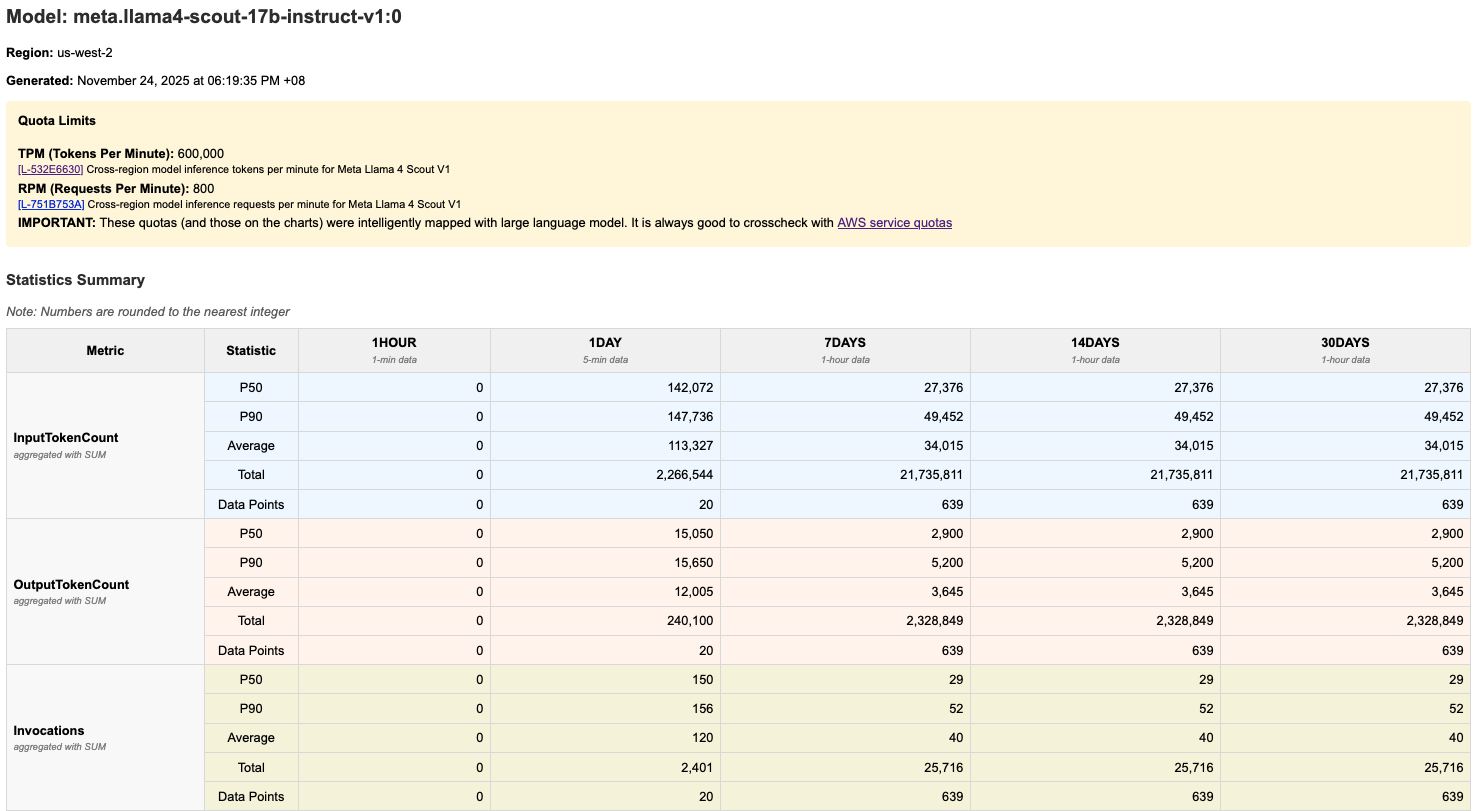
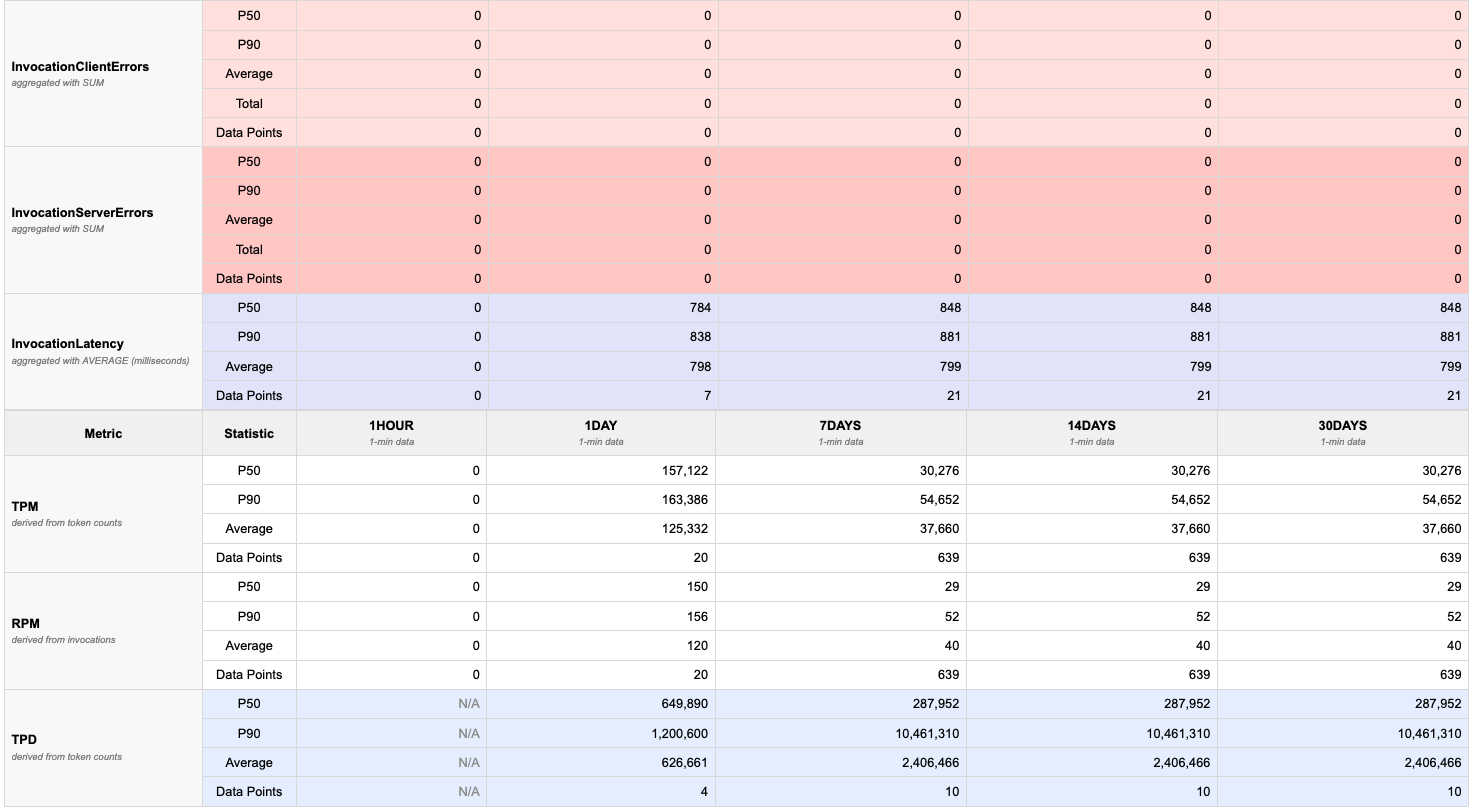
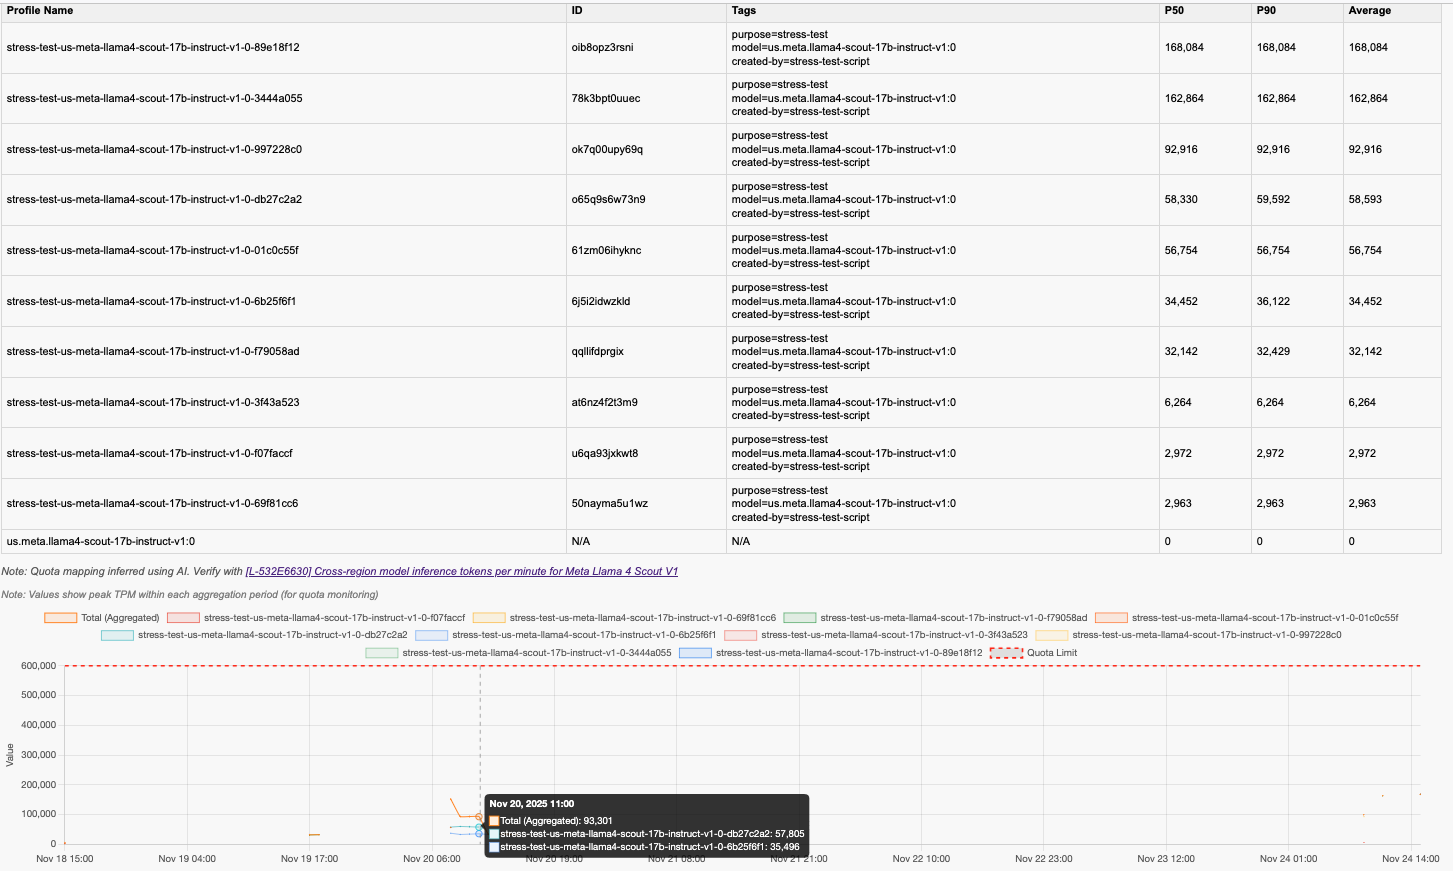
The report includes:
- Quota visualization: Red dashed lines showing TPM/RPM/TPD quotas
- Time series charts: Graphs for each time period that displays usage across application inference profiles for that model
- Percentile statistics: p50, p90, and average values in tables
- Multiple metrics: TPM, RPM, TPD (tokens-per-day), invocations, invocation throttles, client and server errors, input token count, output token count, and invocation latency.
Prerequisites
Required Software
- Python >= 3.9 with venv
- boto3 >= 1.39.7 (installed with the package; older boto3 has no custom model deployment APIs)
- AWS CLI configured with appropriate credentials
- GIT to clone this repository (only needed for development install)
AWS Account Requirements
- Bedrock Access: Enabled foundation models in your AWS account
- IAM Permissions: See detailed permission requirements below
- Supported Partitions: AWS commercial and AWS GovCloud (US). ARNs, endpoints and console links are derived from the region, so other partitions work wherever Bedrock and CloudWatch are available
Network Requirements
- Endpoint Access: For accessing APIs from Amazon CloudWatch and Amazon Bedrock, either via the internet or via-VPC access.
IAM Permissions
This tool requires different IAM permissions depending on which features you use:
Option 1: Usage Analysis Only (Lightweight)
Use this if: You only run bedrock-usage-analyzer analyze (or ./bin/analyze-bedrock-usage) to analyze token usage.
{
  "Version": "2012-10-17",
  "Statement": [
    {
      "Sid": "BedrockUsageAnalysis",
      "Effect": "Allow",
      "Action": [
        "sts:GetCallerIdentity",
        "bedrock:ListInferenceProfiles",
        "bedrock:ListCustomModelDeployments",
        "bedrock:GetCustomModelDeployment",
        "bedrock:GetCustomModel",
        "bedrock:ListImportedModels",
        "bedrock:GetImportedModel",
        "bedrock:ListTagsForResource",
        "cloudwatch:GetMetricData",
        "servicequotas:GetServiceQuota",
        "servicequotas:GetAWSDefaultServiceQuota",
        "servicequotas:ListServiceQuotas",
        "bedrock:GetModelInvocationLoggingConfiguration",
        "logs:DescribeLogGroups",
        "logs:GetQueryResults",
        "logs:StopQuery",
        "iam:ListRoleTags",
        "iam:ListUserTags"
      ],
      "Resource": "*"
    },
    {
      "Sid": "QueryInvocationLogs",
      "Effect": "Allow",
      "Action": "logs:StartQuery",
      "Resource": "arn:aws:logs:<region>:<account-id>:log-group:<invocation-log-group>:*"
    }
  ]
}
Replace the placeholders in the QueryInvocationLogs statement with the invocation log group of each analyzed Region (or drop the statement if you do not use --breakdown). In AWS GovCloud (US), write its ARN with the aws-us-gov partition (arn:aws-us-gov:logs:...).
What this allows:
sts:GetCallerIdentity- Get your AWS account IDbedrock:ListInferenceProfiles- Discover inference profiles for selected modelsbedrock:ListTagsForResource- Retrieve tags for inference profiles, custom model deployments and imported models (for metadata display)bedrock:ListCustomModelDeployments,bedrock:GetCustomModelDeployment,bedrock:GetCustomModel- Optional: analyze on-demand custom model deployments (their base model gives the quotas)bedrock:ListImportedModels,bedrock:GetImportedModel- Optional: list and name Custom Model Import models (an imported model ARN gives its usage without them)cloudwatch:GetMetricData- Fetch CloudWatch metrics for token usage (TPM, RPM, TPD, throttles)servicequotas:GetServiceQuota- Retrieve service quota limits for visualizationservicequotas:GetAWSDefaultServiceQuota- Read the default value of a quota that has no applied value (GetServiceQuota does not return those)servicequotas:ListServiceQuotas- Optional: when many quota codes are analyzed in one run, read them in one listing (without it, each code is looked up separately)bedrock:GetModelInvocationLoggingConfiguration,logs:DescribeLogGroups,logs:StartQuery,logs:GetQueryResults,logs:StopQuery- Optional: the breakdown by IAM principal (--breakdown) reads the model invocation logs with CloudWatch Logs Insights.logs:StartQuerycan be scoped to the invocation log group's ARN;logs:GetQueryResults,logs:StopQueryandlogs:DescribeLogGroupstake no log group resource and need"Resource": "*"iam:ListRoleTags,iam:ListUserTags- Optional: show the callers' IAM tags, and group by an IAM principal tag (--breakdown tag:<key>)
Note: This option uses the bundled metadata files that come with the package.
Option 2: Full Feature Access (Complete)
Use this if: You run metadata refresh commands (bedrock-usage-analyzer refresh *). This includes all permissions from Option 1 plus additional permissions:
Note: You need to replace some part with your own account ID and the region used.
{
  "Version": "2012-10-17",
  "Statement": [
    {
      "Sid": "BedrockUsageAnalysis",
      "Effect": "Allow",
      "Action": [
        "sts:GetCallerIdentity",
        "bedrock:ListInferenceProfiles",
        "bedrock:ListCustomModelDeployments",
        "bedrock:GetCustomModelDeployment",
        "bedrock:GetCustomModel",
        "bedrock:ListImportedModels",
        "bedrock:GetImportedModel",
        "bedrock:ListTagsForResource",
        "cloudwatch:GetMetricData",
        "servicequotas:GetServiceQuota",
        "servicequotas:GetAWSDefaultServiceQuota",
        "bedrock:GetModelInvocationLoggingConfiguration",
        "logs:DescribeLogGroups",
        "logs:GetQueryResults",
        "logs:StopQuery",
        "iam:ListRoleTags",
        "iam:ListUserTags"
      ],
      "Resource": "*"
    },
    {
      "Sid": "QueryInvocationLogs",
      "Effect": "Allow",
      "Action": "logs:StartQuery",
      "Resource": "arn:aws:logs:<region>:<account-id>:log-group:<invocation-log-group>:*"
    },
    {
      "Sid": "MetadataManagement",
      "Effect": "Allow",
      "Action": [
        "account:ListRegions",
        "ec2:DescribeRegions",
        "bedrock:ListFoundationModels",
        "servicequotas:ListServiceQuotas",
        "servicequotas:GetServiceQuota",
        "servicequotas:GetAWSDefaultServiceQuota"
      ],
      "Resource": "*"
    },
    {
      "Sid": "QuotaMappingWithLLM",
      "Effect": "Allow",
      "Action": [
        "bedrock:InvokeModel"
      ],
      "Resource": [
        "arn:aws:bedrock:::foundation-model/anthropic.claude-*",
        "arn:aws:bedrock:*::foundation-model/anthropic.claude-*",
        "arn:aws:bedrock:YOUR_REGION_FOR_LLM_CALL:YOUR_CURRENT_ACCOUNT_ID:inference-profile/*",
        "arn:aws:bedrock:YOUR_REGION_FOR_LLM_CALL:YOUR_CURRENT_ACCOUNT_ID:application-inference-profile/*"
      ]
    }
  ]
}
In AWS GovCloud (US), write the ARNs with the aws-us-gov partition (arn:aws-us-gov:bedrock:...).
The foundation-model ARN uses a region wildcard because a cross-region inference profile (us., eu., apac., us-gov. ...) routes each call to the model in one of several regions, and each of them must allow bedrock:InvokeModel.
Additional permissions explained:
account:ListRegions- List enabled AWS regions (forbedrock-usage-analyzer refresh regions, and forrefresh quota-indexwhen there is no regions.yml for the credentials' partition)ec2:DescribeRegions- Fallback region listing whereaccount:ListRegionsis unavailable (for example in GovCloud); used by the same commandsbedrock:ListFoundationModels- List all foundation models (forbedrock-usage-analyzer refresh fm-list)servicequotas:ListServiceQuotas- List all Bedrock quotas (forbedrock-usage-analyzer refresh fm-quotas)servicequotas:GetServiceQuota,servicequotas:GetAWSDefaultServiceQuota- Check every mapped quota code in each region before a code is removed as missing (forbedrock-usage-analyzer refresh quota-indexandrefresh fm-quotas)bedrock:InvokeModel- Invoke Claude models for intelligent quota mapping (forbedrock-usage-analyzer refresh fm-quotasonly, restricted to Claude models)
Security Best Practices
- Principle of Least Privilege: Use Option 1 if you don't need to refresh metadata
- Resource Restrictions: The
bedrock:InvokeModelpermission is limited to Claude models only that is used in quota mapping - No Write Permissions: All permissions are read-only except for model invocation
- Region Scoping: Consider adding
Conditionblocks to restrict to specific regions if needed
Setup Guide
Step 1: Clone and Set Up Environment
You can install it in three ways:
Option 1: Install from PyPI (Recommended)
pip install bedrock-usage-analyzer
# For a reproducible install (CI, shared machines), pin the release you tested:
# pip install "bedrock-usage-analyzer==<version>"

# Run the analyzer
bedrock-usage-analyzer analyze

# Or use the short alias
bua analyze
Option 2: Editable Install (For Development)
# Clone the repository
git clone https://github.com/awslabs/bedrock-usage-analyzer.git
cd bedrock-usage-analyzer

# Install in editable mode
pip install -e .

# Run using the CLI
bedrock-usage-analyzer analyze
Option 3: Using the bin scripts (Auto-setup)
# Clone the repository
git clone https://github.com/awslabs/bedrock-usage-analyzer.git
cd bedrock-usage-analyzer

# The bin scripts will automatically create venv and install
./bin/analyze-bedrock-usage

# Windows (without bash): Run Python module directly
python -m bedrock_usage_analyzer analyze
Step 2: Configure AWS Credentials
Ensure your AWS CLI is configured with credentials that have the required permissions to the right AWS account. Please refer to this documentation. Then performt he following command to verify.
# Verify your AWS identity
aws sts get-caller-identity
GovCloud Credentials Setup
If you plan to use AWS GovCloud (US) regions, you need separate credentials:
# Configure GovCloud profile
aws configure --profile govcloud
# Enter your GovCloud Access Key ID, Secret Access Key, and region (us-gov-east-1 or us-gov-west-1)

# Verify GovCloud identity
aws sts get-caller-identity --profile govcloud

# Set environment variable for GovCloud usage
export AWS_PROFILE=govcloud
Important GovCloud Notes:
- GovCloud accounts and credentials are separate from commercial AWS ones
- Commercial credentials cannot call GovCloud regions, and GovCloud credentials cannot call commercial regions
- If no region is configured for the profile, pass
--region us-gov-west-1(or setAWS_REGION) so the account check uses the GovCloud STS endpoint
Step 3: Refresh Foundation Model Lists (Optional)
Before analyzing usage, you may want to refresh the foundation model lists:
# Refresh regions list (regions of the credentials' partition; other partitions are kept)
bedrock-usage-analyzer refresh regions
# Or: ./bin/refresh-regions

# For GovCloud regions, use GovCloud credentials
AWS_PROFILE=govcloud bedrock-usage-analyzer refresh regions

# Refresh foundation models for all regions
bedrock-usage-analyzer refresh fm-list
# Or: ./bin/refresh-fm-list

# Or refresh for a specific region
bedrock-usage-analyzer refresh fm-list us-west-2
# Or: ./bin/refresh-fm-list us-west-2

# Refresh GovCloud region with GovCloud credentials
AWS_PROFILE=govcloud bedrock-usage-analyzer refresh fm-list us-gov-east-1
This step is optional because this repository comes with preloaded metadata that contains these information. However, you might want to refresh those metadata since new regions, new foundation models, or new quotas for the FMs might have come since this repository was refreshed.
Step 4: Run Usage Analysis
# Launch the interactive usage analyzer
bedrock-usage-analyzer analyze
# Or: ./bin/analyze-bedrock-usage

# For GovCloud analysis, use GovCloud credentials
AWS_PROFILE=govcloud bedrock-usage-analyzer analyze
The script will prompt you to:
- Confirm the AWS account - skipped with
-y - Select AWS region - Only regions of your credentials' partition are listed (commercial or GovCloud)
- Select granularity - Accept the default (5 minutes for every period) or pick 1 min, 5 mins or 1 hour per period
- Choose what to analyze (only asked when the region has application inference profiles, active custom model deployments or imported models) - a foundation model, specific application inference profiles, custom model deployments, or imported models
- Select model provider - Filter by provider (Amazon, Anthropic, etc.)
- Select model - Choose the specific model to analyze
- Select inference profile (if applicable) - Choose base model or cross-region profile
- Add another model? - Repeat from step 4 to add more targets to the run
- Break usage down by caller? (only asked when the region logs model invocations to CloudWatch Logs) - see Attributing usage to IAM principals
- Where to save results -
./results(default), the user data directory, or a custom path; skipped with-o
Analyzing application inference profiles
When you analyze a foundation model endpoint (for example au.anthropic.claude-haiku-4-5-20251001-v1:0), the report includes that endpoint plus every application inference profile created from it, with a per-profile breakdown and tags. The tool finds the source of each application profile by matching its routing targets against the system-defined profiles, so a copy of au.* is not confused with apac.* or jp.*.
To analyze only some application profiles, choose "Specific application inference profiles" at step 4 and enter their numbers (for example 1,3-4 or all), or pass the profile ID or ARN with --model-id:
bedrock-usage-analyzer analyze -r ap-southeast-2 -y -g 5min -o ./results \
  -m arn:aws:bedrock:ap-southeast-2:111122223333:application-inference-profile/abc123def456 \
  -m abc987zyx654
If you analyze an endpoint that has no application profiles while the account has profiles for the same model under another endpoint, the tool prints which endpoint they are on.
Analyzing custom model deployments
On-demand custom model deployments are analyzed like any other endpoint. Choose "Custom model deployments" at step 4 (shown when the region has an active one), or pass the deployment ARN, ID or name with --model-id:
bedrock-usage-analyzer analyze -r us-east-1 -y -g 5min -o ./results \
  -m arn:aws:bedrock:us-east-1:111122223333:custom-model-deployment/dep0example1
The report shows the deployment's usage (CloudWatch records it under the deployment ARN) against the custom model deployment quotas of its base model, for example "(Model customization) Sum of on demand custom model deployment tokens per minute for Amazon Nova Lite". These quotas are mapped in the fm-list as the base model's custom endpoint. They are account-wide sums over every deployment of models customized from that base model, so select all of them (all in the list, or one -m per deployment) for one aggregated report; the tool names the ones left out. A deployment whose custom model names no foundation base model shows usage without limits; so does a deployment whose details cannot be read (without the optional permissions above, a deployment ARN still gives its usage).
Customized Amazon Nova models are covered whichever way they were trained: fine-tuned or distilled in Amazon Bedrock, or trained with Amazon SageMaker AI and brought into Bedrock as a custom model. Once deployed on demand, each one is analyzed against the quotas of the Nova model it was customized from (Nova 2 Lite, Nova Lite, Nova Micro or Nova Pro, where Service Quotas lists them; other base models with such quotas, such as Llama 3.3 70B in us-west-2, work the same way).
Analyzing imported models (Custom Model Import)
Models brought in with Custom Model Import (for example a fine-tuned Llama, Mistral or Qwen) are analyzed under their imported model ARN, which is also the ID CloudWatch records their usage under. Choose "Imported models" at step 4 (shown when the region has one), or pass the ARN, ID or name with --model-id:
bedrock-usage-analyzer analyze -r us-east-1 -y -g 5min -o ./results \
  -m arn:aws:bedrock:us-east-1:111122223333:imported-model/imp0example1
Imported models have no per-model token or request quotas: Bedrock scales the model copies that serve them, so the report shows usage and throttles without limits. Passing an ID or name needs bedrock:ListImportedModels or bedrock:GetImportedModel.
Attributing usage to IAM principals
Many teams no longer create one application inference profile per service: Amazon Bedrock cost allocation by IAM principal attributes cost to the calling IAM role or user and its tags. CloudWatch's Bedrock metrics, however, have only the ModelId dimension, so every service that calls the same endpoint (for example eu.anthropic.claude-sonnet-5) shares one series. Billing data is daily, so it cannot show who drives a per-minute TPM or RPM peak.
The model invocation logs record each request's caller (identity.arn), model or profile, and token counts. With --breakdown, each report adds a Usage by ... section read from those logs with CloudWatch Logs Insights:
# By IAM principal: each role (all its sessions together) or user
bua analyze -r eu-west-1 -m eu.anthropic.claude-sonnet-5 -g 5min -y --breakdown principal
# By an IAM principal tag, the same tags you activate as iamPrincipal/<key> cost allocation tags
bua analyze -r eu-west-1 -m eu.anthropic.claude-sonnet-5 -g 5min -y --breakdown tag:team
# By role session, or by a requestMetadata key the callers send (Converse requestMetadata)
bua analyze -r us-east-1 -m us.amazon.nova-lite-v1:0 -y --breakdown session
bua analyze -r us-east-1 -m us.amazon.nova-lite-v1:0 -y --breakdown metadata:app
# Only some callers (the rest are one "(other principals)" row)
bua analyze -r us-east-1 -m us.amazon.nova-lite-v1:0 -y --principal role/OrdersService
When you pick the models interactively (no -m), the tool asks whether to break usage down once the region logs invocations to CloudWatch Logs. With -m, pass --breakdown (or --principal).
- What a row shows: a caller's tokens and requests and its share of the endpoint's total, TPM and RPM (P50, P90, max per minute), and TPD, for each period, plus a TPM chart against the quota (imported models have none, so their charts show usage only). The JSON report's
breakdown.time_seriesholds each row's TPM and RPM series per period (the HTML chart draws TPM). "Via" lists the profiles, deployments or imported models it called; for session, tag and metadata rows, the IAM principals in the group. Withprincipal, the callers' IAM tags are shown. - Totals and quotas stay CloudWatch's. Quotas are per account, Region and model, shared by all callers. Usage CloudWatch counted that the logs do not hold (logging was off, records not delivered) is shown as (not in the invocation logs), so the shares add up.
- Setup: enable model invocation logging in each analyzed Region with a CloudWatch Logs destination. Turn off text, image, embedding and video data delivery to log metadata only (the tool reads only metadata fields, never prompts or completions). Periods older than the log group's retention are marked as partly covered. S3-only logging is not read; add a CloudWatch Logs destination.
--log-groupreads another log group. - Cost: Logs Insights charges per GB scanned. The tool scans the log group once per run, for all reports, over the longest period, up to 15 days; it prints the number of queries and the GB scanned. A run over very many profiles (a model ID list longer than one 10,000-character query) scans once per batch of them, and a day with more than 100,000 per-minute result rows (for example very many sessions with
--breakdown session) is queried again in quarter-day windows (10,000 rows with an SDK whose StartQuery is capped at 10,000, such as botocore before 1.43). Metadata-only logging keeps the logs small. - Window: the breakdown ends 5 minutes before the run started, as invocation log records arrive seconds to minutes after the call; its periods end there. It reaches back at most 15 days, as far as CloudWatch keeps the 1-minute data it is compared with, so the 30-day period is marked partly covered. Failed calls (logged with an
errorCode) are not counted, as CloudWatch'sInvocationscounts only successful ones. - Many callers: each period shows its 29 largest groups as rows and chart lines; the rest are summed into one "(N smaller groups)" row.
- Limits: IAM principal tags come from
iam:ListRoleTags/iam:ListUserTags(current tags, not historical ones); STS session tags are not in the logs. Calls through thebedrock-mantleendpoints are not in the invocation logs. A role shared by several services needs distinct session names (--breakdown session) orrequestMetadatato tell them apart.
Step 4b: Scripted/Non-Interactive Usage
For automation, CI/CD pipelines, or scheduled runs, you can pass arguments directly to skip interactive prompts:
# Fully non-interactive (all arguments specified)
bedrock-usage-analyzer analyze \
  --region us-west-2 \
  --model-id amazon.nova-lite-v1:0 \
  --granularity 1min \
  --output-dir ./results

# With cross-region inference profile (note the 'us.' prefix)
bedrock-usage-analyzer analyze \
  --region us-west-2 \
  --model-id us.amazon.nova-lite-v1:0 \
  --granularity 5min

# Several targets in one run (repeat --model-id)
bedrock-usage-analyzer analyze -r us-west-2 -y -g 5min -o ./results \
  -m us.amazon.nova-lite-v1:0 -m amazon.nova-lite-v1:0

# Partial arguments (prompts only for missing values)
bedrock-usage-analyzer analyze --region us-west-2 --granularity 1hour
# → prompts for model selection only
CLI Arguments:
| Argument | Short | Description |
|---|---|---|
--region |
-r |
AWS region (e.g., us-west-2, eu-west-1) |
--model-id |
-m |
Model ID with optional prefix (e.g., amazon.nova-lite-v1:0 for base, us.amazon.nova-lite-v1:0 for cross-region, us-gov. for GovCloud), a system inference profile or foundation-model ARN, an application inference profile ID/ARN, an on-demand custom model deployment ARN/ID/name, or a Custom Model Import model ARN/ID/name. Repeat to analyze several |
--granularity |
-g |
Aggregation granularity (see below) |
--output-dir |
-o |
Directory to save results |
--yes |
-y |
Skip account confirmation prompt |
--breakdown |
Break each report down by caller from the model invocation logs: principal, session, tag:<key> or metadata:<key> (see Attributing usage to IAM principals) |
|
--principal |
Limit the breakdown to this caller (role/<name>, user/<name> or an IAM ARN). Repeat for several; implies --breakdown principal |
|
--log-group |
With --breakdown or --principal: the invocation log group to read (default: the region's model invocation logging destination) |
Granularity Options:
You can specify granularity in two ways:
-
Single value - applies to all time periods:
# Use 1-minute granularity for all periods
bedrock-usage-analyzer analyze -r us-west-2 -m amazon.nova-lite-v1:0 -g 1min

# Use 5-minute granularity for all periods
bedrock-usage-analyzer analyze -r us-west-2 -m amazon.nova-lite-v1:0 -g 5min

# Use 1-hour granularity for all periods
bedrock-usage-analyzer analyze -r us-west-2 -m amazon.nova-lite-v1:0 -g 1hour
-
JSON format - different granularity per time period:
# Fine granularity for recent data, coarser for older data
bedrock-usage-analyzer analyze \
  -r us-west-2 \
  -m amazon.nova-lite-v1:0 \
  -g '{"1hour":"1min","1day":"5min","7days":"1hour","14days":"1hour","30days":"1hour"}'
When using JSON format, you must specify all five time periods:
1hour,1day,7days,14days,30days. Valid values for each are:1min,5min,1hour.
Multi-Account Usage with AWS_PROFILE:
To analyze usage in different AWS accounts, use the AWS_PROFILE environment variable:
# Fully programmatic example (no prompts, no confirmations)
AWS_PROFILE=my-profile-name bua analyze -r us-west-2 -m us.meta.llama4-scout-17b-instruct-v1:0 -g 1min -y -o .

# Use a specific AWS profile
AWS_PROFILE=production bedrock-usage-analyzer analyze \
  -r us-west-2 \
  -m amazon.nova-lite-v1:0 \
  -g 1min \
  -y

# Or export for multiple commands
export AWS_PROFILE=production
bedrock-usage-analyzer analyze -r us-west-2 -m amazon.nova-lite-v1:0 -g 1min
bedrock-usage-analyzer analyze -r us-east-1 -m amazon.nova-lite-v1:0 -g 1min

# Switch to another account
AWS_PROFILE=development bedrock-usage-analyzer analyze \
  -r us-west-2 \
  -m amazon.nova-lite-v1:0 \
  -g 1min
Ensure your ~/.aws/credentials file has the profiles configured:
[production]
aws_access_key_id = AKIA...
aws_secret_access_key = ...

[development]
aws_access_key_id = AKIA...
aws_secret_access_key = ...
Or use SSO profiles in ~/.aws/config:
[profile production]
sso_start_url = https://my-sso.awsapps.com/start
sso_region = us-east-1
sso_account_id = 123456789012
sso_role_name = PowerUserAccess
region = us-west-2
Step 5: View Results
After analysis completes, find your results in the results/ directory:
# List generated reports
ls -lh results/

# Open HTML report in browser (macOS)
open results/<model-name>-<timestamp>.html

# Open HTML report in browser (Linux)
xdg-open results/<model-name>-<timestamp>.html

# View JSON data
cat results/<model-name>-<timestamp>.json | jq
Understanding the Results
HTML Report Structure
The HTML report contains several sections:
1. Quota Limits Section (if available)
- Shows the TPM, RPM, TPD and concurrent-request quota limits mapped for the endpoint (none for imported models)
- Displayed at the top for quick reference
2. Statistics Summary
- One column per time period (1HOUR, 1DAY, 7DAYS, 14DAYS, 30DAYS), labelled with its granularity
- Per metric, rows for P50, P90, Average, Total (summed metrics only) and Data Points
- Metrics: InputTokenCount, OutputTokenCount, Invocations, InvocationThrottles, InvocationClientErrors, InvocationServerErrors, InvocationLatency; a second table has TPM, RPM and TPD (always from 1-min data)
3. Usage by ... (with --breakdown or --principal)
- Per-caller tokens, requests, shares, TPM/RPM (P50, P90, max) and TPD per period, read from the model invocation logs
4. Charts
- Time series graphs for each metric and time period
- Red dashed lines: Quota limits (when available)
- Colored lines: Model usage over time
- Hover over points to see exact values
- The chart can have multiple lines showing the aggregated (total) usage for that metric and the individual application inference profile usage
Interpreting the Data
Token Usage Patterns:
- p50 (median): Typical usage - 50% of time periods are below this
- p90: High usage - only 10% of time periods exceed this
- Average: Mean value across all data points
- Total: Sum of all values in the period
Quota Comparison:
- If lines approach or cross red dashed quota lines, you may hit limits
- Consistent p90 near quota suggests you need a quota increase
- Large gap between p50 and quota indicates headroom
- IMPORTANT: Please cross-check the quota with ones from AWS service quotas manually, since the large language model-mapped quotas might not be always accurate.
Throttles:
- Any non-zero throttle count indicates you've hit rate limits
- Check which time periods show throttles to identify peak usage times
Advanced Features
Quota Mapping
The tool can automatically map AWS Service Quotas to foundation models:
# Run the quota mapping tool
bedrock-usage-analyzer refresh fm-quotas
# Or: ./bin/refresh-fm-quotas-mapping
How it works:
- Uses Bedrock foundation model to extract base model family names (e.g., "nova-lite" → "nova")
- Matches quota names containing model family + endpoint type
- Recognizes "on-demand", "cross-region", "global" and, for the
customendpoint, "custom model deployment" quota patterns - Only makes one inference call per endpoint type of a model (on-demand, cross-region, global, custom), plus one to name the model family
- Caches results to avoid redundant API calls
You can then validate the mapped quota. To make the validation easier, you can run the following command to create a .csv file where each row constitutes the model, endpoint, and metric combination.
# Generate quota index CSV
bedrock-usage-analyzer refresh quota-index
# Or: ./bin/refresh-quota-index
The CSV file will be saved in your user data directory (see Metadata Storage). You can then validate the mapping for each row, either manually or with your AI assistant.
Customizing Analysis
The analyzer supports various customization options through the interactive prompts:
Model Selection:
- Filter by provider to narrow down choices
- Select specific model variants
- Choose inference profiles (base, us, eu, jp, au, apac, ca, in, us-gov, global)
Time Periods:
- 1hour: Recent short-term patterns
- 1day: Daily patterns
- 7days: Weekly trends
- 14days: Bi-weekly patterns
- 30days: Monthly trends
Available Commands
CLI Commands (installed package)
# Main analysis
bedrock-usage-analyzer analyze

# Refresh metadata
bedrock-usage-analyzer refresh regions              # Refresh AWS regions list
bedrock-usage-analyzer refresh fm-list              # Refresh FM lists for all regions
bedrock-usage-analyzer refresh fm-list us-west-2    # Refresh FM list for specific region
bedrock-usage-analyzer refresh fm-quotas            # Refresh quota mappings (interactive)
bedrock-usage-analyzer refresh quota-index          # Generate quota index CSV

# For maintainers: update the checkout's bundled metadata (user copies are left alone)
bedrock-usage-analyzer refresh regions --update-bundle
bedrock-usage-analyzer refresh fm-list --update-bundle
Short alias: You can use bua instead of bedrock-usage-analyzer for all commands above.
Bin Scripts (for git clone users)
./bin/analyze-bedrock-usage
- Main script for analyzing token usage
- Interactive prompts for region, provider, model selection
- Generates JSON and HTML reports (asks for the output directory unless
-ois given; default./results)
./bin/refresh-regions
- Fetches enabled AWS regions for your account
- Run when you enable new regions
./bin/refresh-fm-list [region]
- Fetches foundation models and inference profiles
- Run without argument to refresh all regions
- Run with region argument to refresh specific region
- Preserves existing quota mappings
./bin/refresh-fm-quotas-mapping
- Intelligently maps service quotas to foundation models
- Arguments:
[target_region] [bedrock_region] [model_id]- all optional - Examples:
# Interactive mode - prompts for all parameters
./bin/refresh-fm-quotas-mapping

# Skip region selection - only process us-east-1
./bin/refresh-fm-quotas-mapping us-east-1

# Skip all prompts - process us-east-1 using us-west-2 for API calls
./bin/refresh-fm-quotas-mapping us-east-1 us-west-2 us.anthropic.claude-haiku-4-5-20251001-v1:0
./bin/refresh-quota-index
- Generates CSV index of all quota mappings for validation
Metadata Storage
The tool uses metadata files (regions, FM lists, quota mappings) from these locations:
Default Locations (via platformdirs)
| OS | Path |
|---|---|
| Linux | ~/.local/share/bedrock-usage-analyzer/ |
| macOS | ~/Library/Application Support/bedrock-usage-analyzer/ |
| Windows | %LOCALAPPDATA%\bedrock-usage-analyzer\ |
Custom Location
Set the BEDROCK_ANALYZER_DATA_DIR environment variable:
export BEDROCK_ANALYZER_DATA_DIR=/path/to/custom/location
Reset to Defaults
Delete the user data directory to revert to bundled defaults:
# Linux
rm -rf ~/.local/share/bedrock-usage-analyzer/

# macOS
rm -rf ~/Library/Application\ Support/bedrock-usage-analyzer/
Troubleshooting and advanced scenarios
Analysis Issues
Q: The report shows no usage (empty charts, zero data points) A: CloudWatch has no Bedrock data for the selected endpoint. Verify:
- The model was called in the selected region through this endpoint: base model ID,
us./eu./global.profile, application profile, deployment or imported model ARN (a cross-region profile's usage is not under the base model ID) - The calls fall inside the analyzed periods (up to 30 days)
Q: Quota limits not showing in report A: Quotas are only shown if they've been mapped. You can:
- Manually edit quota mappings in the user data directory, or
- Re-run
bedrock-usage-analyzer refresh fm-quotas.
If the quota limits are still not shown, it could be that the FM is not yet listed. You can run bedrock-usage-analyzer refresh fm-list before bedrock-usage-analyzer refresh fm-quotas.
Q: "is not a model, inference profile or application inference profile known in " or "Foundation model list not found for region" A: Refresh the foundation model list of that region:
bedrock-usage-analyzer refresh fm-list <region>
Quota Mapping Issues
Q: Quota mapping fails with "ValidationException" A: Ensure:
- The selected Bedrock region supports the chosen model
- You have access to the Claude model you selected
- The model ID is correct (check for typos)
Q: Some models show no quota mappings A: This can happen if:
- The model is new and quotas haven't been created yet
- The model name doesn't match quota naming patterns
- The foundation model couldn't identify matching quotas
Permission Issues
Q: "AccessDenied" errors A: Verify your IAM permissions. See the IAM Permissions section for detailed permission requirements. Use:
- Option 1 if you only run
bedrock-usage-analyzer analyze - Option 2 if you also run
bedrock-usage-analyzer refreshcommands
Performance Issues
Q: Analysis is very slow A: CloudWatch queries can take time for large time ranges; the tool always fetches all five periods. To speed up:
- Use coarser granularity for the long periods, e.g.
-g '{"1hour":"5min","1day":"5min","7days":"1hour","14days":"1hour","30days":"1hour"}'(the default is 5 minutes everywhere). This shortens the throttle, error and latency queries; token counts and invocations are always read at 1 minute, for TPM, RPM and TPD - Analyze fewer targets per run (fewer
-mvalues or application profiles) - Check your network connection to AWS
Advanced scenarios
Q: How do I use this tool with AWS GovCloud? A: Use GovCloud credentials and a GovCloud region; see AWS GovCloud (US) and other partitions.
Q: My application inference profiles show no data
A: Check the endpoint you selected. Profiles are grouped under the endpoint they were copied from (au, apac, global, base model, ...). The tool prints a note when your profiles are under a different endpoint, or you can pick them directly as described in Analyzing application inference profiles.
Q: How do I switch to different AWS accounts when using this tool? A: You can use different AWS profile as shown in the following code snippet:
AWS_PROFILE=<YOUR AWS PROFILE NAME> bedrock-usage-analyzer analyze
# Or: AWS_PROFILE=<YOUR AWS PROFILE NAME> ./bin/analyze-bedrock-usage
AWS GovCloud (US) and other partitions
The tool supports AWS GovCloud (US) (us-gov-east-1, us-gov-west-1) next to commercial regions. No setting is needed; it works from the region and the credentials:
- Region picker: the partition of your credentials is read from the STS caller identity, and only regions of that partition are listed. The bundled region list contains both commercial and GovCloud regions.
- Endpoints: boto3 resolves the endpoint for the region's partition, so your
AWS_ENDPOINT_URL_*, FIPS and VPC endpoint settings still apply. - ARNs and console links: built for the region's partition (
arn:aws-us-gov:...,console.amazonaws-us-gov.com) without extra API calls. - Inference profiles: GovCloud cross-region profiles use the
us-gov.prefix, e.g.us-gov.anthropic.claude-sonnet-4-5-20250929-v1:0. - Metadata refresh:
refresh regionsupdates only the regions of the credentials' partition and keeps the others, so commercial and GovCloud users can share one metadata directory.refresh fm-listandrefresh fm-quotasprocess only the regions your credentials can call.
# Verify GovCloud access
aws sts get-caller-identity --profile govcloud --region us-gov-west-1

# Refresh GovCloud metadata. The GovCloud model lists are bundled, but their quota
# mappings are not: without fm-quotas the reports show usage without quota limits.
AWS_PROFILE=govcloud bedrock-usage-analyzer refresh regions
AWS_PROFILE=govcloud bedrock-usage-analyzer refresh fm-list us-gov-west-1
AWS_PROFILE=govcloud bedrock-usage-analyzer refresh fm-quotas us-gov-west-1

# Analyze
AWS_PROFILE=govcloud bedrock-usage-analyzer analyze --region us-gov-west-1
If you pass a region from another partition than your credentials (for example --region us-gov-west-1 with commercial credentials), the tool stops with an explanation instead of failing on the first API call. Model availability and quotas in GovCloud differ from commercial regions; check the AWS GovCloud (US) user guide.
Security Considerations
- Credentials: Never commit AWS credentials to the repository
- Quota Data: Quota information is fetched from AWS and not hardcoded
- API Calls: All Bedrock API calls use your AWS credentials
- Data Storage: Analysis results are stored locally in
results/. Refreshed metadata is stored in your user data directory (see Metadata Storage) - Invocation logs:
--breakdownreturns only metadata fields of the model invocation logs (caller ARN, model ID, token counts, request metadata). When the logs hold prompt and completion bodies, the Logs Insights query scans them server-side (and they are billed as scanned bytes), but they are never returned to or stored by the tool; metadata-only delivery keeps them out of the logs altogether. Reports with a breakdown contain caller ARNs, role names and IAM tags: share them like other account inventory
Cost Considerations
When using bedrock-usage-analyzer analyze (or ./bin/analyze-bedrock-usage), the following cost is expected:
- CloudWatch GetMetricData that is measured on the number of metrics requested
- Refer to CloudWatch pricing page to view the unit price per region.
- The total cost of this component depends on the number of metrics being requested, that also depends on how many FMs are included in the query and how many times this tool is run
- With
--breakdown: CloudWatch Logs Insights queries, charged per GB of the invocation log group scanned (once per run, over up to 15 days; a day with more than 100,000 per-minute result rows is queried again in smaller windows; the run prints the queries and GB scanned). Model invocation logging itself is charged as CloudWatch Logs ingestion and storage.
When running bedrock-usage-analyzer refresh fm-quotas (or ./bin/refresh-fm-quotas-mapping) to refresh the mapping between FM metric and the quotas, the following additional cost will apply:
- Bedrock model invocation cost that is based on the total tokens used.
- This is because this functionality invokes FM in Bedrock to intelligently perform the mapping.
- Refer to Bedrock pricing page
- The cost will depend on the FM chosen to perform the intelligent mapping, as well as the number of available FMs and quotas to map. One can run this functionality against only 1 region to save cost, instead of refreshing FM mapping for all regions.
1 maintainer

Metadata
1 maintainer
Release files for bedrock-usage-analyzer 0.7.0b0
For a detailed explanation of source distributions (sdists) and built distributions (wheels), please see the package formats documentation.
Source distribution (sdist)
| File | Size | Uploaded | |
|---|---|---|---|
| bedrock_usage_analyzer-0.7.0b0.tar.gz | 296.2 kB | Details |
Built distribution (wheel)
| File | Interpreter | ABI | Platform | Reset |
|---|---|---|---|---|
| bedrock_usage_analyzer-0.7.0b0-py3-none-any.whl | Python 3 | none | any | Details |
Total release size: 549.3 kB
Release files / bedrock_usage_analyzer-0.7.0b0.tar.gz
| Download URL | bedrock_usage_analyzer-0.7.0b0.tar.gz |
|---|---|
| Size | 296.2 kB |
| Tags | Source |
|
SHA-256 checksum How to use checksums |
8aaca5f5c763cad1d3728ae1c64577c49c846885259ee9106d20387e7f4e2710
|
|
BLAKE2b-256 checksum How to use checksums |
0458c6fa23fb112435d35b0a7e817efeead246d2bf341ff94087f883ddaaab45
|
| Upload date | |
|
Uploaded using Trusted Publishing? What is trusted publishing? |
No |
| Uploaded via |
twine/7.0.0 CPython/3.14.7
|
Release files / bedrock_usage_analyzer-0.7.0b0-py3-none-any.whl
| Download URL | bedrock_usage_analyzer-0.7.0b0-py3-none-any.whl |
|---|---|
| Size | 253.1 kB |
| Tags | Python 3 |
|
SHA-256 checksum How to use checksums |
3e47bc15e3f56075abead59812fcc26de16a167de7c9f0a899da9a898edd3f96
|
|
BLAKE2b-256 checksum How to use checksums |
9185506667445a8ab14d28c24a60ac041b3340e251760618d351138d54c2929e
|
| Upload date | |
|
Uploaded using Trusted Publishing? What is trusted publishing? |
No |
| Uploaded via |
twine/7.0.0 CPython/3.14.7
|














