
better-tables


A lightweight Python package to render pandas DataFrames into clean LaTeX and HTML tables for research reports, dashboards and publication-ready documents.
-
Lightweight DataFrame wrapper: a unified entry point and object to turn a DataFrame into a report-ready table
-
Research-oriented: built for statistics, econometrics and regression-style outputs, with native significance support
-
MultiIndex-friendly: smart handling of complex row and column MultiIndex tables
-
Style and formatting focused: flexible formatting rules and advanced styling options for precise rendering control
Install
pip install better-tables
Development (uv)
git clone https://github.com/thibault-charbonnier/better-tables.git
cd better-tables
uv sync
Quickstart
import pandas as pd
from better_tables import build_table

df = pd.DataFrame(...)

table = build_table(
    df=df,
    title="Performance Summary",
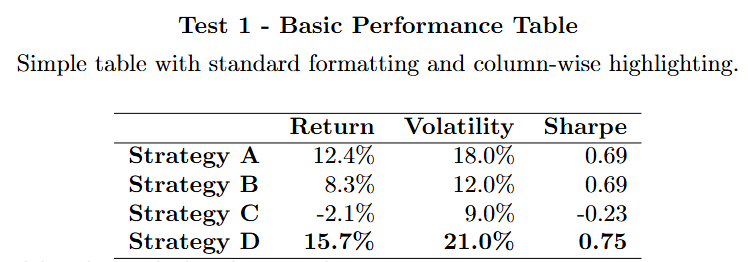
    caption="Illustrative performance metrics of our strategies (2020-2025).",
    style="academic",
    highlight_mode="max",
    highlight_axis="columns",
)

latex = table.to_latex()
html = table.to_html()
Core features
1) Clean rendering from DataFrame
better-tables is built around one high-level abstraction: ReportTable.
You start from a pandas.DataFrame, add optional metadata and formatting rules, and render the result to LaTeX or HTML.
2) Per-metric formatting
Formatting can be applied by rows or by columns.
Supported formatting options include:
- plain numeric formatting
- percentage formatting
- custom decimal precision
- fully custom formatter functions
formats = {
    "Return": {"kind": "percent", "percent_input": "ratio", "decimals": 2},
    "Volatility": {"kind": "percent", "percent_input": "ratio", "decimals": 1},
    "Volume": {"kind": "number", "formatter": lambda v: f"{int(v):,}"},
}
format_axis = "rows" # "rows" or "columns"
Percent semantics
Percentage formatting is explicit:
kind="percent"means the output should display%percent_input="ratio"means0.123 -> 12.3%percent_input="percent"means12.3 -> 12.3%
Note: you can use a dedicated MetricFormat object instead of a raw dictionary, with the same arguments.`
MetricFormat(
    kind="number",              # "number" or "percent"
    percent_input="ratio",      # "ratio" or "percent"
    decimals=2,
    formatter=None,
)

# Both are accepted :
formats = {
    "Return": MetricFormat(kind="percent", percent_input="ratio", decimals=3),
    "Volatility": {"kind": "percent", "percent_input": "ratio", "decimals": 1}
}
3) Conditional highlighting
Highlight the maximum or minimum values by row or by column.
The visual appearance of the highlight is controlled by the selected style (see the dedicated section below).
table = build_table(
    df=df,
    highlight_mode="max",
    highlight_axis="columns",
)
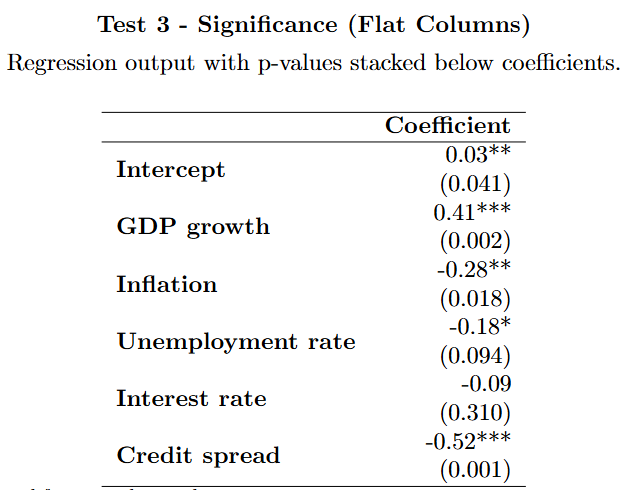
4) Significance rendering for statistics/econometrics tables
better-tables supports a compact significance workflow for econometrics and regression-style outputs, driven by the following parameters:
significance_stat=None | "pvalue" | "stderr" | "tstat": significance statistic to look for and put between parenthesissignificance_layout="stack" | "inline": whether to place the value in parentheses directly after the coefficient (inline) or on a new line below it (stack)`significance_thresholds=(0.10, 0.05, 0.01): pvalue thresholds for significance stars
We use the following simple convention :
- If significance_stat is not
Nonethen for every columncol, the code will look forcol_{stat}wherestatis the selected statistic ("pvalue" | "stderr" | "tstat") and the two will be merged as :{col_value} ({stat_value})and will keep the name of the original column. - If significance_stat is
Noneall columns are left unchanged.
Example with p-values
df = pd.DataFrame(
    {
        "Est_Coeff": [0.03, 0.41, -0.28],
        "Est_Coeff_pvalue": [0.041, 0.002, 0.018],
    },
    index=["Intercept", "GDP growth", "Inflation"],
)

table = build_table(
    df=df,
    style="academic",
    significance_stat="pvalue",
    significance_layout="stack",
)
Notes:
- stars are computed only from p-values
- if
significance_stat="stderr"or"tstat", the auxiliary statistic is shown in parentheses but no stars are added - if
significance_stat=None, no merging is performed
5) MultiIndex support
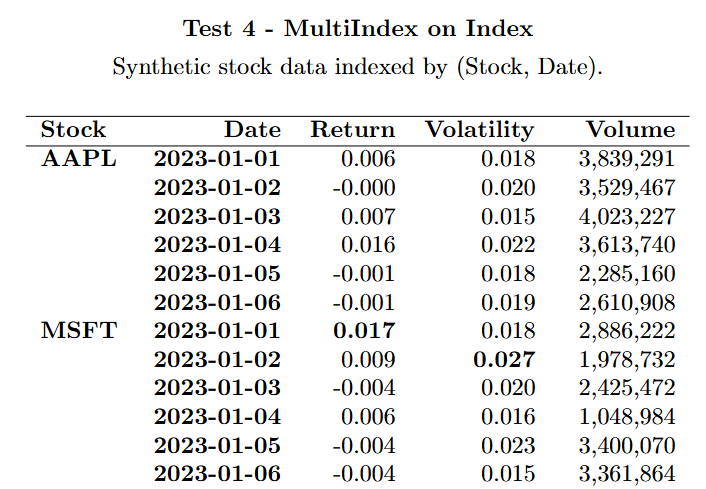
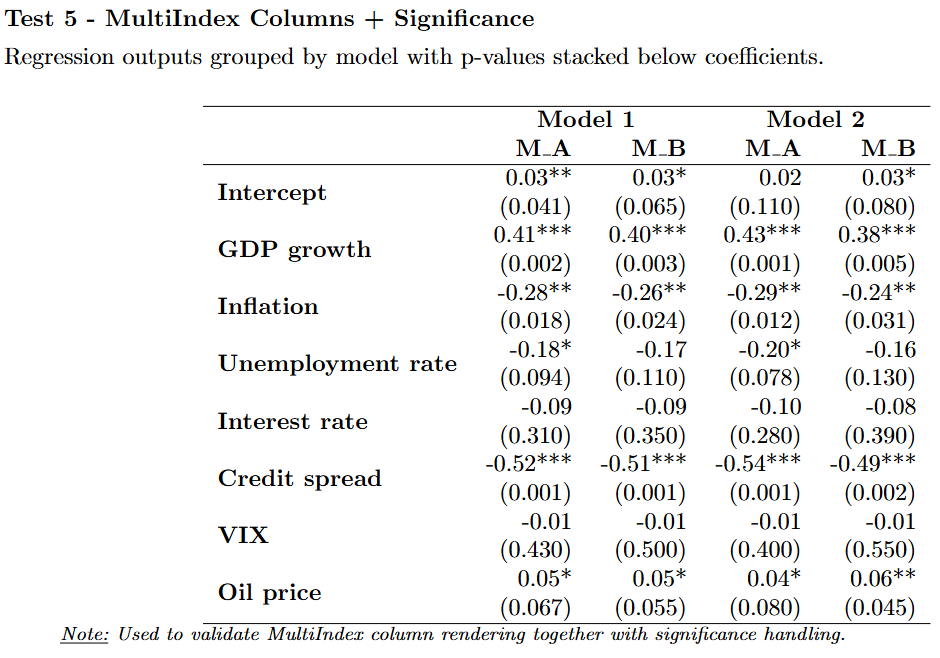
MultiIndex handling is supported natively, without any additional parameters.
Row MultiIndex
A row MultiIndex is rendered as multiple stub columns on the left, with repeated labels displayed sparsely.
Column MultiIndex
A column MultiIndex is rendered as a grouped multi-level header.
6) LaTeX and HTML output
Two backends are supported through the same API :
to_latex()for publication-grade LaTeX outputto_html()for notebooks, dashboards or web integration
latex = table.to_latex()
html = table.to_html()
Save as .tex or compile to PDF
Please note that compiling to PDF requires a LaTeX compiler as pdflatex, xelatex or lualatex.
Users must ensure that the specified engine is installed and available in the system PATH.
For example, MiKTeX can be installed from: https://miktex.org/download.
table.to_latex(save_as_tex=True, path="outputs/my_table.tex")
table.to_latex(save_as_pdf=True, path="outputs/my_table.pdf")
7) Built-in styles
Three predefined styles are currently available, each designed for a slightly different reporting context.
-
academic
The default style, designed for research notes, reports and publication-oriented tables. It offers a good trade-off between a light minimalist layout and a more explicit, highly readable table structure. This is the best default choice for regression tables, performance summaries and most professional documents. -
minimal
A stripped-down style with no outer border and no internal lines.
It is useful when you want a very light visual footprint, for example in dashboards or notebooks. -
boxed
A more explicit, framed style with a full box, internal horizontal lines and inner vertical separators. It is helpful when readability through clear cell separation matters more than visual minimalism, for example in dense operational tables.
You can also override specific style fields without redefining an entire style:
table = build_table(
    ...
    style_options={
        "bold_index": True,
        "highlight_bold": True,
        "highlight_color": "red",
    },
)
API reference
build_table
Main convenience constructor.
build_table(
    df,
    *,
    title=None,
    caption=None,
    style="academic",
    title_align="center",
    caption_align="left",
    title_position="above",
    caption_position="below",
    formats=None,
    format_axis="rows",
    note=None,
    style_options=None,
    highlight_mode=None,
    highlight_axis="rows",
    default_format=None,
    significance_stat=None,
    significance_layout="stack",
    significance_thresholds=(0.10, 0.05, 0.01),
)
ReportTable
Main rendering object returned by the build_table method.
Public methods
to_latex(save_as_tex=False, save_as_pdf=False, path=None, latex_engine=None, float_env=True)to_html()
License
MIT License
Copyright (c) 2026 better-tables Contributors
See LICENSE file for details.
1 maintainer

Metadata
1 maintainer
Release files for better-tables 1.1.0
For a detailed explanation of source distributions (sdists) and built distributions (wheels), please see the package formats documentation.
Source distribution (sdist)
| File | Size | Uploaded | |
|---|---|---|---|
| better_tables-1.1.0.tar.gz | 23.0 kB | Details |
Built distribution (wheel)
| File | Interpreter | ABI | Platform | Reset |
|---|---|---|---|---|
| better_tables-1.1.0-py3-none-any.whl | Python 3 | none | any | Details |
Total release size: 46.5 kB
Release files / better_tables-1.1.0.tar.gz
| Download URL | better_tables-1.1.0.tar.gz |
|---|---|
| Size | 23.0 kB |
| Tags | Source |
|
SHA-256 checksum How to use checksums |
b92ec0596f138561489031bd2c70cbd6520a980c65428f6303bbb59de3999aae
|
|
BLAKE2b-256 checksum How to use checksums |
0b22b5121f7b5c80d904e6abd69bf62e6c8e9b3640590a27db0c6b702cc57e2e
|
| Upload date | |
|
Uploaded using Trusted Publishing? What is trusted publishing? |
No |
| Uploaded via |
uv/0.11.4 {"installer":{"name":"uv","version":"0.11.4","subcommand":["publish"]},"python":null,"implementation":{"name":null,"version":null},"distro":{"name":"Ubuntu","version":"24.04","id":"noble","libc":null},"system":{"name":null,"release":null},"cpu":null,"openssl_version":null,"setuptools_version":null,"rustc_version":null,"ci":true}
|
Release files / better_tables-1.1.0-py3-none-any.whl
| Download URL | better_tables-1.1.0-py3-none-any.whl |
|---|---|
| Size | 23.5 kB |
| Tags | Python 3 |
|
SHA-256 checksum How to use checksums |
cf3e445b15d4e754e06643ad31428fcf4f341f0a37491918cbb06bcad9ffd358
|
|
BLAKE2b-256 checksum How to use checksums |
082814b4788bff81e675f7003e8e2fac19e2827176f1cc94a33feae9011a97c5
|
| Upload date | |
|
Uploaded using Trusted Publishing? What is trusted publishing? |
No |
| Uploaded via |
uv/0.11.4 {"installer":{"name":"uv","version":"0.11.4","subcommand":["publish"]},"python":null,"implementation":{"name":null,"version":null},"distro":{"name":"Ubuntu","version":"24.04","id":"noble","libc":null},"system":{"name":null,"release":null},"cpu":null,"openssl_version":null,"setuptools_version":null,"rustc_version":null,"ci":true}
|














