
Bezel Charts for Python
Polished SVG charts straight from a pandas DataFrame.
The Python companion to Bezel Charts. Pass in a DataFrame, a Series, a NumPy array or a plain list and get back a finished chart tile that shows up in Jupyter, saves as an .svg for a README, and drops into reports and slides. Zero dependencies.
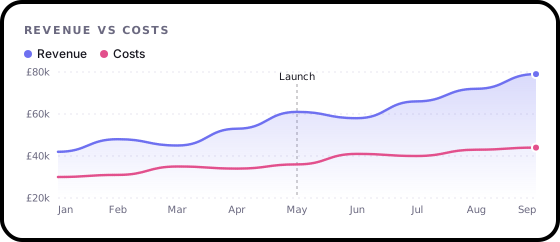
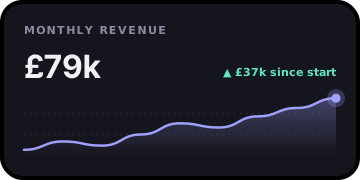
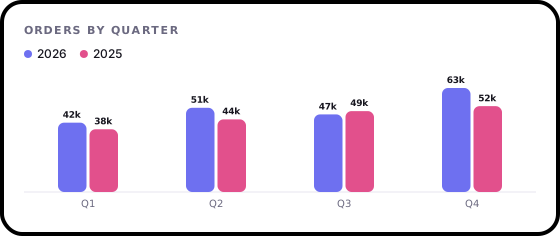
- Identical to the web components. The renderers are a line-by-line port of the JavaScript ones, and the test suite checks they draw the same SVG, byte for byte.
- pandas friendly. Pick columns with
x=andy=. Dates, indexes and column names become labels and legends. - Made for READMEs. Every chart is a self-contained SVG with no scripts and no fonts to load, so GitHub shows it.
- No dependencies. pandas and NumPy work when you have them, and are never required.
Install
pip install bezel-charts
Python 3.10 or newer.
Quick start
import pandas as pd
import bezel_charts as bc

df = pd.DataFrame({
    "month": pd.date_range("2026-01-01", periods=9, freq="MS"),
    "Revenue": [42, 48, 45, 53, 61, 58, 66, 72, 79],
    "Costs": [30, 31, 35, 34, 36, 41, 40, 43, 44],
})

bc.line(df, x="month", x_format="%b", heading="Revenue vs costs",
        prefix="£", suffix="k", notes={"May": "Launch"}, theme="light")
In a notebook the chart appears as the cell's output. Anywhere else:
chart = bc.spark(df["Revenue"], heading="Monthly revenue", prefix="£", suffix="k")
chart.save("docs/revenue.svg")   # write an .svg file
svg = str(chart)                 # or use the SVG string directly
Then in your README:

Charts in this release
| Function | What it draws |
|---|---|
bc.spark(data) |
A sparkline with the latest value and the change since the start. |
bc.line(data) |
A line chart with one or more series, a value axis, labels and a legend. |
bc.bars(data) |
Bars, vertical or horizontal. Several columns or series become grouped bars side by side. |
bc.scatter(df, x=, y=) |
A scatter plot with optional groups and a least-squares trend line showing Pearson's r. |
bc.heatmap(data) |
A calendar heatmap with one square per day, like a GitHub contributions chart. |
bc.ring(data) |
Progress rings, one per value, out of 100 unless you set max. |
bc.donut(data) |
Parts of a whole, with the total in the middle and percentages alongside. |
Gauge and progress bars are coming in the next release. bc.types lists what's available.
Bars
# Grouped bars: one group per quarter, one bar per year
sales = pd.DataFrame({"quarter": ["Q1", "Q2", "Q3", "Q4"], "2026": [42, 51, 47, 63], "2025": [38, 44, 49, 52]})
bc.bars(sales, x="quarter", heading="Orders by quarter", suffix="k", show_values=True)

# Counts straight from value_counts(), as horizontal bars for long labels
bc.bars(df["language"].value_counts(), horizontal=True, heading="Languages", suffix=" people")
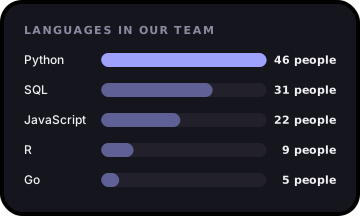
With one series the highest bar is highlighted. Turn that off with highlight="none", or pass several colours to give each bar its own.
Scatter
bc.scatter(study, x="Hours studied", y="Exam score", trend=True, heading="Study time vs results", suffix="%")
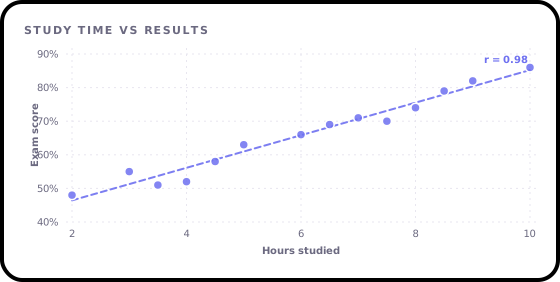
trend=True draws the least-squares line and labels it with Pearson's r. by="team" splits the points into coloured groups, each with its own trend line, and label="name" names each point so notes={"Ada": "Top scorer"} can point at it. The column names become the axis titles unless you set x_label and y_label. Rows with a missing x or y are left out, with a warning. Without a DataFrame, pass the values: bc.scatter(x=[1, 2, 3], y=[4, 6, 5]).
Heatmap
# Daily totals: a Series with a date index, or a DataFrame with a date column and a value column
bc.heatmap(runs, heading="Running", suffix=" km", stat="total")
bc.heatmap(df, x="date", y="km")

# Just dates: each day counts how many times it appears, such as commits or sign-ups
bc.heatmap(commits["timestamp"])

# Plain daily numbers, ending today unless you give a start date
bc.heatmap([0, 2, 5, 1], start="2026-10-01")
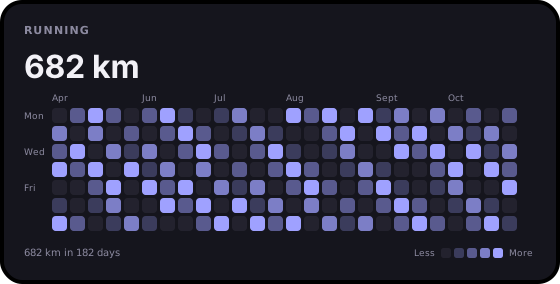
Days with nothing get 0, so the calendar has no gaps. On a narrow tile the most recent weeks are kept.
Rings and donut
bc.ring({"Move": 72, "Exercise": 45, "Stand": 90}, heading="Today")
bc.ring([3, 5], labels=["Read", "Write"], max=8, suffix=" h")

bc.donut(budget, x="category", y="spend", heading="Monthly spending", prefix="£", center_label="Spent")
bc.donut(df["browser"].value_counts())
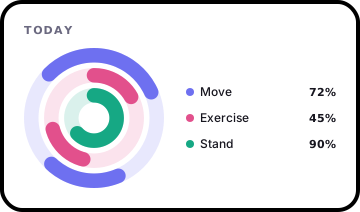
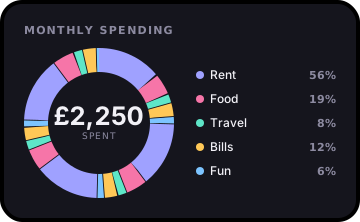
Both take a list, a dict of name to value, a Series (its index gives the names) or a DataFrame with x= and y=. Rings are percentages unless you set max, prefix or suffix. A donut with more than six parts keeps the five largest and adds the rest up as "Other".
Your data
| You pass | You get |
|---|---|
| A list, tuple or NumPy array | One series. |
| A pandas Series | One series, with the index as labels unless it's the default 0, 1, 2. |
| A DataFrame | y="col" or y=["a", "b"] picks the series (by default every numeric column), x="col" the labels (by default the index). |
A dict like {"Team A": [...], "Team B": [...]} |
One series per key, named in the legend. |
| A list of lists | One series per inner list. |
Dates become 2026-03-01, or anything you like with x_format="%b %Y". Missing values are drawn as 0, like the browser version, with a warning so they never go unnoticed. Call .dropna() or .fillna() first if you'd rather handle them yourself.
Options
Every option from the web components works as a keyword argument. Use snake_case: show-values becomes show_values=True.
| Option | Example | What it does |
|---|---|---|
heading |
heading="Sales" |
Small title at the top. |
prefix, suffix |
prefix="£", suffix=" kWh" |
Around every number. |
decimals |
decimals=1 |
Fixed decimal places. |
compact |
compact=True |
15,500 becomes 15.5k. |
stat |
stat="average" |
Headline number: last, total, average, max, min or none. |
delta, delta_label |
delta="inverse" |
Change since the start. inverse makes a fall the good direction. |
goal, goal_label |
goal=50, goal_label="Target" |
A dashed target line. |
notes |
notes={"May": "Launch"} |
Notes on points, keyed by label or position. |
show_values |
show_values=True |
A label on every point. |
straight |
straight=True |
Straight segments instead of curves. |
zero |
zero=True |
Start the axis at zero (line). |
horizontal |
horizontal=True |
Bars run sideways, good for long labels (bars). |
highlight |
highlight="none" |
Stop the highest bar standing out (bars). |
trend |
trend=True |
Least-squares trend line with Pearson's r (scatter). |
x_label, y_label |
x_label="Hours" |
Axis titles (scatter). |
start |
start="2026-01-01" |
The first day (heatmap). |
max |
max=8 |
What a full ring means (ring). |
center_label |
center_label="Spent" |
The word under the total (donut). |
labels, series |
labels=["Q1", "Q2"] |
Set labels and series names by hand. |
color |
color=["#ff6600", "#0066ff"] |
Series colours. |
theme |
theme="light" |
dark (the default) or light. |
width, height |
width=560 |
Size in pixels. The tile grows to fit its heading and headline. |
frame, corners, background |
frame="none" |
Drop the bezel, change the corner radius or the tile colour. |
Numbers are formatted for en-GB by default (1.5m, 2bn), or lang="en-US" for 1.5M, 2B. Other locales fall back to en-GB for now, with a warning.
Lower level
bc.to_svg(type, **options) returns the static SVG string and bc.render(type, **options) returns it with the hover targets the browser uses. Both take the same options as the JavaScript functions of the same names, and accept a dict too:
bc.to_svg("line", {"values": "1,2,3|3,2,1", "series": "A,B", "show-values": ""})
How it stays in step with the JavaScript
scripts/py-fixtures.mjs in the main repository runs the real JavaScript charts over a wide set of inputs (empty data, single values, negatives, huge and tiny numbers, notes, goals, both themes) and saves the SVG they draw. The Python tests render the same inputs and check the output is identical. CI regenerates the fixtures on every pull request, so a change to one version that isn't made to the other fails the build.
Development
git clone https://github.com/ShazMoghaddam/bezel-charts.git
cd bezel-charts/python
python3 -m venv .venv && source .venv/bin/activate
pip install -e ".[test]"
pytest
After changing a JavaScript chart, run npm run fixtures from the repository root and commit python/tests/fixtures.
Licence
MIT. Designed and built by Shaz Moghaddam, London.
1 maintainer

Metadata
1 maintainer
Release files for bezel-charts 0.4.0
For a detailed explanation of source distributions (sdists) and built distributions (wheels), please see the package formats documentation.
Source distribution (sdist)
| File | Size | Uploaded | Provenance | Actions |
|---|---|---|---|---|
| bezel_charts-0.4.0.tar.gz | 125.4 kB | With provenance | Details for bezel_charts-0.4.0.tar.gz |
Built distribution (wheel)
| File | Interpreter | ABI | Platform | Actions Reset |
|---|---|---|---|---|
| bezel_charts-0.4.0-py3-none-any.whl | Python 3 | none | any | Details for bezel_charts-0.4.0-py3-none-any.whl |
Total release size: 164.7 kB
Release files / bezel_charts-0.4.0.tar.gz
| Download URL | bezel_charts-0.4.0.tar.gz |
|---|---|
| Size | 125.4 kB |
| Tags | Source |
|
SHA-256 checksum How to use checksums |
f3f9bd62ca11da3bf078b7d4ca780dad82dbcdf8e9ed15faa308af47b8f595ee
|
|
BLAKE2b-256 checksum How to use checksums |
a602add0ac2d0c2d98c0c884dff4d25b754b690ebfbaa0e7be351092aeb6b173
|
| Upload date | |
|
Uploaded using Trusted Publishing? What is trusted publishing? |
Yes |
| Uploaded via |
twine/7.0.0 CPython/3.13.16
|
Provenance
Provenance describes where a file came from. On PyPI, provenance is shared via attestations, which provide a verifiable record of the build or publishing details. View details, limitations and caveats.


PyPI Publish Attestation
PyPI verified that this artifact, at this checksum, originated from the publisher listed below.
Signed by GitHub Actions, verified by PyPI on Oct 30, 2026.
Transparency logRelease files / bezel_charts-0.4.0-py3-none-any.whl
| Download URL | bezel_charts-0.4.0-py3-none-any.whl |
|---|---|
| Size | 39.3 kB |
| Tags | Python 3 |
|
SHA-256 checksum How to use checksums |
3204ca7b87c72078d3dbb95d3f4dc2d52c4dbd631f707ad72cc347010fe7017c
|
|
BLAKE2b-256 checksum How to use checksums |
2ca818253b963e78f0931057cb407de28f36bfcf961d3486ab8674abbe904af6
|
| Upload date | |
|
Uploaded using Trusted Publishing? What is trusted publishing? |
Yes |
| Uploaded via |
twine/7.0.0 CPython/3.13.16
|
Provenance
Provenance describes where a file came from. On PyPI, provenance is shared via attestations, which provide a verifiable record of the build or publishing details. View details, limitations and caveats.
PyPI Publish Attestation
PyPI verified that this artifact, at this checksum, originated from the publisher listed below.
Signed by GitHub Actions, verified by PyPI on Oct 30, 2026.
Transparency logSecurity for bezel-charts 0.4.0
Provenance
Provenance describes where a file came from. On PyPI, provenance is shared via attestations, which provide a verifiable record of the build or publishing details. View details, limitations and caveats.
Full provenance
All 2 files in this release have been uploaded with provenance metadata.
Attestation for bezel_charts-0.4.0.tar.gz
PyPI Publish Attestation
PyPI verified that this artifact, at this checksum, originated from the publisher listed below.
Signed by GitHub Actions, verified by PyPI on Oct 30, 2026.
Transparency logA note on package security
PyPI is a repository for distributing packages, not a service for auditing them. While third-party security researchers and our staff do their best to detect and remove malicious packages, PyPI cannot guarantee the quality, security or suitability of any given package.
To learn more about protecting yourself from malicious actors, visit our package security documentation.














