A toolkit for analyzing, assessing, and visualizing biosignal quality

Project description
BioSignal Quality Analysis


A comprehensive toolkit for analyzing, visualizing, and evaluating the quality of physiological time series signals such as PPG (photoplethysmography) and ECG (electrocardiography).
Screenshots
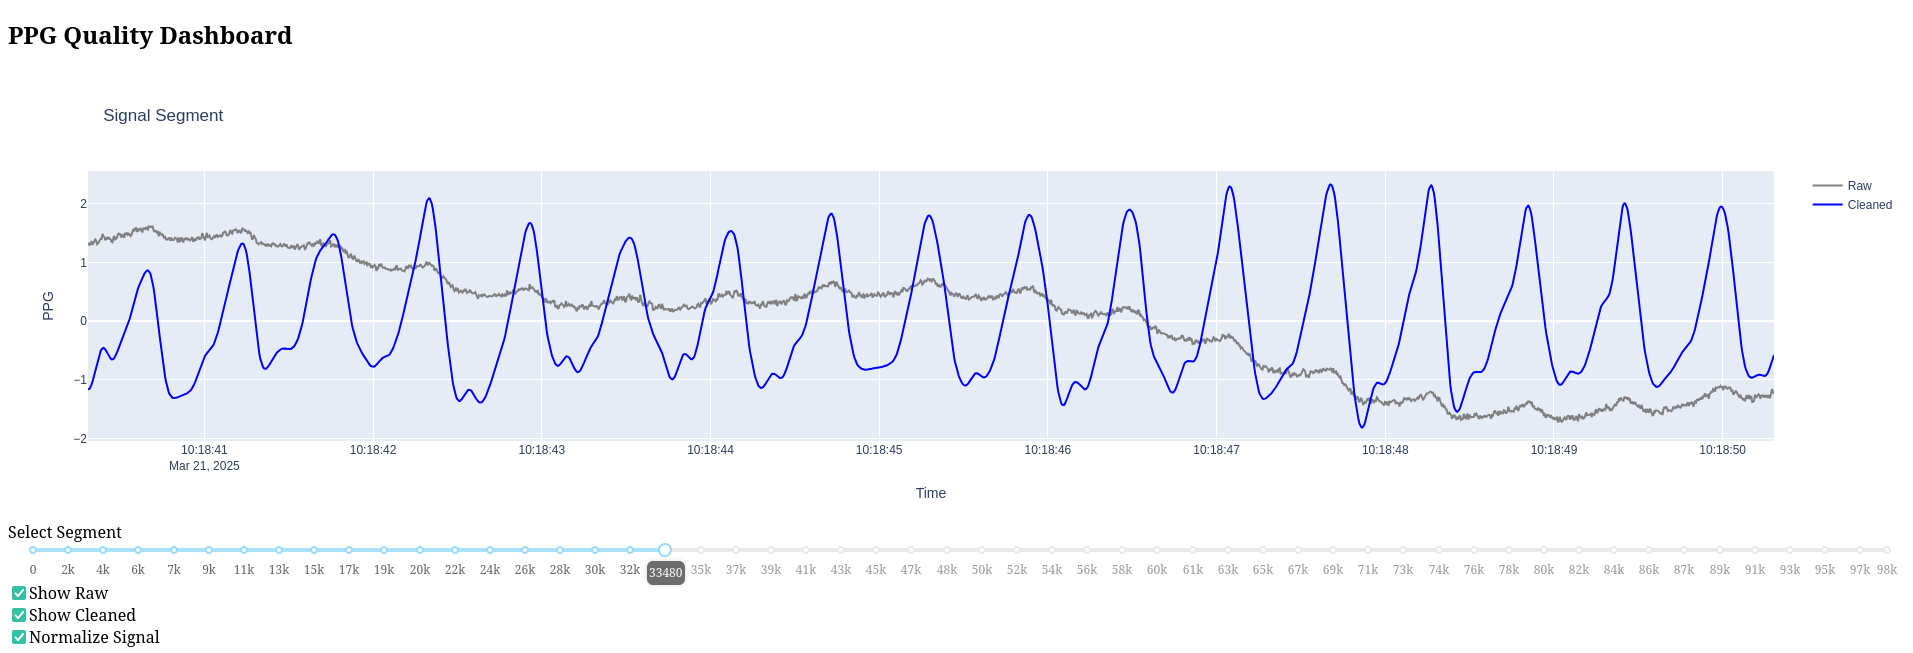
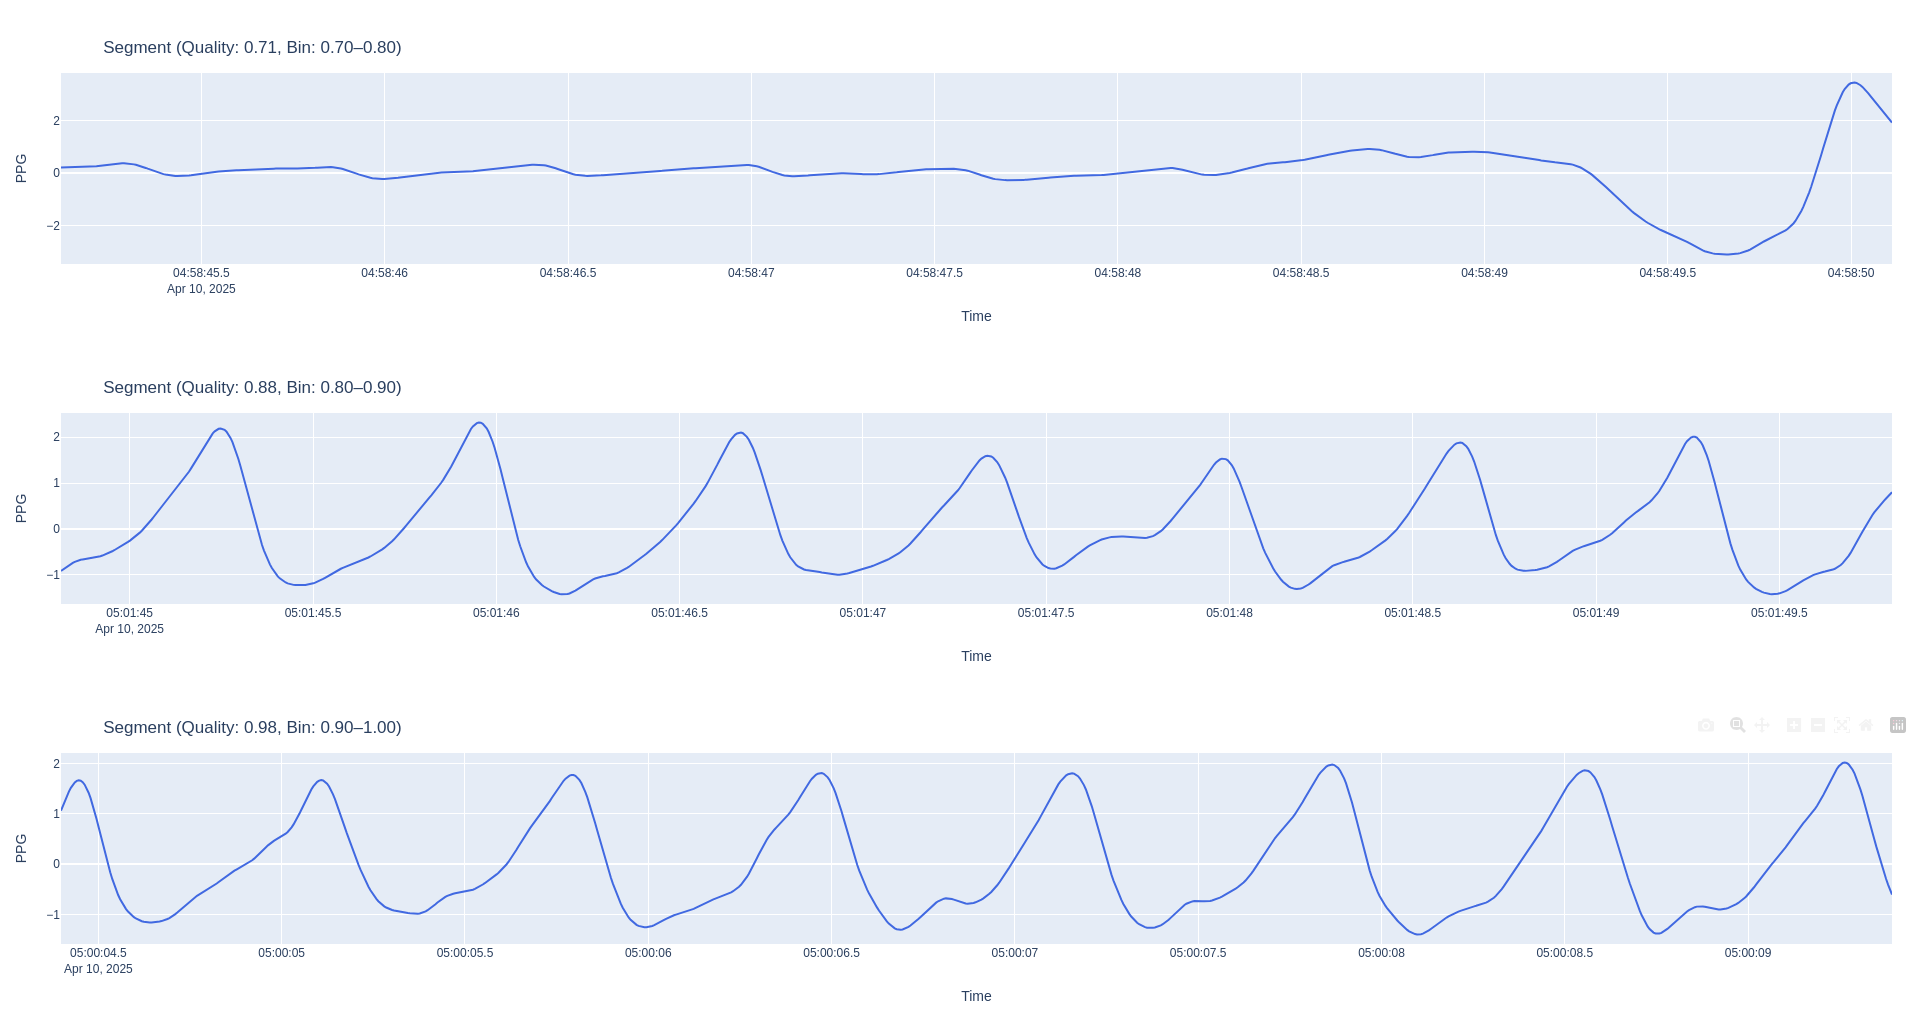
DashBoard
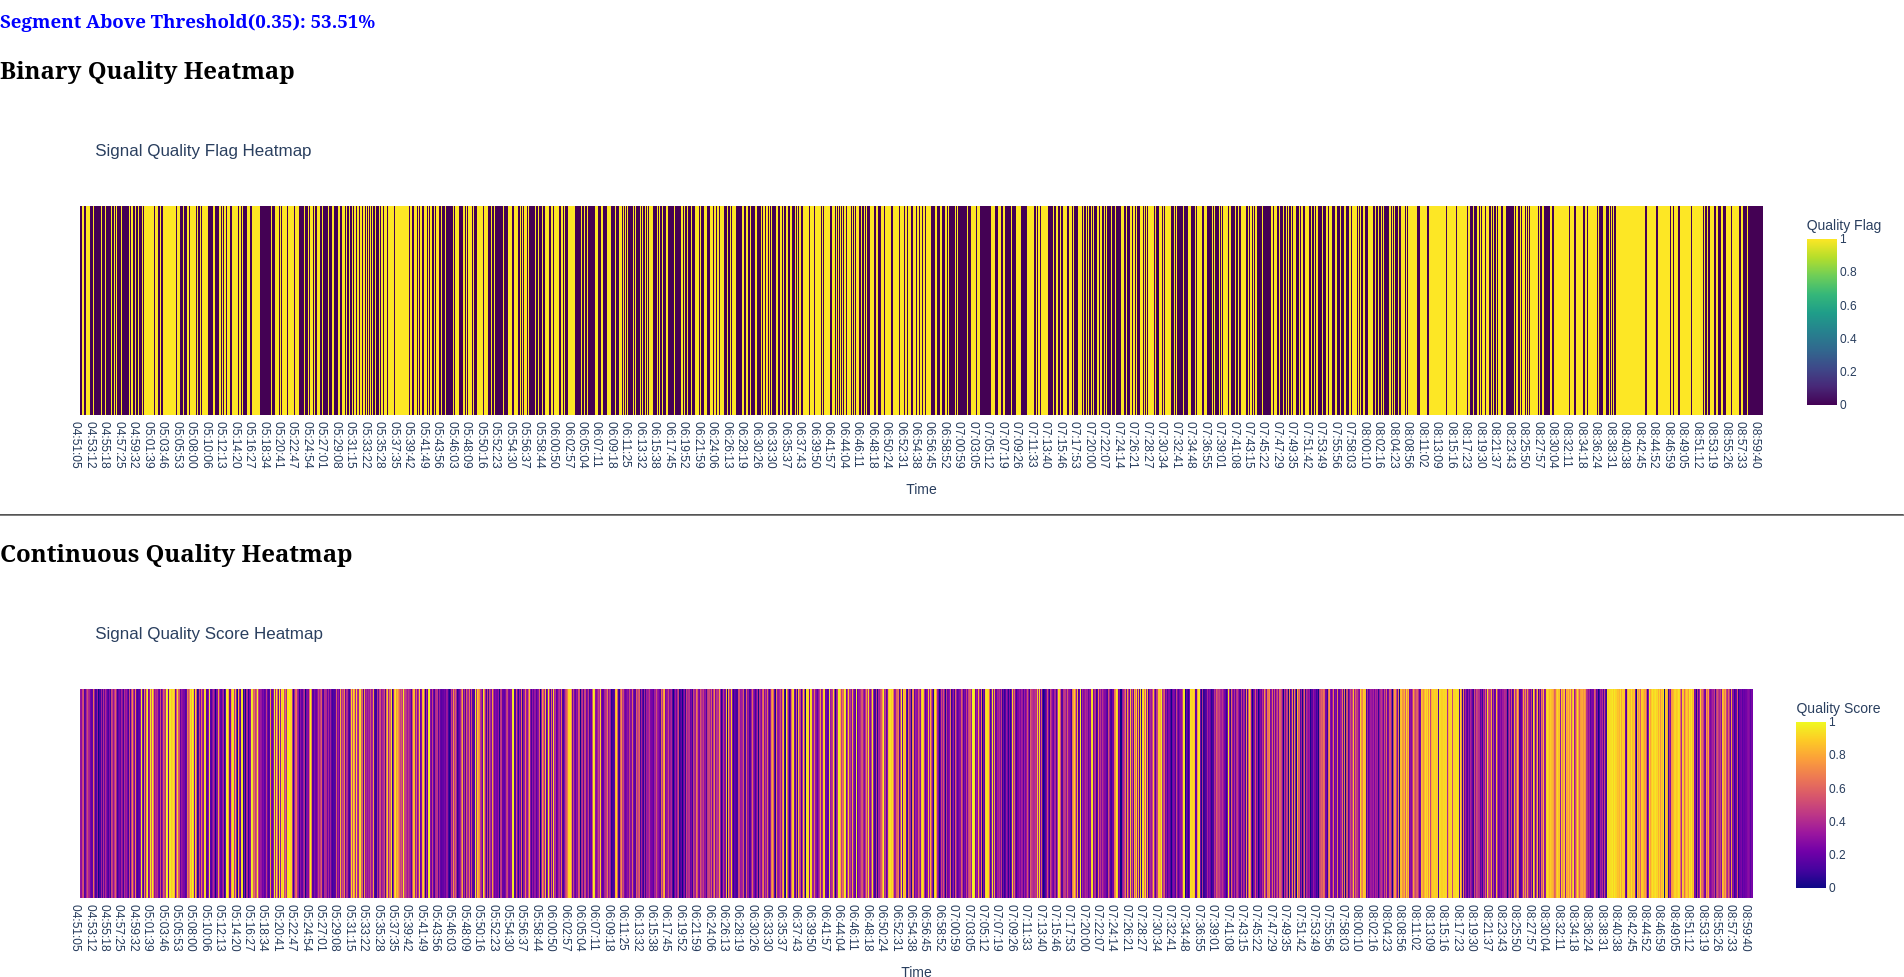
Report
Features
- Quality Assessment: Evaluate quality using cross-correlation with shifted segments
- Interactive Dashboard: Visual exploration of signal segments with real-time quality metrics
- Quality Reporting: Generate comprehensive HTML reports with visualizations
- Segment Processing: Prepare and analyze segments with appropriate padding to avoid edge effects
How It Works
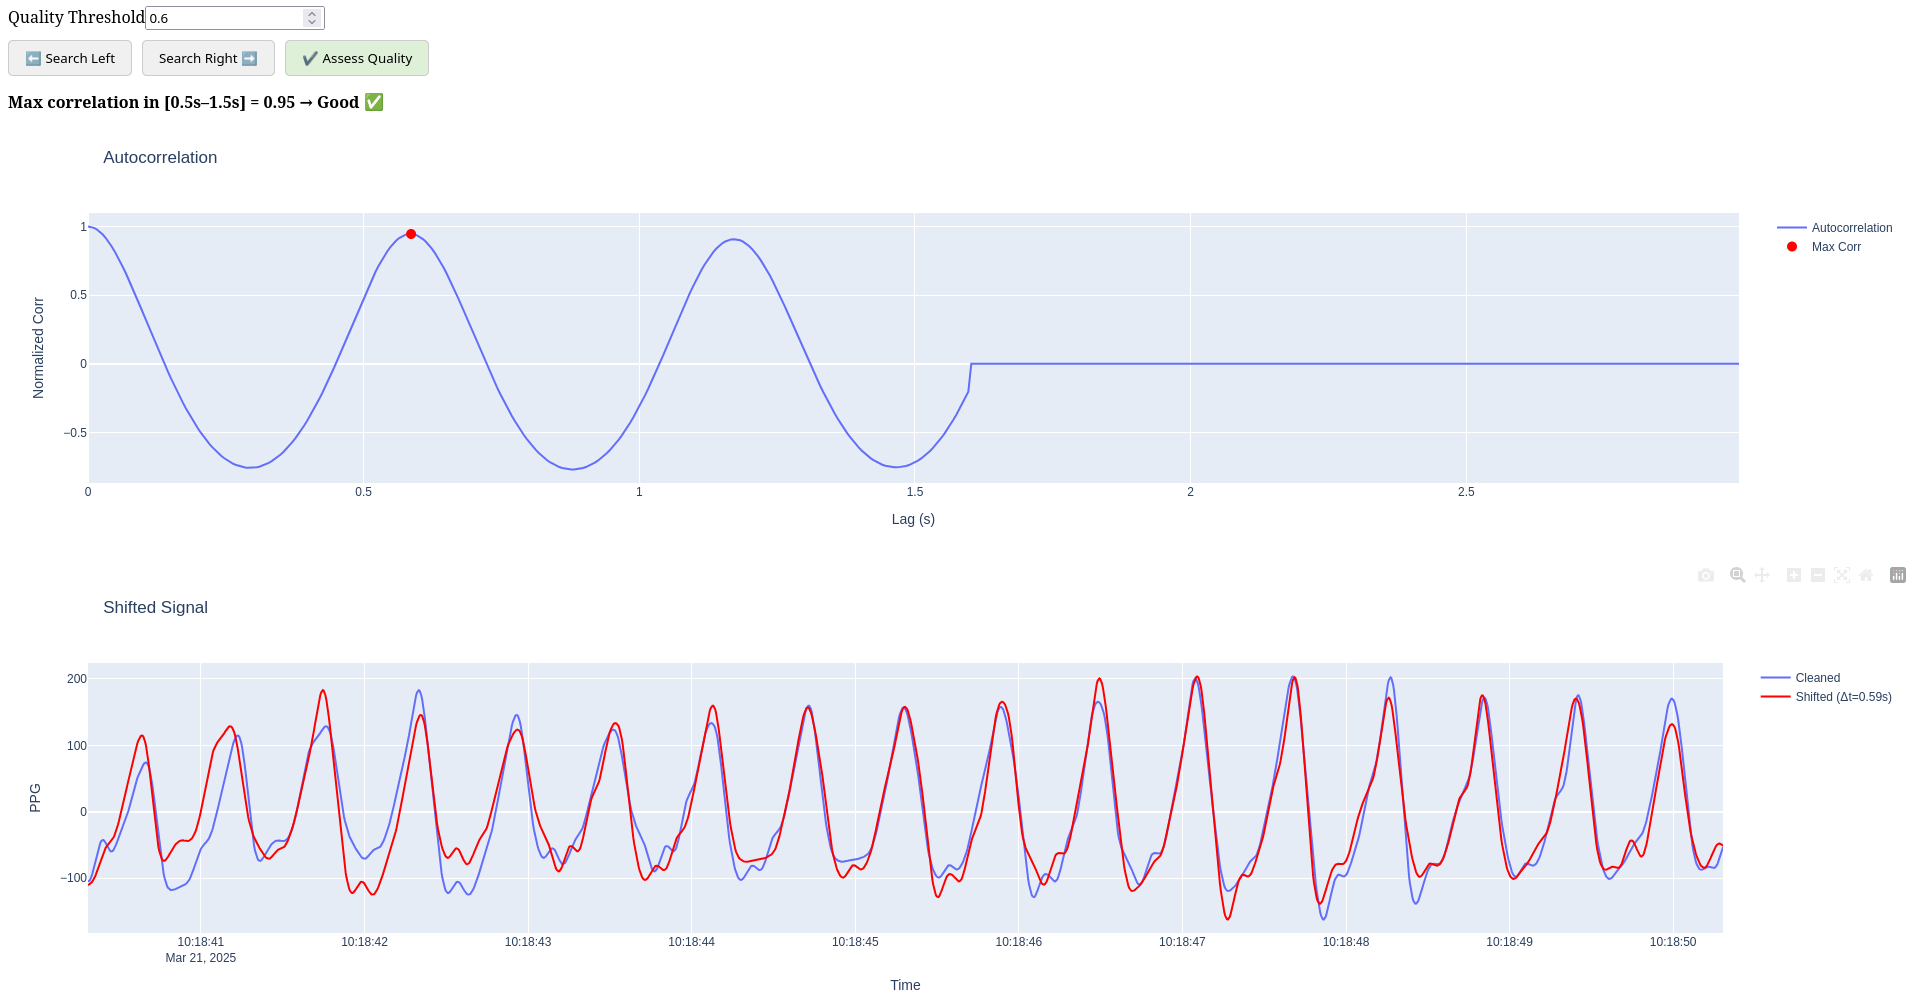
The library assesses signal quality based on the periodicity of waveforms. For physiological signals like PPG and ECG, we expect a repetitive pattern corresponding to heart rate (typically 40-120 BPM or 0.5-1.5 seconds between peaks).
Methodology:
- Segment Processing: Signal is broken into segments of fixed duration
- Cleaning: Signal is cleaned using specialized functions (e.g.,
nk.ppg_clean()for PPG data) - Autocorrelation Analysis: The cleaned signal is correlated with time-shifted versions of itself
- Quality Assessment: Maximum correlation within the expected heart rate range determines quality
- Visual Feedback: Interactive plots or reports show raw vs. cleaned signals and correlation patterns
Installation
pip install biosignal-quality
Core Functions
The library provides three main functions:
1. assess_quality
Analyzes signal segments and returns a DataFrame with timestamps and quality scores.
from biosignal_quality import assess_quality
import pandas as pd
import neurokit2 as nk

# Load your signal data
data = pd.read_csv("your_signal_data.csv")

# Get quality scores for each segment
quality_df = assess_quality(
    df=data,
    signal_col="ppg_signal",
    clean_func=nk.ppg_clean,
    sampling_rate=186,
    step_size_sec=1,
    segment_duration_sec=10
)

# Result includes timestamps and quality scores (0-1)
print(quality_df.head())
2. assess_quality_percentage
Provides an overall quality assessment with optional HTML report generation.
from biosignal_quality import assess_quality_percentage
import neurokit2 as nk

# Get percentage of high-quality segments and generate HTML report
quality_percentage = assess_quality_percentage(
    df=data,
    signal_col="ecg_signal",
    clean_func=nk.ecg_clean,
    sampling_rate=200,
    quality_threshold=0.6,
    plot="ecg_quality_report.html"  # Optional: generate HTML report
)

print(f"Recording quality: {quality_percentage:.1f}% high-quality segments")
3. signal_quality_dashboard
Launches an interactive dashboard for exploring signal quality.
from biosignal_quality import signal_quality_dashboard
import neurokit2 as nk

# Define optional normalization function
def zscore_normalize(signal):
    import numpy as np
    return (signal - np.mean(signal)) / np.std(signal)

# Launch interactive dashboard
signal_quality_dashboard(
    df=data,
    signal_col="ppg_signal",
    clean_func=nk.ppg_clean,
    normalize_func=zscore_normalize,
    signal_label="PPG",
    sampling_rate=186
)
Parameter Reference
| Parameter | Description | Default |
|---|---|---|
df |
DataFrame containing the signal with a 'time' column | - |
signal_col |
Column name containing the signal | - |
clean_func |
Function to clean the signal (e.g., nk.ppg_clean) | - |
signal_label |
Label for the signal in visualizations | "Signal" |
normalize_func |
Optional function to normalize signals | None |
sampling_rate |
Sampling rate in Hz | 186 |
segment_duration_sec |
Duration of segment in seconds | 10 |
step_size_sec |
Step size between segments for assessment | 1 |
quality_lag_low |
Lower bound for quality assessment lag (seconds) | 0.5 |
quality_lag_high |
Upper bound for quality assessment lag (seconds) | 1.5 |
quality_threshold |
Threshold for determining high-quality segments | 0.6 |
max_lag_sec |
Maximum lag in seconds for autocorrelation | 3 |
clean_padding_ratio |
Ratio of padding to add before cleaning | 0.2 |
delta_padding_sec |
Additional padding in seconds for extended segment | 1.6 |
plot |
Path to save HTML report (for assess_quality_percentage) | None |
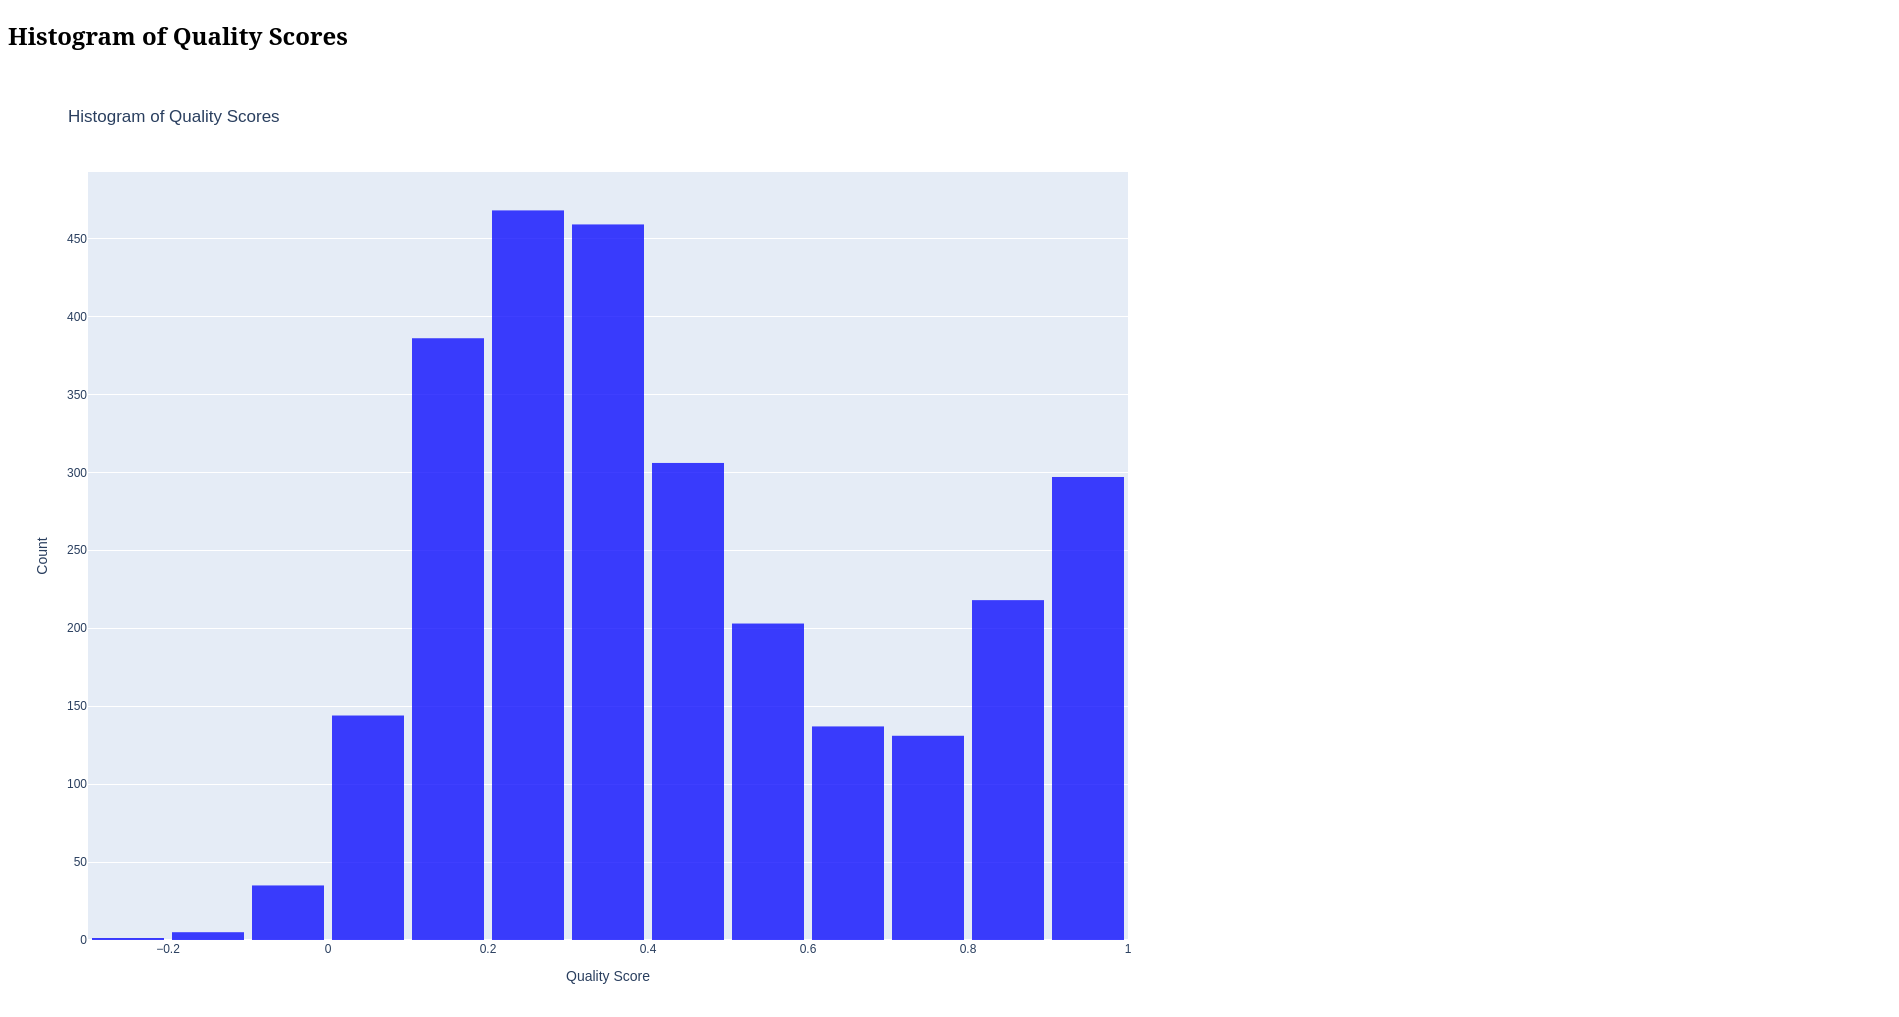
bin_size |
Bin size for quality score histogram in report | 0.1 |
num_plots_bin |
Number of example segments to plot per quality bin | 1 |
launch_dashboard |
Whether to launch interactive dashboard | False |
verbose |
Whether to print progress information | False |
Example: Complete Analysis Workflow
import pandas as pd
import numpy as np
import neurokit2 as nk
from biosignal_quality import assess_quality, assess_quality_percentage, signal_quality_dashboard

# Load data
data = pd.read_csv("ppg_recording.csv")

# Define normalization function
def zscore_normalize(signal):
    return (signal - np.mean(signal)) / np.std(signal)

# Step 1: Get quick overall quality assessment with report
quality_pct = assess_quality_percentage(
    df=data,
    signal_col="ppg",
    clean_func=nk.ppg_clean,
    sampling_rate=186,
    quality_threshold=0.6,
    plot="quality_report.html",
    signal_label="PPG"
)
print(f"Overall signal quality: {quality_pct:.1f}%")

# Step 2: Get detailed quality scores for each segment
quality_df = assess_quality(
    df=data,
    signal_col="ppg",
    clean_func=nk.ppg_clean,
    sampling_rate=186,
    step_size_sec=1
)

# Step 3: Find segments with best and worst quality
best_segments = quality_df.nlargest(5, 'quality_score')
worst_segments = quality_df.nsmallest(5, 'quality_score')

# Step 4: Launch interactive dashboard to explore specific segments
signal_quality_dashboard(
    df=data,
    signal_col="ppg",
    clean_func=nk.ppg_clean,
    normalize_func=zscore_normalize,
    sampling_rate=186,
    signal_label="PPG"
)
HTML Report Contents
When generating a quality report using assess_quality_percentage() with the plot parameter, the HTML report includes:
- Summary Statistics: Overall quality percentage and distribution
- Quality Timeline: Heatmap showing quality scores over time
- Quality Histogram: Distribution of quality scores
- Example Segments: Representative segments for different quality levels
- Autocorrelation Plots: Correlation patterns for selected segments
Dashboard Controls
The interactive dashboard provided by signal_quality_dashboard() includes:
- Segment Navigation: Navigate through signal segments
- Raw/Cleaned Signal Toggle: Compare raw and processed signals
- Normalization Option: Apply normalization to the displayed signals
- Quality Threshold Adjustment: Set the correlation threshold for "good" quality
- Quality Search: Find segments meeting the quality threshold criteria
- Auto-correlation Analysis: Visualize signal periodicity at different lags
License
MIT License
Release history Release notifications | RSS feed


Download files
Download the file for your platform. If you're not sure which to choose, learn more about installing packages.
Source Distribution
Built Distribution
Filter files by name, interpreter, ABI, and platform.
If you're not sure about the file name format, learn more about wheel file names.
Copy a direct link to the current filters
File details
Details for the file biosignal_quality-0.1.0.tar.gz.
File metadata
- Download URL: biosignal_quality-0.1.0.tar.gz
- Upload date:
- Size: 12.3 kB
- Tags: Source
- Uploaded using Trusted Publishing? No
- Uploaded via: twine/6.1.0 CPython/3.10.15
File hashes
| Algorithm | Hash digest | |
|---|---|---|
| SHA256 |
f72618680f53db8284e62807eb47e04a48028fb1c53701f3264dbc435205b259
|
|
| MD5 |
609ab27968eb272022b120bd6660e155
|
|
| BLAKE2b-256 |
33ee546b7caa16d5afca82709b0b3e8a290646e529086e0eabc570ae9aea44fc
|
File details
Details for the file biosignal_quality-0.1.0-py3-none-any.whl.
File metadata
- Download URL: biosignal_quality-0.1.0-py3-none-any.whl
- Upload date:
- Size: 10.4 kB
- Tags: Python 3
- Uploaded using Trusted Publishing? No
- Uploaded via: twine/6.1.0 CPython/3.10.15
File hashes
| Algorithm | Hash digest | |
|---|---|---|
| SHA256 |
e5bf7369c62a6755301f53c7276c814135be3403de64e328ed35f43281c2ca2b
|
|
| MD5 |
7156f3de8dbec156f995231d38a0fb86
|
|
| BLAKE2b-256 |
1078728e50e1c50173e2a24c71d3db3d588dadfba4c6c3b380c7b230e6c816f3
|


