A small library to plot Bismark methylation_exctractor reports.

Project description
BismarkPlot
A small library to plot Bismark methylation_extractor reports.
See the docs: https://shitohana.github.io/BismarkPlot
Right now only coverage2cytosine input is supported, but support for bismark2bedGraph will be added soon.
Installation
pip install bismarkplot
Example
First we need to initialize genome and BismarkFiles. genome is .gff or .bed file with gene coordinates. BismarkFiles is a class, which calculates data for all plots, so their types need to be specified when it is initialized.
import bismarkplot

file = 'path/to/genome.gff'

genome = bismarkplot.read_genome(
    file,
    flank_length=2000,
    min_length=4000
)

files = ['path/to/genomeWide1.txt', 'path/to/genomeWide2.txt']
bismark = bismarkplot.BismarkFiles(
    files, genome,
    flank_windows=500,
    gene_windows=2000,
    line_plot=True,
    heat_map=True,
    box_plot=True,
    bar_plot=True
)
Let's now draw plots themselves.
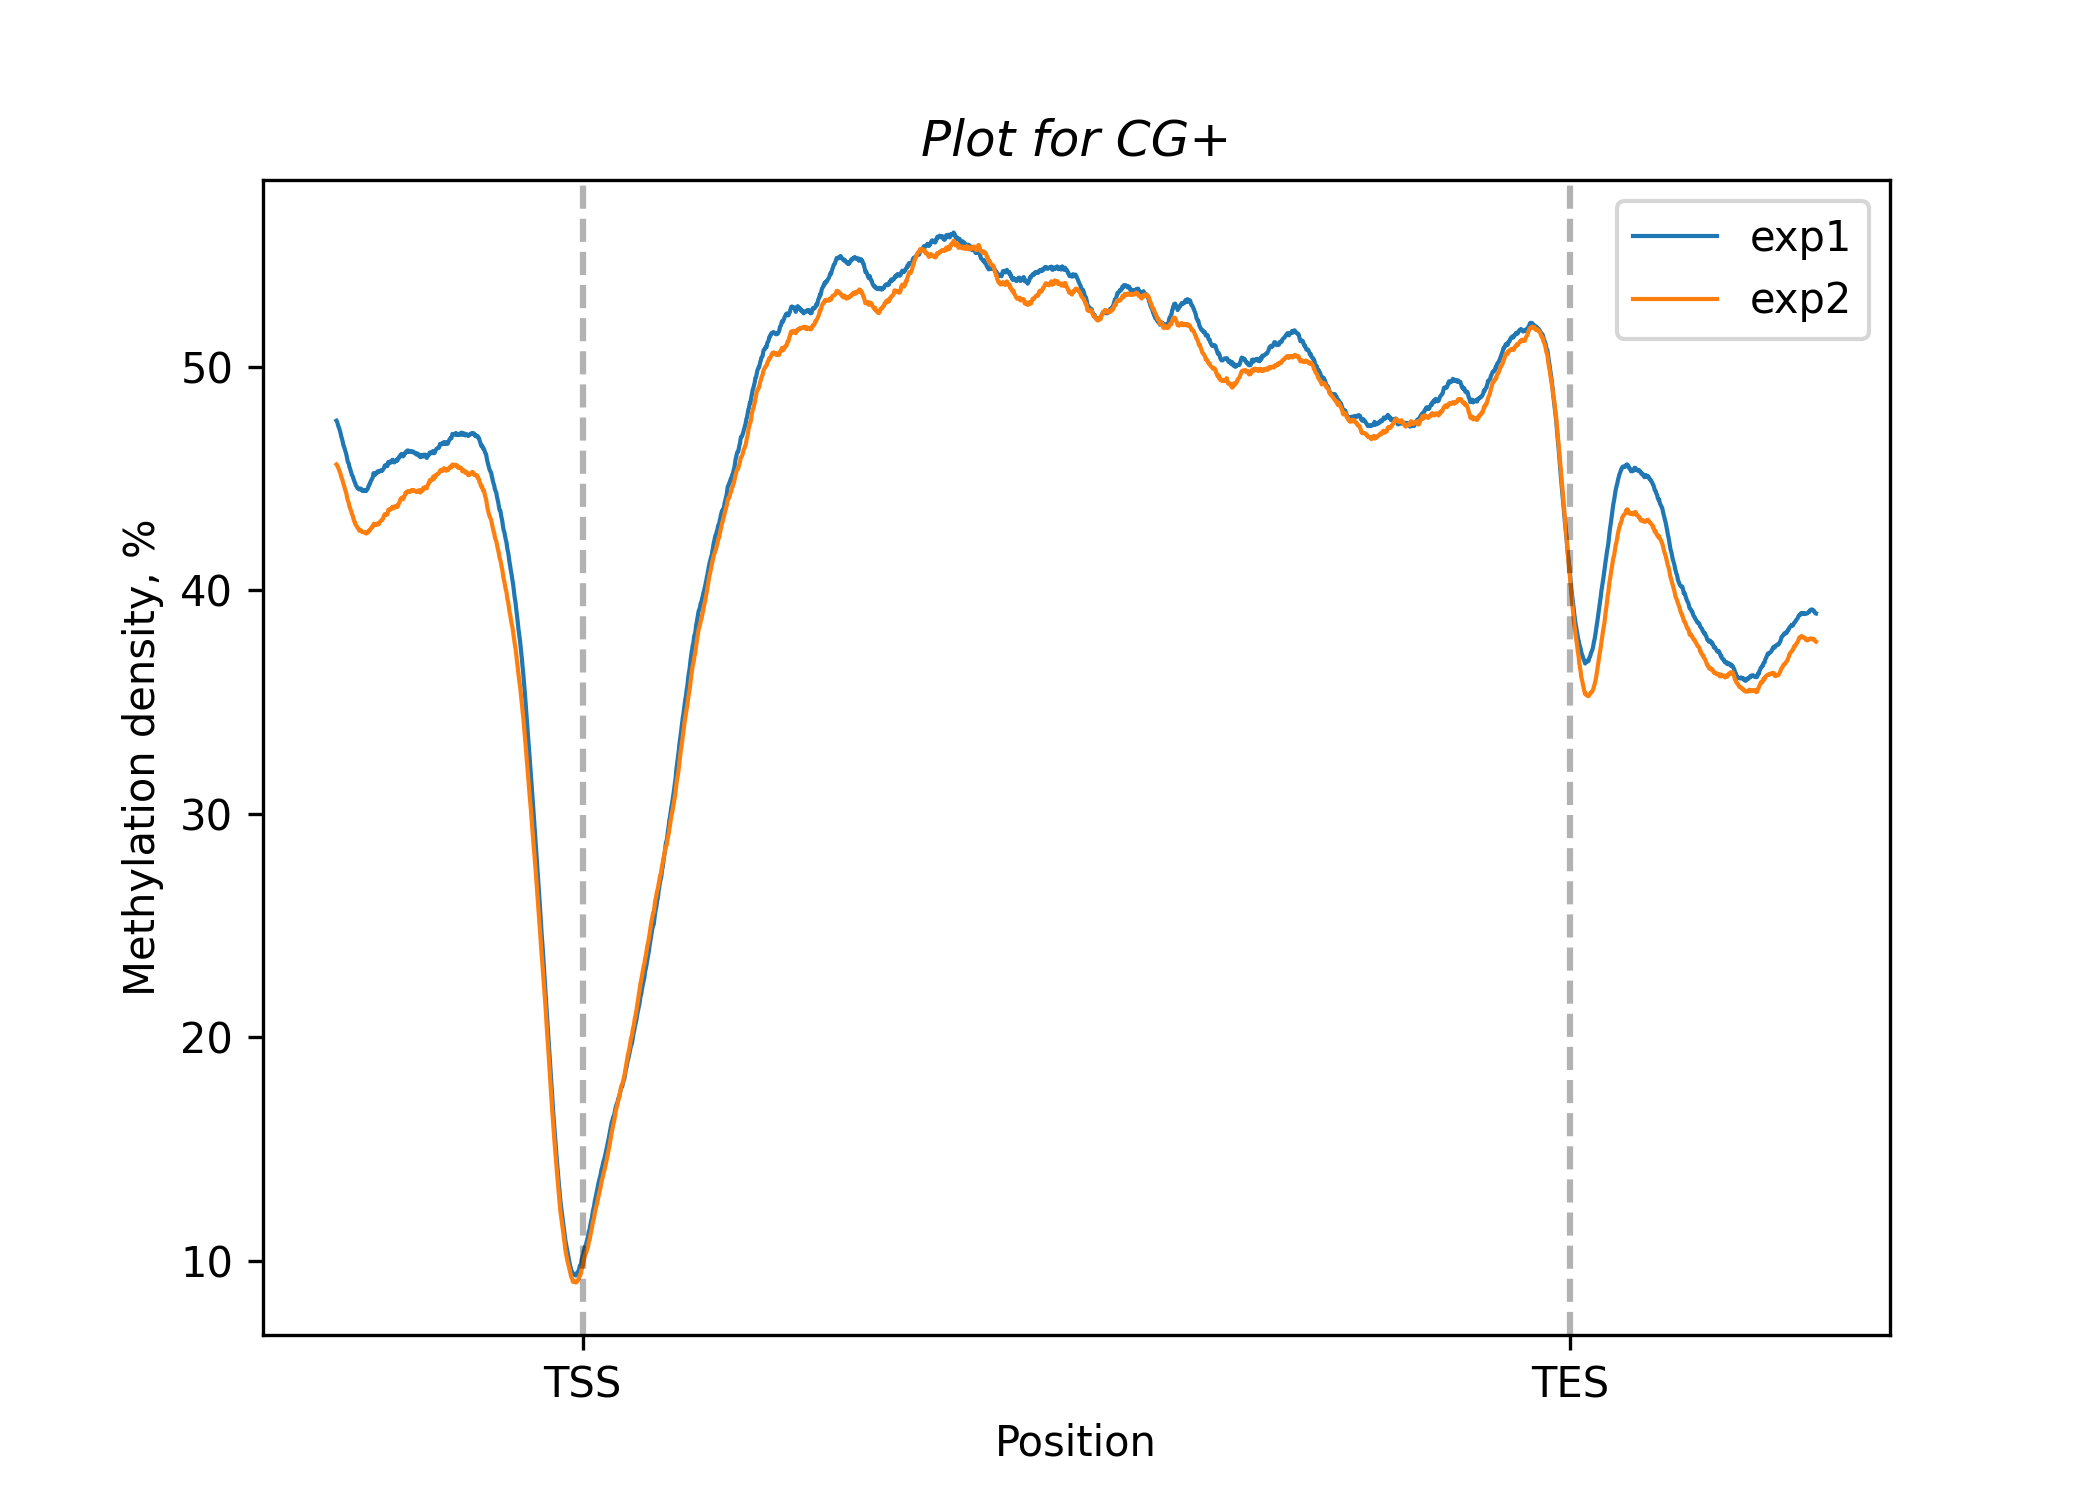
For line plots use (or draw_line_plots_all for all contexts)
bismark.draw_line_plots_filtered(
    context='CG',
    strand='+',
    smooth=.05,
    labels = ['exp1', 'exp2'],
    title = 'Plot for CG+'
)
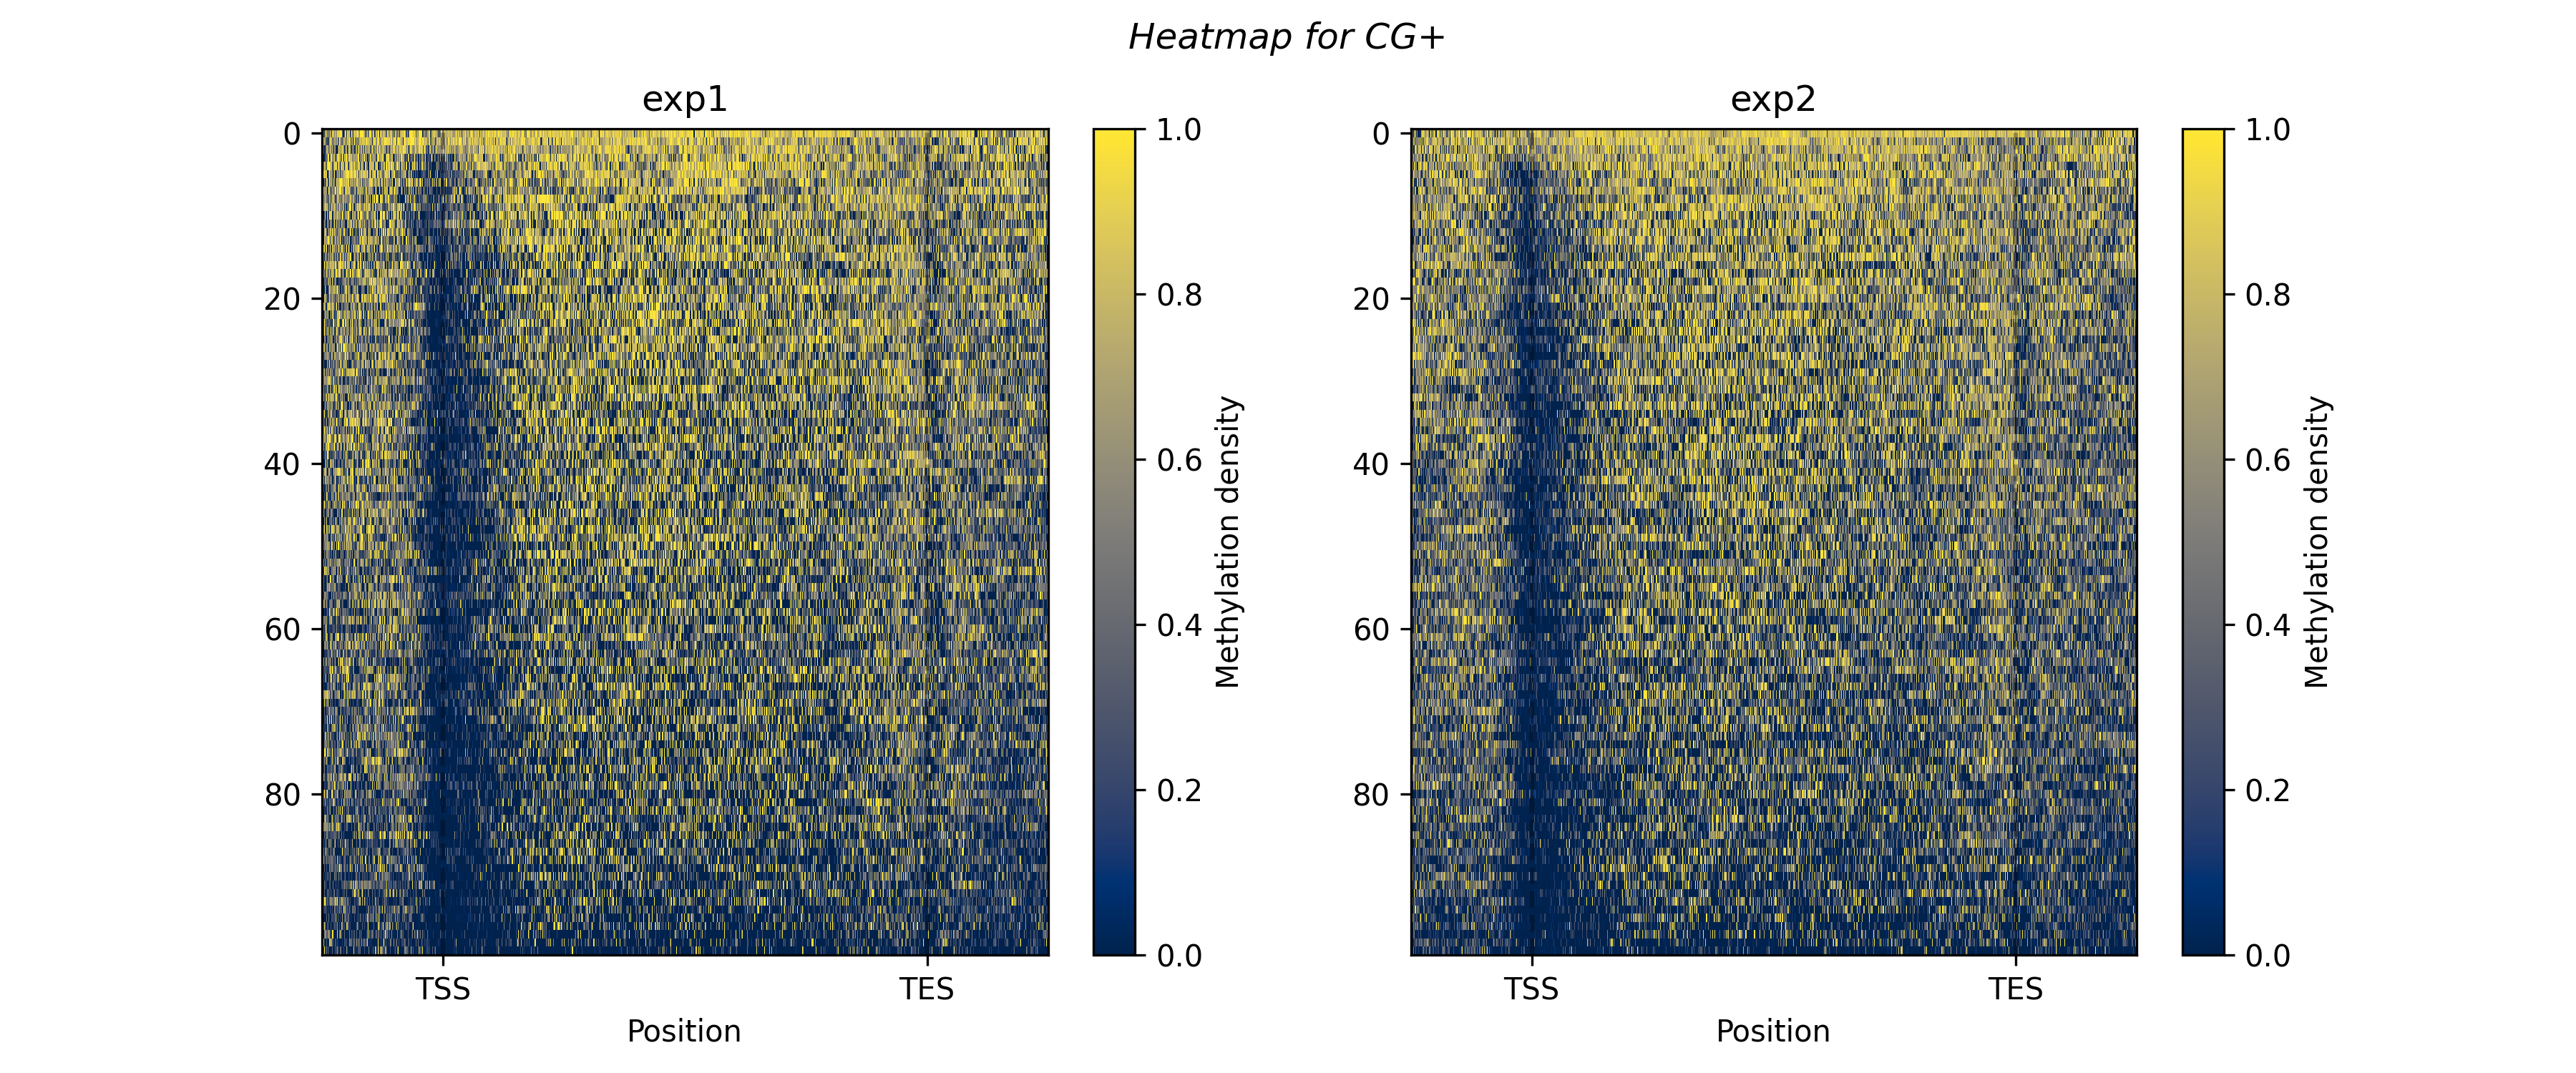
For heat maps use (or draw_heat_maps_all for all contexts)
bismark.draw_heat_maps_filtered(
    context='CG',
    strand='+',
    resolution=100,
    labels = ['exp1', 'exp2'],
    title = 'Heatmap for CG+'
)
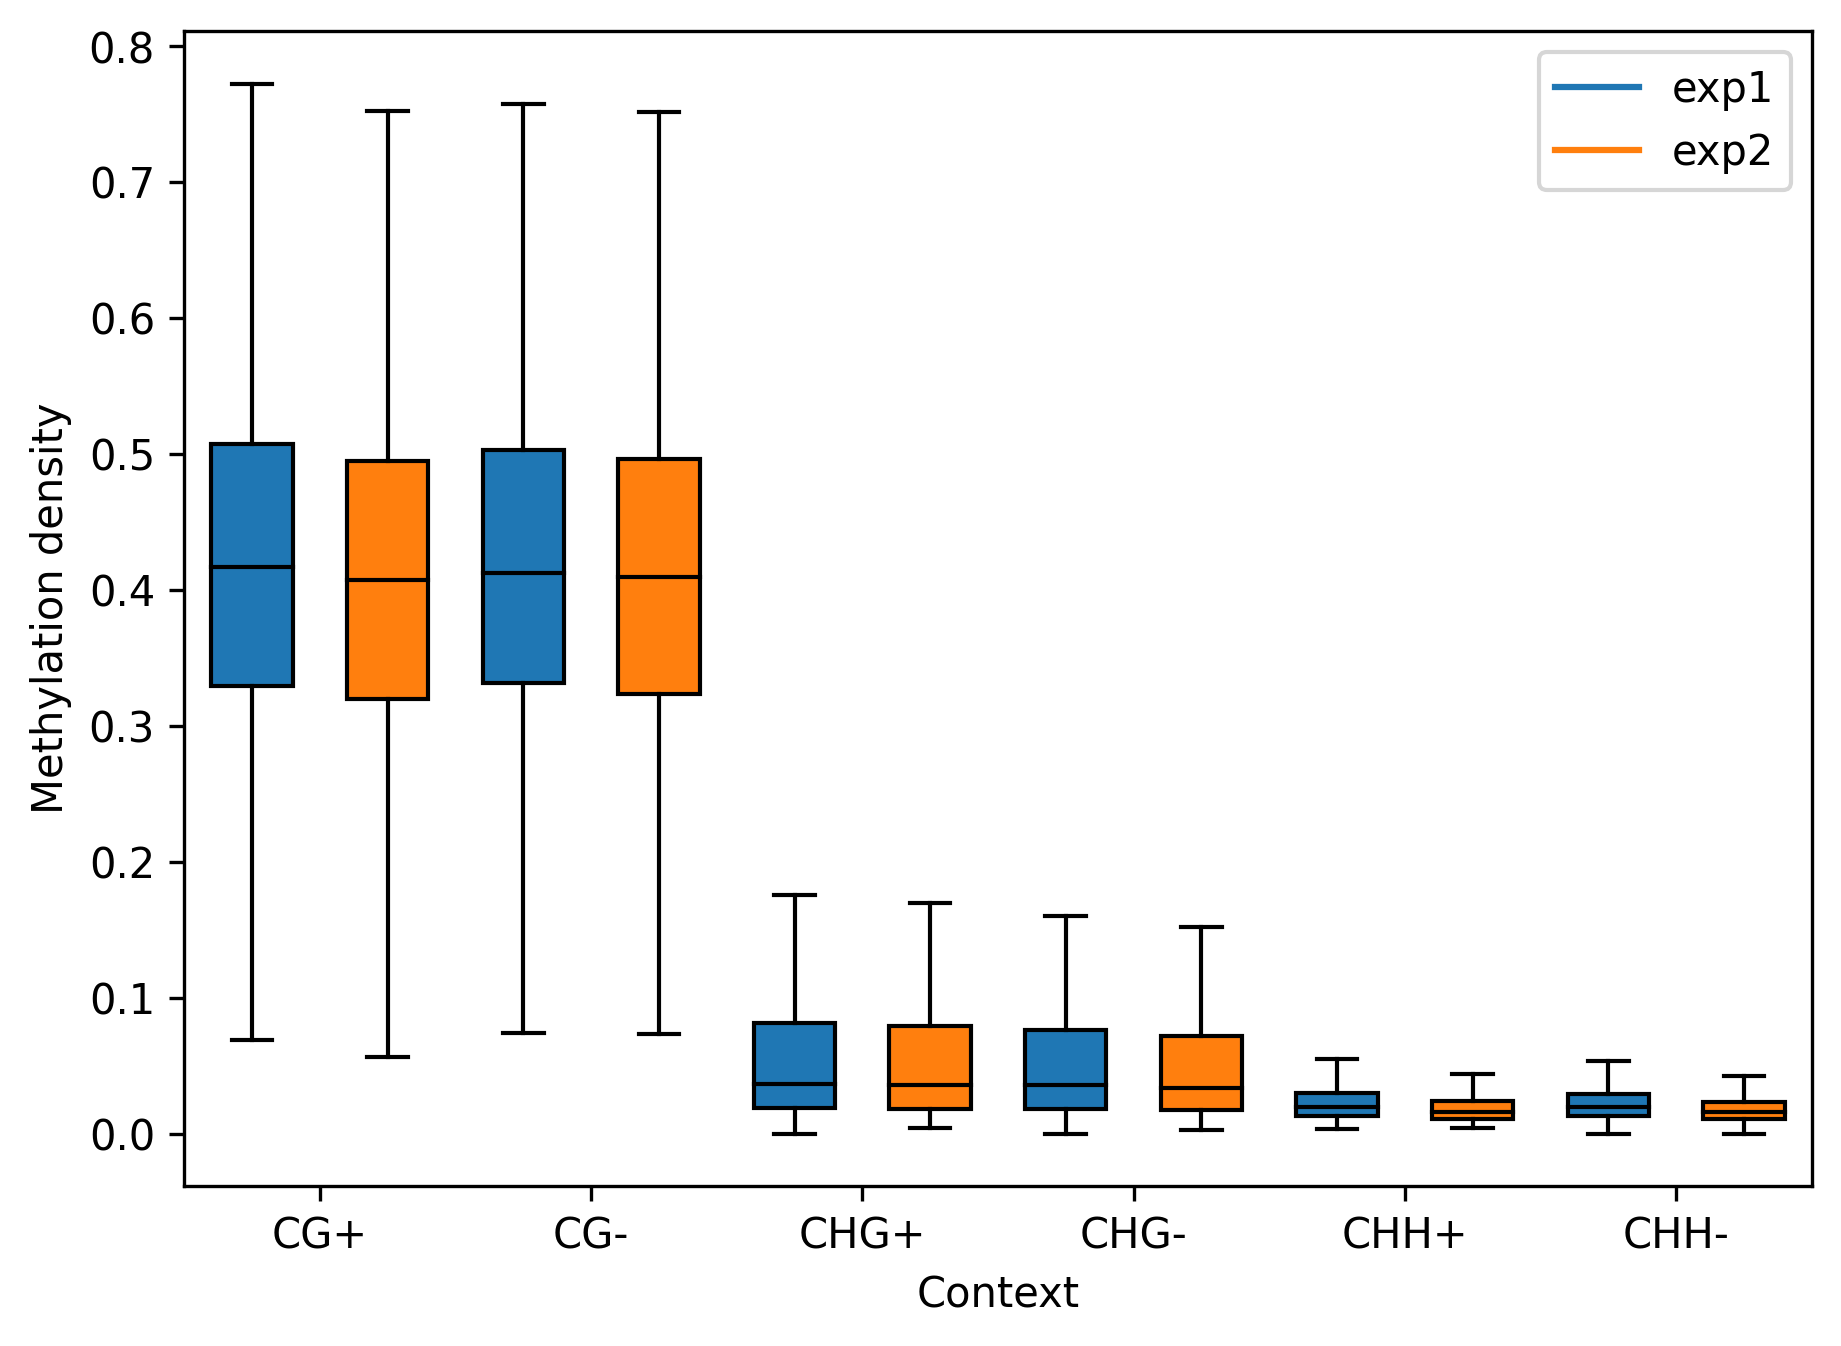
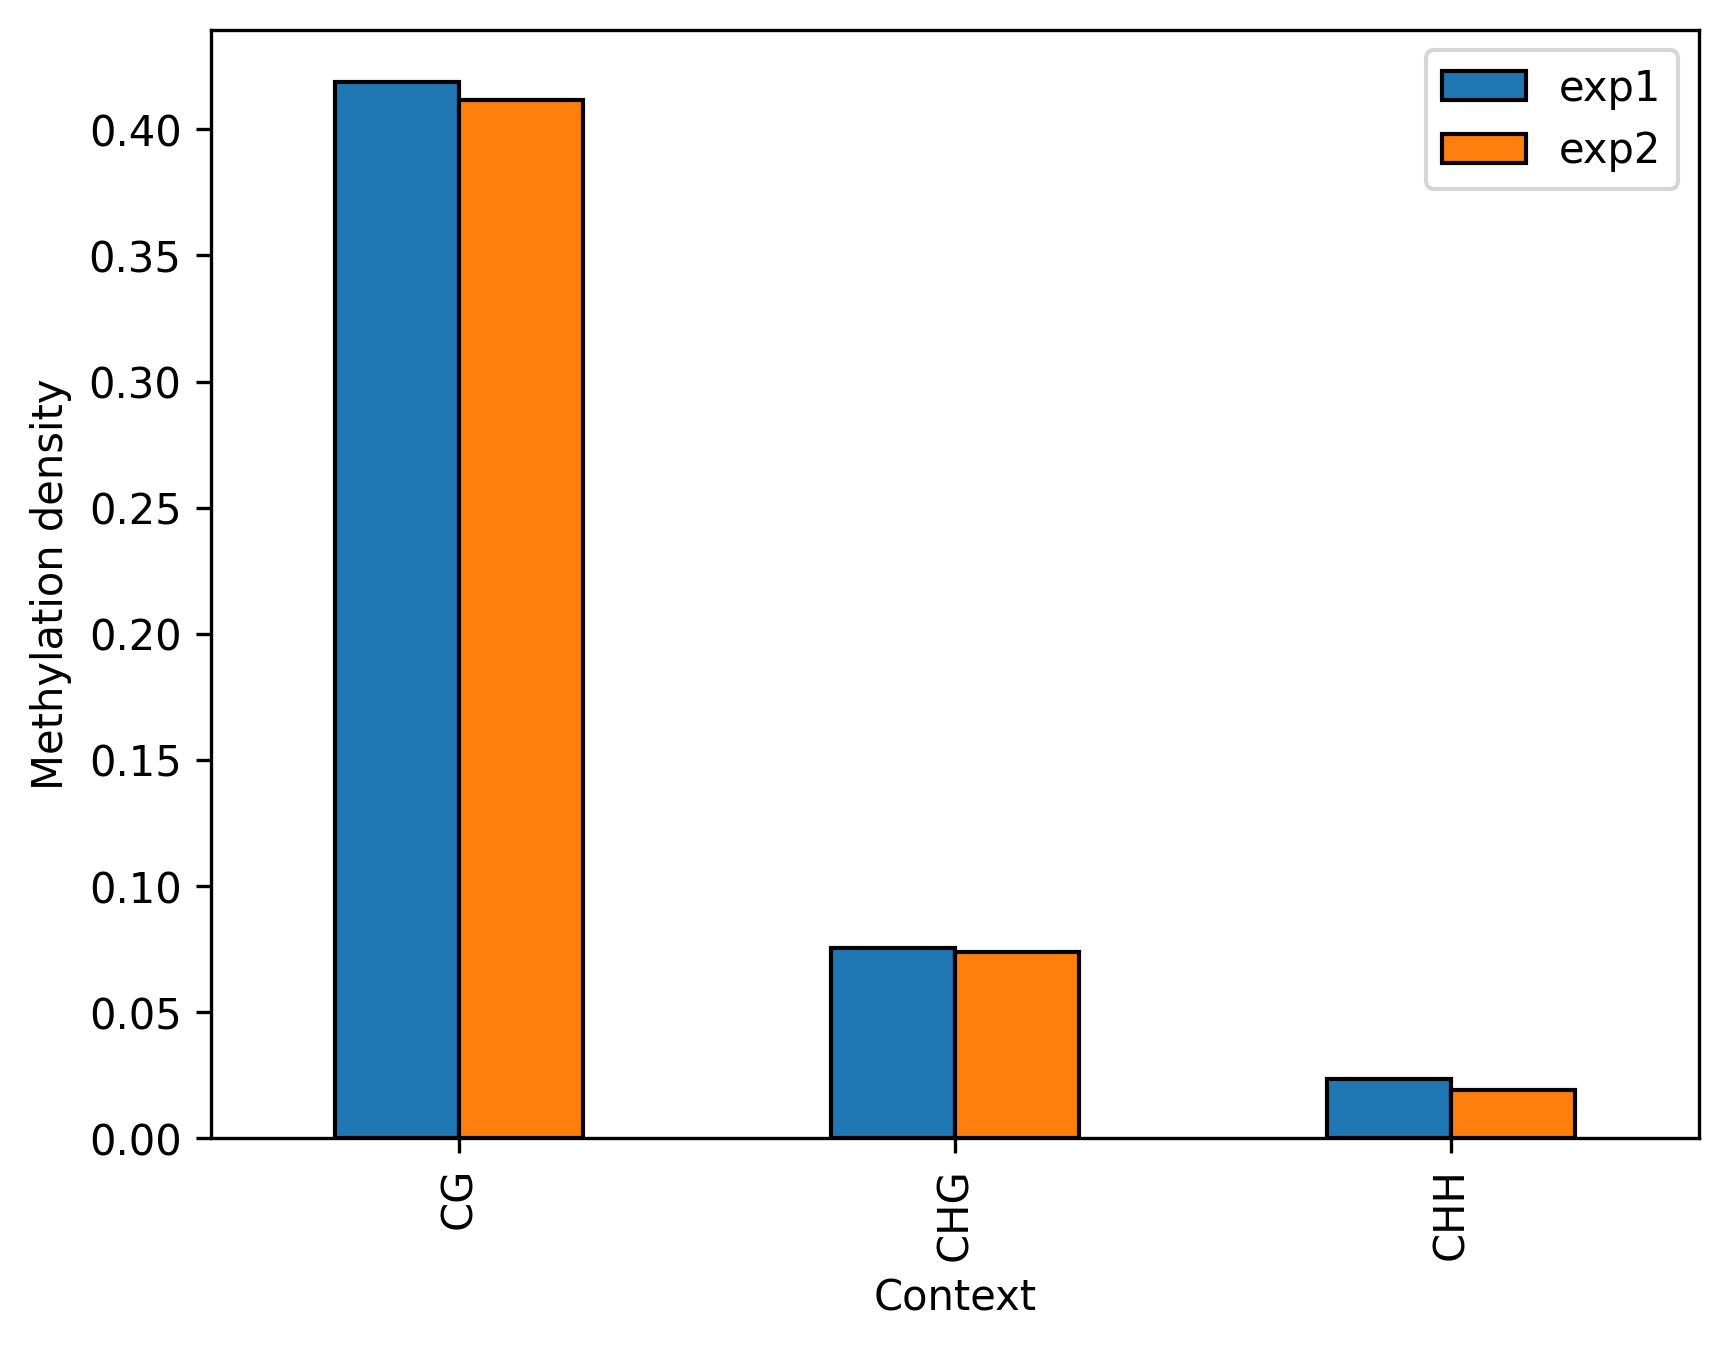
For box plot or bar plot use
bismark.draw_box_plot(strand_specific=True, labels=['exp1', 'exp2'])
bismark.draw_bar_plot(labels=['exp1', 'exp2'])
Release history Release notifications | RSS feed


Download files
Download the file for your platform. If you're not sure which to choose, learn more about installing packages.
Source Distribution
Built Distribution
Filter files by name, interpreter, ABI, and platform.
If you're not sure about the file name format, learn more about wheel file names.
Copy a direct link to the current filters
File details
Details for the file bismarkplot-1.0.1.tar.gz.
File metadata
- Download URL: bismarkplot-1.0.1.tar.gz
- Upload date:
- Size: 40.9 kB
- Tags: Source
- Uploaded using Trusted Publishing? No
- Uploaded via: twine/4.0.1 CPython/3.11.4
File hashes
| Algorithm | Hash digest | |
|---|---|---|
| SHA256 |
31a39bb0f5ff72f1089535c6de48faa28857a5b9abdc3bca57b6cb2c544fcd89
|
|
| MD5 |
941505e387d9324214e227e036793a58
|
|
| BLAKE2b-256 |
3065f10ee3a85f2df85ad9e5fded32246eb45b6109fde4afd4be9b99949caa23
|
File details
Details for the file bismarkplot-1.0.1-py3-none-any.whl.
File metadata
- Download URL: bismarkplot-1.0.1-py3-none-any.whl
- Upload date:
- Size: 39.4 kB
- Tags: Python 3
- Uploaded using Trusted Publishing? No
- Uploaded via: twine/4.0.1 CPython/3.11.4
File hashes
| Algorithm | Hash digest | |
|---|---|---|
| SHA256 |
6d8eaaa96db7ee1ff08f39cf1ea3e701a4ef8fb338b668d59e8da877e55f062e
|
|
| MD5 |
3e82d1f4a76f1161e709b1172be5afe9
|
|
| BLAKE2b-256 |
4fbf63f30140065fcedd21e1eef90bc916672c39b348b808ceb6a5b5acd43e56
|


