Python plotting library for Blender

Project description
blendfig
Overview
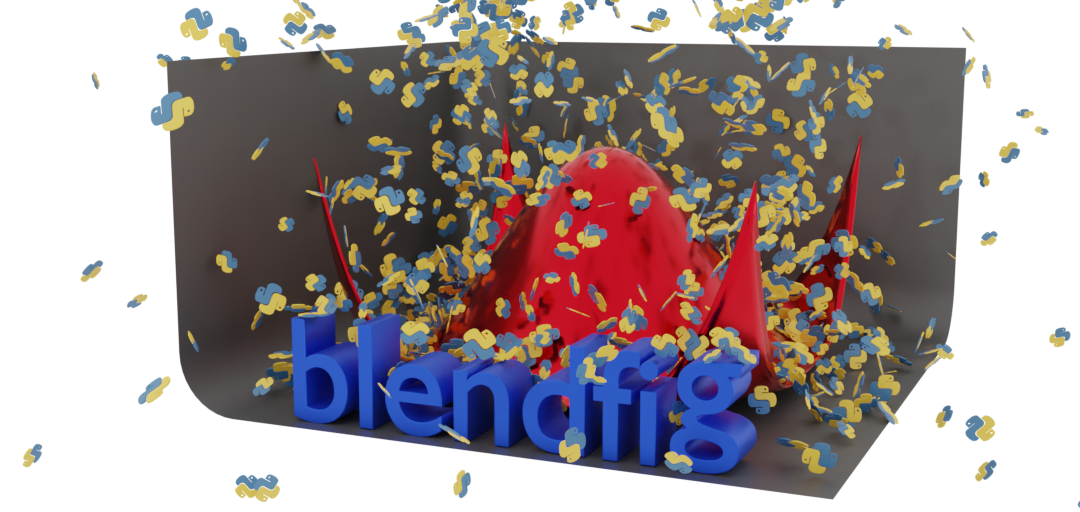
blendfig is a Python module to be used with the 3D modeling software Blender. With blendfig you can create plots in Blender similarly to the usual Python plotting libraries such as plotly and matplotlib. You can then use Blender's powerful shading, modeling etc. features to create beautiful plots and animations.
Installation
<python> -m pip install blendfig
Blender comes with its own Python installation so make sure <python> is Blender's Python binary. On Windows it is located at C:\Program Files\Blender Foundation\Blender <version>\<version>\python\bin\python.exe by default. You may need to run as administrator to install globally.
Usage
Syntax is similar to that of plotly.
import blendfig as bf
import numpy as np
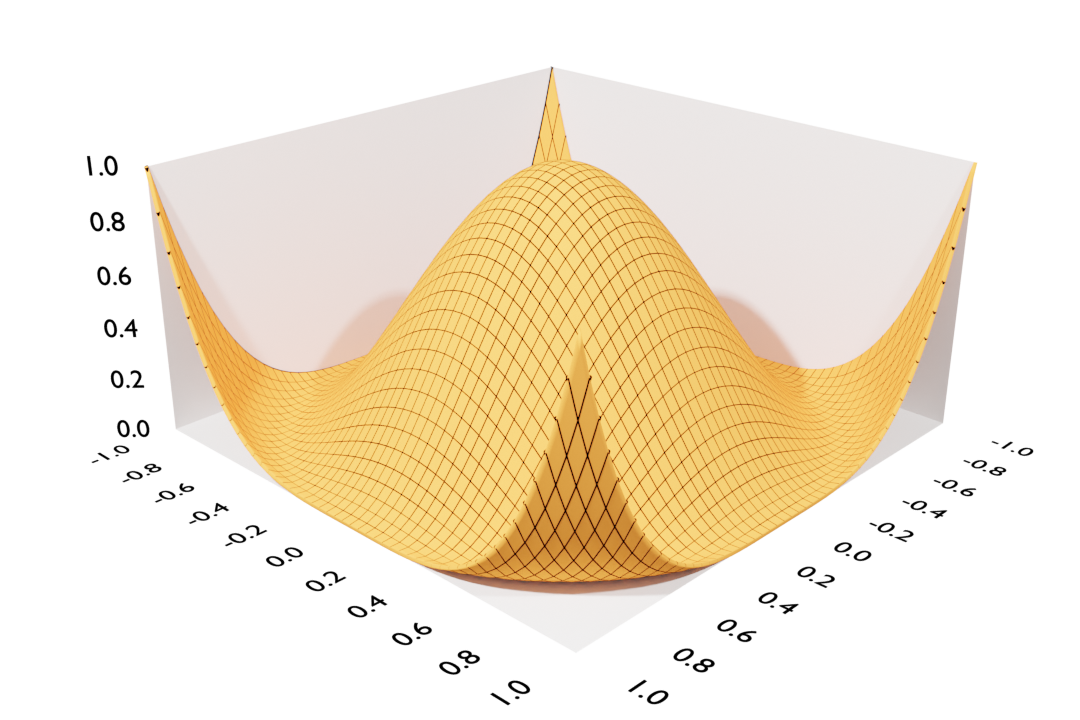
x, y = np.mgrid[-1:1:51j, -1:1:51j]
z =(x**2+y**2-1)**2
fig = bf.Figure()
fig.add_trace(bf.Surface(x=x, y=y, z=z))
fig.create()
| Output | After some simple Blendering |
|---|---|
 |
 |
Curve plots
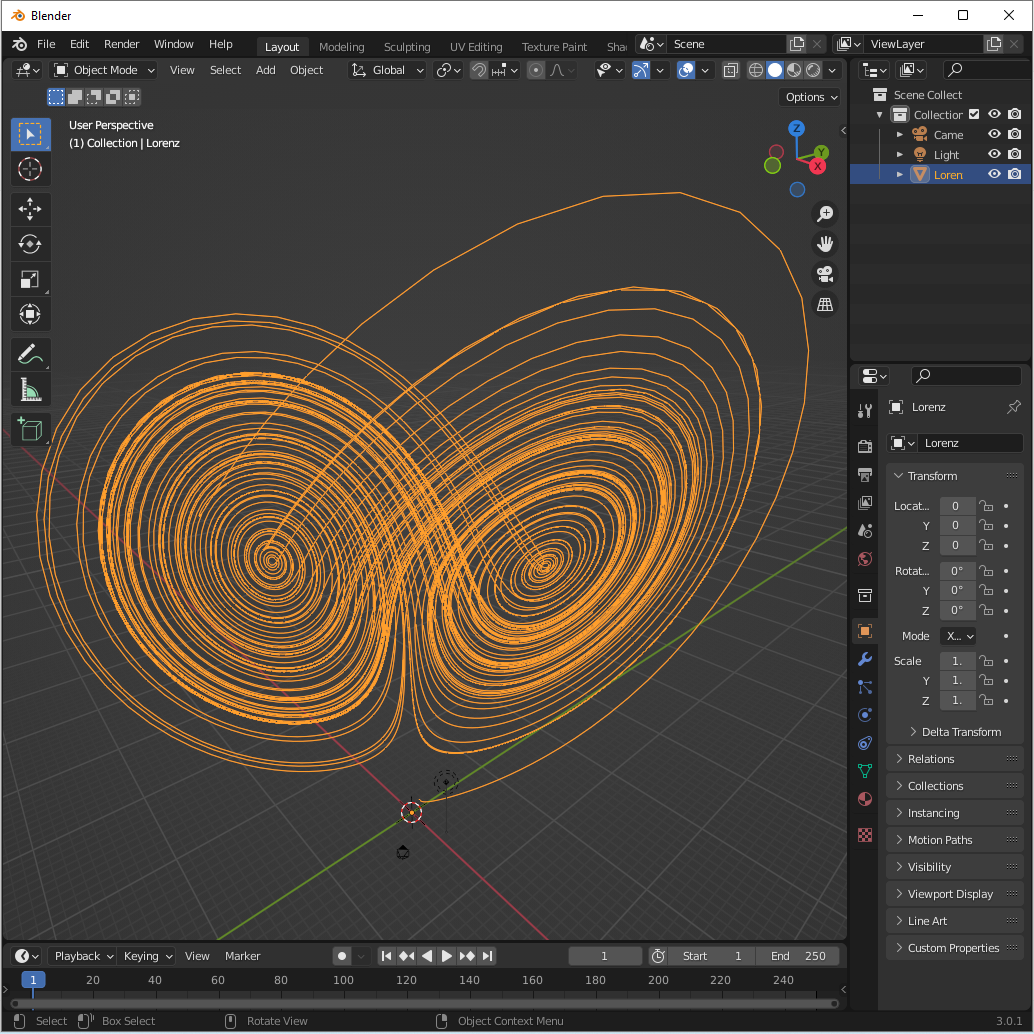
Curves can be plotted with the Scatter object. You can plot 2D or 3D curves. Below is the Lorenz chaotic attractor as an example.
def lorenz(x, y, z, s=10, r=28, b=2.667):
    """ Diff equation solver """
    x_dot = s*(y - x)
    y_dot = r*x - y - x*z
    z_dot = x*y - b*z
    return x_dot, y_dot, z_dot

# initialization
dt = 0.01
num_steps = 10000
xs = np.empty(num_steps + 1)
ys = np.empty(num_steps + 1)
zs = np.empty(num_steps + 1)
xs[0], ys[0], zs[0] = (0., 1., 1.05)


# simpulate time steps
for i in range(num_steps):
    x_dot, y_dot, z_dot = lorenz(xs[i], ys[i], zs[i])
    xs[i + 1] = xs[i] + (x_dot * dt)
    ys[i + 1] = ys[i] + (y_dot * dt)
    zs[i + 1] = zs[i] + (z_dot * dt)

# make plot
curve = bf.Scatter(x=xs, y=ys, z=zs, name='Lorenz')
curve.draw()
After applying some Blender effects we get a lovely roll of Hubba Bubba Bubble Tape.
| Output | After some simple Blendering |
|---|---|
 |
 |
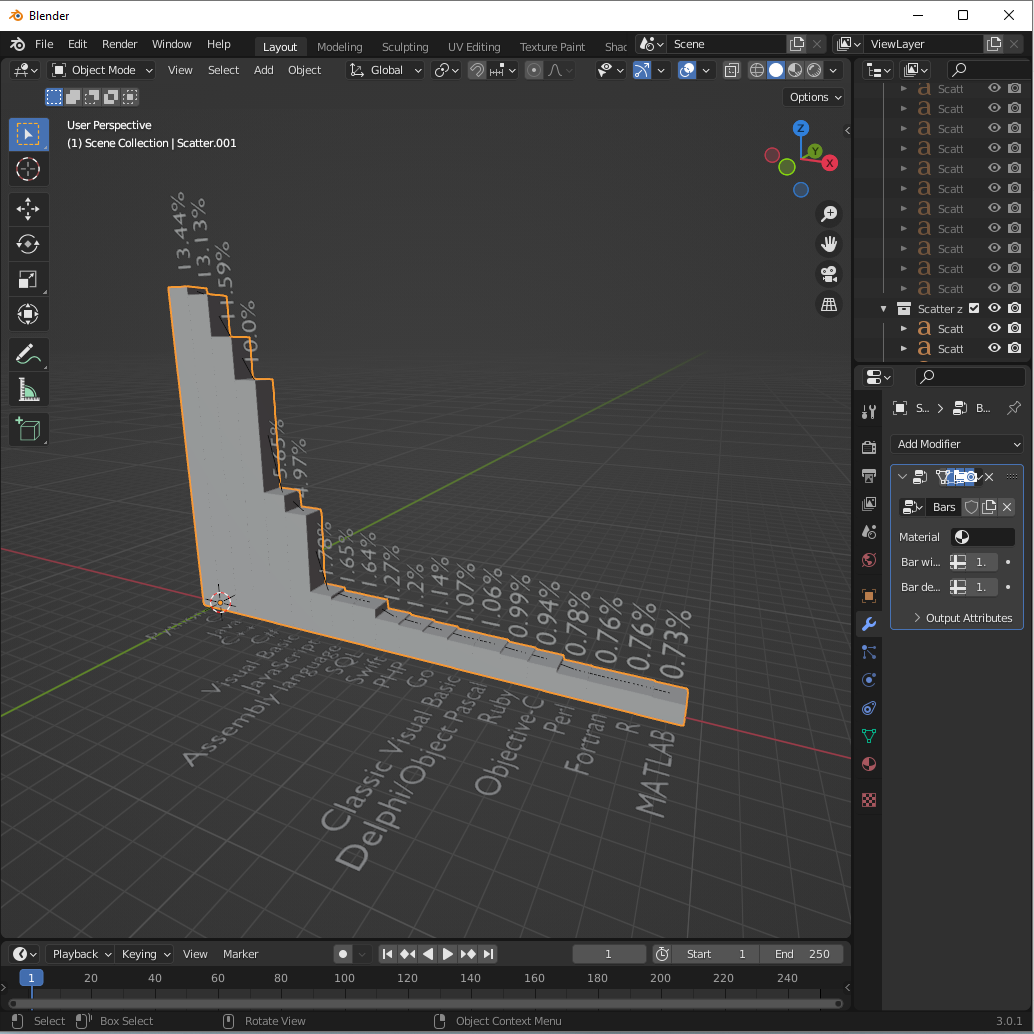
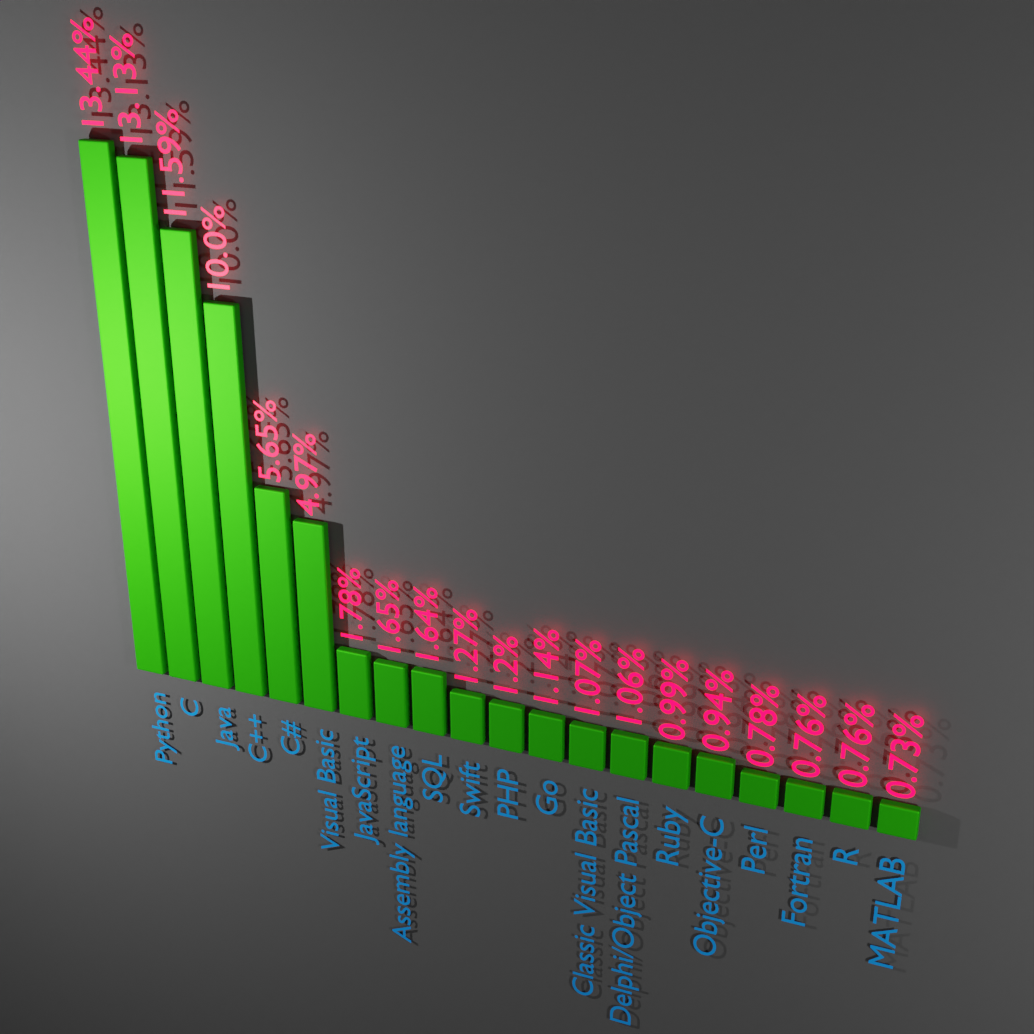
Bar plots
Bar plots can be created with the Bar object.
import pandas as pd
import blendfig as bf

# popularity of programming languages
popularity_data = pd.read_html('https://www.tiobe.com/tiobe-index/')[0]
popularity_data = popularity_data[["Programming Language.1", "Ratings"]].rename(columns={"Programming Language.1":"Name"})
popularity_data["Ratings"] = popularity_data["Ratings"].apply(lambda x: float(x[:-1]))

# make bar chart
bar = bf.Bar(x=popularity_data["Name"], z=popularity_data["Ratings"])
bar.draw()

# add labels
bar.draw_xlabels()
zlabels = popularity_data["Ratings"].apply(lambda x: f'{x}%') # add % signs
bar.draw_zlabels(zlabels)
| Output | After some simple Blendering |
|---|---|
 |
 |
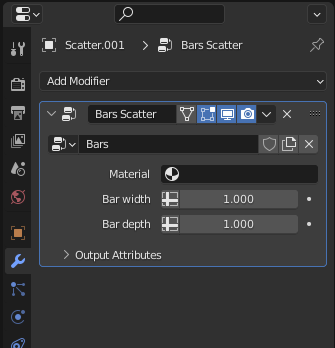
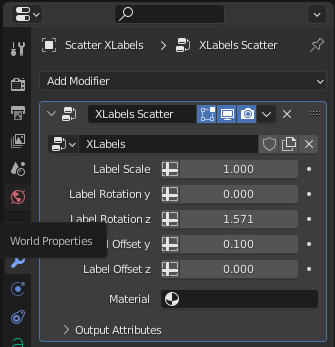
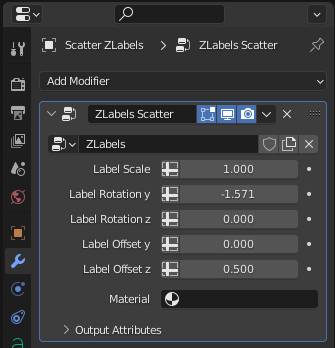
The bars and labels are generated with Geometry Nodes which allows for more customization. Selecting bars/labels and clicking on the Modifiers tab will show the following controls. Also the materials have to be set in these windows.
| bars | x labels | z labels |
|---|---|---|
 |
 |
 |
Release history Release notifications | RSS feed


Download files
Download the file for your platform. If you're not sure which to choose, learn more about installing packages.
Source Distribution
Built Distribution
Filter files by name, interpreter, ABI, and platform.
If you're not sure about the file name format, learn more about wheel file names.
Copy a direct link to the current filters
File details
Details for the file blendfig-0.1.4.tar.gz.
File metadata
- Download URL: blendfig-0.1.4.tar.gz
- Upload date:
- Size: 156.1 kB
- Tags: Source
- Uploaded using Trusted Publishing? No
- Uploaded via: twine/4.0.2 CPython/3.8.6
File hashes
| Algorithm | Hash digest | |
|---|---|---|
| SHA256 |
b565d1e4ce0655f219ddc1b3da4202ddd9bd0fc921e7345f520bc9740dd48eda
|
|
| MD5 |
46e661250a77dd58a003b8e4fb57131b
|
|
| BLAKE2b-256 |
bb7515c9c174ac5b8079b30714157c312389ff8729d2810224236872ddc111f2
|
File details
Details for the file blendfig-0.1.4-py3-none-any.whl.
File metadata
- Download URL: blendfig-0.1.4-py3-none-any.whl
- Upload date:
- Size: 167.1 kB
- Tags: Python 3
- Uploaded using Trusted Publishing? No
- Uploaded via: twine/4.0.2 CPython/3.8.6
File hashes
| Algorithm | Hash digest | |
|---|---|---|
| SHA256 |
fede4ac95d56de81ea039c3c1f7f05d1d68768fa382d4e77eeb3a56605510e91
|
|
| MD5 |
038ef1ae61900b32ebd7e5989b464499
|
|
| BLAKE2b-256 |
455d95aa841d53516ff45a81257cfbbbf166800f46e90f01625e08a64605e7ed
|


