Interactive plotting with familiar syntax in Jupyter notebooks.

Project description
BokehLab
BokehLab is an interactive plotting library with the familiar matplotlib/matlab syntax.
Built upon the Bokeh visualization library. Works with both classic Jupyter notebooks and JupyterLab.
Installation:
pip install bokehlab
To load this extension in jupyter notebook (both classic jupyter and jupyter lab):
%load_ext bokehlab
Or even shorter:
%bokehlab
To make the short syntax working, either run
python -m bokehlab.install_magic
Or manually copy bokelab_magic.py from the distribution directory to ~\.ipython\profile_default\startup.
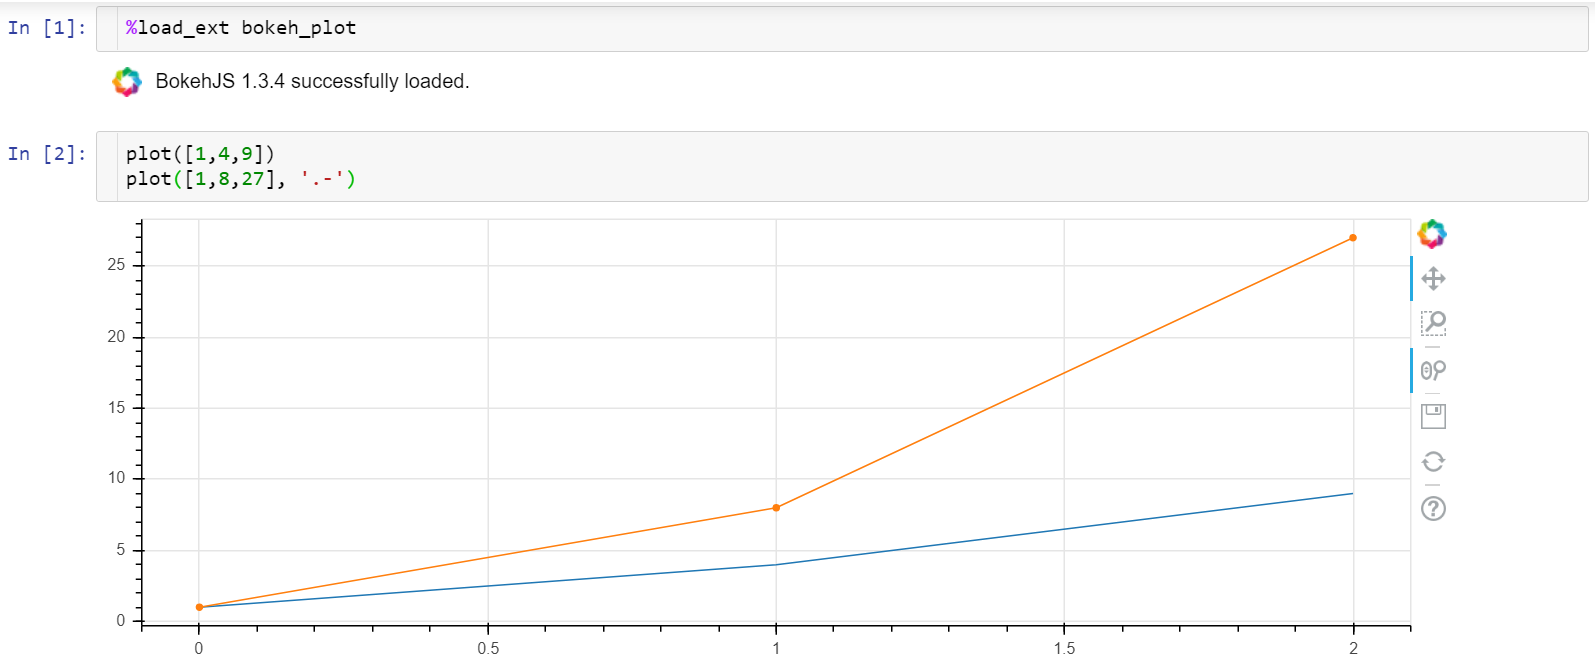
Basic plotting:
plot([1,4,9])             # dots
plot([1,4,9], '.-')       # line and dots
plot([1,2,3], [1,4,9])    # x and y
plot([1,2,3], [1,4,9], '.-')    # x, y and line style
Several plots in one figure:
Interactive controls:
click and drag = pan
mouse wheel = zoom,
wheel on x axis = zoom horizontally
wheel on y axis = zoom vertically
Multiple plots syntax (equivalent ways to draw it):
x = [1,5,10]
y1 = [1,4,9]
y2 = [1,8,27]

- plot(x, y1, '.-')        # solid line with dots
  plot(x, y2, '.-g')       # the second plot is green

- plot([y1, y2])           # auto x, auto colors

- plot(x, [y1, y2])

- plot([y1, y2], '.-bg')   # blue and green

- plot([y1, y2], style=['.', '.-'], color=['b', 'g'])

- plot(x, y1, '.-', x, y2, '.-g')
The following markers are supported so far:
'.' dots
'-' line
'.-' dots+line
The following colors are supported so far:
'b' blue
'g' green
'r' red
'O' orange  (capital O to avoid clashes with 'o' for open dots)
NB The color specifier must go after the marker if both are present.
Legend:
- plot([1,2,3], [1,4,9], label='plot1')
  plot([1,2,3], [2,5,10], label='plot2')

- plot([y1, y2], label=['y1', 'y2'])
Legend location:
- plot([1,2,3], [1,4,9], label='plot1', legend_loc='top_left')
  plot([1,2,3], [2,5,10], label='plot2')
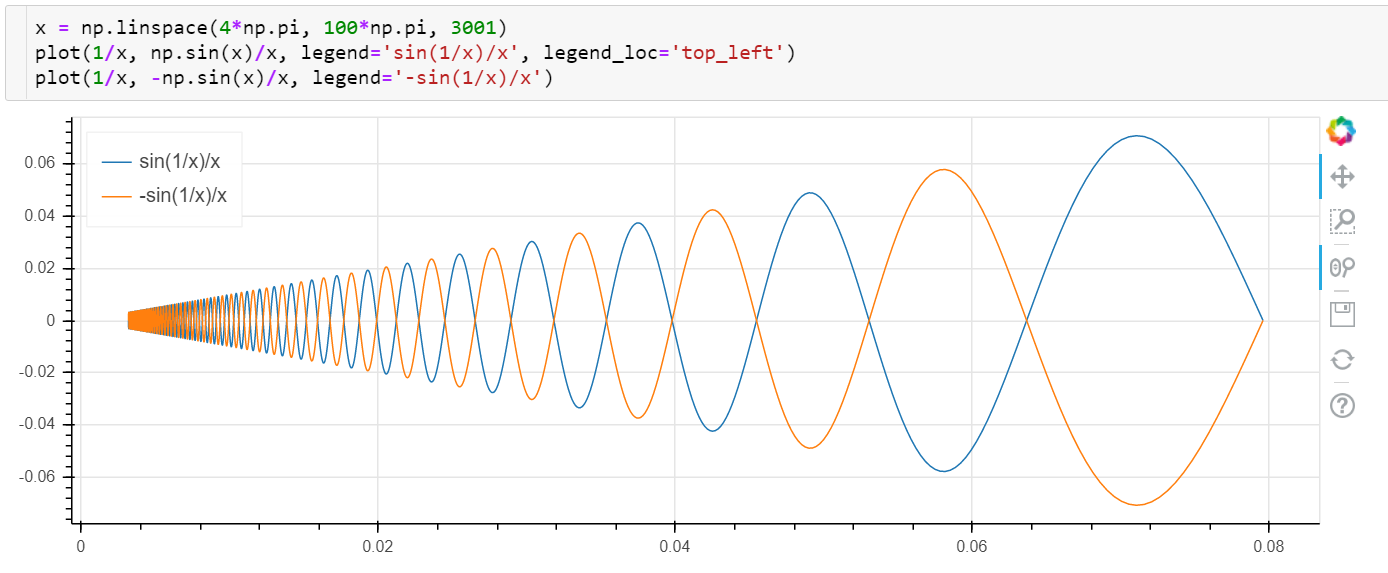
Other legend locations: https://docs.bokeh.org/en/latest/docs/user_guide/styling.html#location
Axes labels:
- plot([1,2,3], xlabel='time', ylabel='value')
- xlabel('time'); ylabel('value')
- xylabels('time', 'value')
Other uses:
-
semilogx(),semilogy()andloglog()show (semi)logarithmic plots with the same syntax asplot(). -
hist(x)displays a histogram of x -
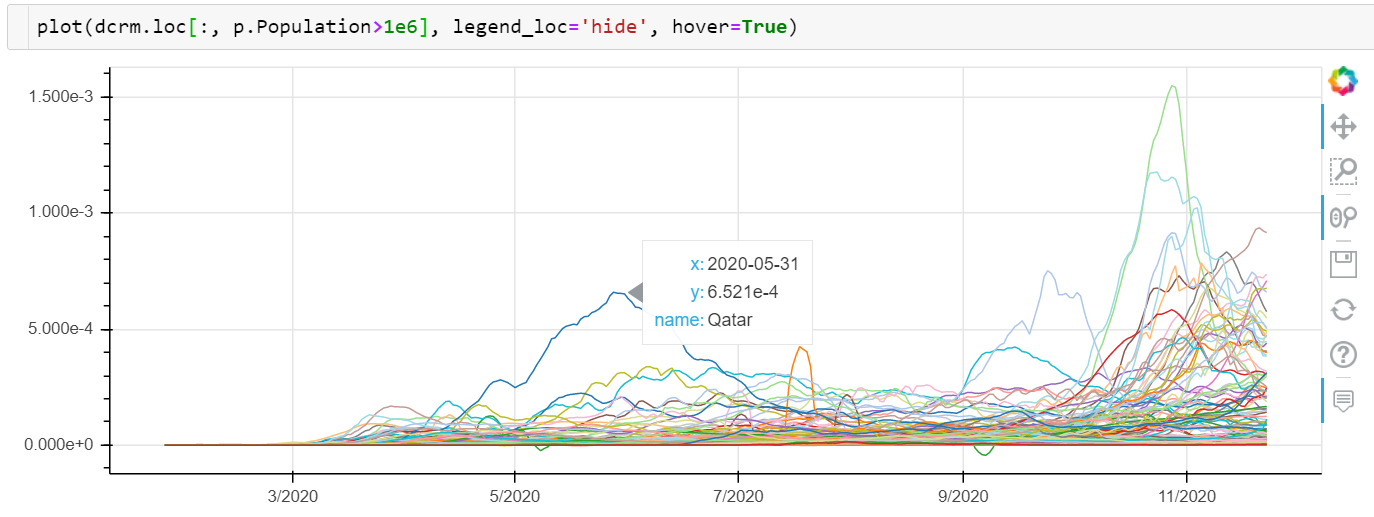
plot(x, y, hover=True)displays point coordinates on mouse hover. -
plot(x, y, vline=1, hline=1.5, vline_color='red')in addition to the (x, y) plot displays an infinite vertical line with x=1 and custom red color and an infinite horizontal line with y=1.5 and the default pink color.
Visualizing Pandas Dataframes
plot(df)plots all columns of the dataframe as separate lines on the same figure with column names displayed in the legend and with index taken as the x axis values. If the legend grows too long, it can be hidden withlegend_loc='hide'(new in v0.1.13):
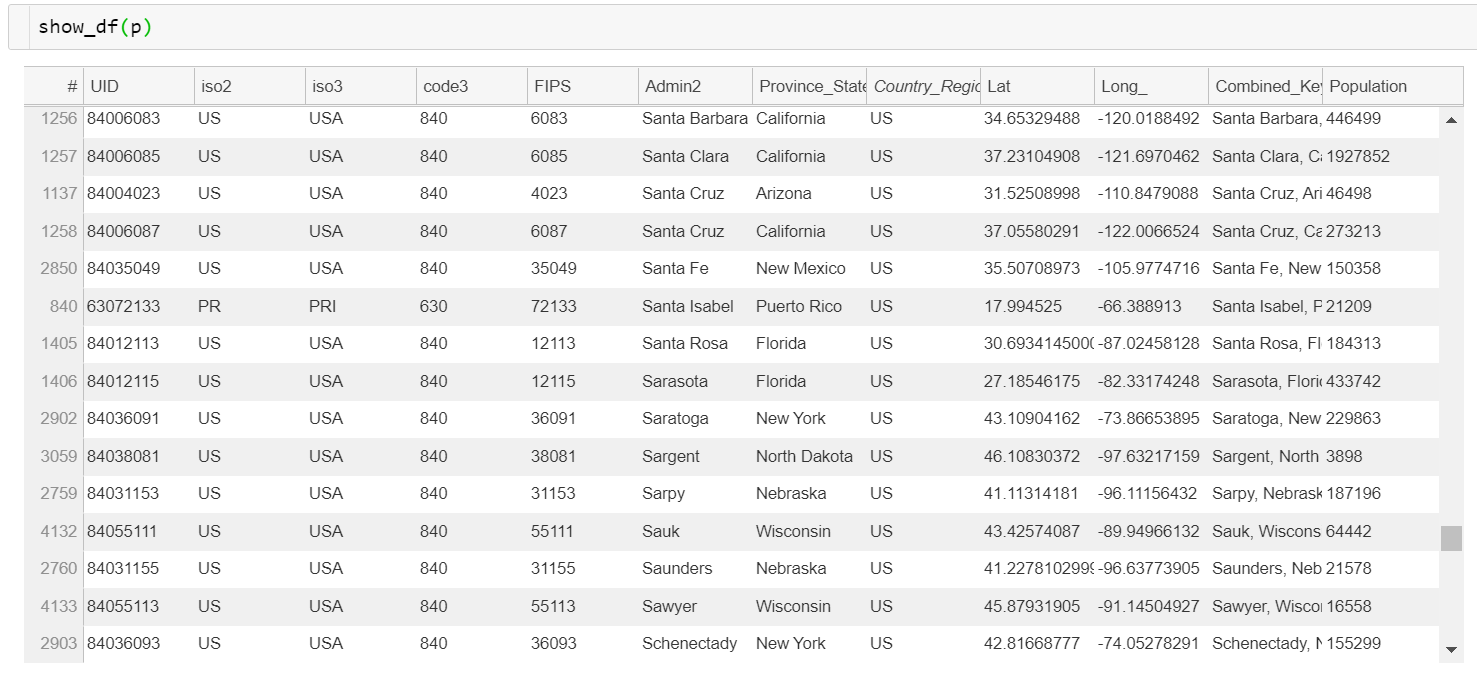
show_df(df)displays pandas dataframe as a table (new in v0.1.14):
Displaying Images
imshow(a)displays an array as an image:

Complete list of colormaps: https://matplotlib.org/3.5.0/tutorials/colors/colormaps.html
imshow(im1, im2, ...)shows several images side by side with linked panning and zooming (link=Falseto disable):

imshow([[im1, im2, ...], [im3, im4, ... ], ...])displays a matrix of images with panning and zooming linked row-wise:

See also a contour plot example in the bokeh gallery page.
Location of the JavaScript code
The Bokeh library consists of two parts: backend is written in Python, the frontend is in javascript.В
By default, Bokehlab (just like Bokeh) will get the required BokehJs code from the internet, from cdn.bokeh.org. This mode is called 'cdn' (=content delivery network). Generally it is fine, except that it doesn't work offline.
Another option is to bundle the javascript into the ipynb notebook:
%bokehlab inline
It is also ok, except that the size of the ipynb file grows by ~6Mb. It would look reasonable if it made notebook work on a computer without Bokeh installed, but in reality the python part is also essential for the plots to work, so basically it is just a waste of disk space. Bokehlab introduces a third option:В
%bokehlab local
It serves javascript files from the locally installed Bokeh library. It both works offline and does not take any extra space. The only issue with this mode is that it needs a one-shot setup:
pip install bokeh-resources
python -m bokeh-resources.install
This mode can also be used in 'vanilla' Bokeh, see the instructions on github.
Configuring the defaults
You can set the default size of the figure with %bokehlab_config magic command (or its shorter alias %blc):В
%blc width=500 height=200
This size will apply to all figures in the current notebook. To make this change permanent, use -g (or --global flag):
%blc -g width=500 height=200
It will save those values to ~/.bokeh/bokehlab.yaml and use them in the future Jupyter sessions.
You can also make Bokehlab remember your preferred mode of loading the javascript half of the library, so instead of always writing %bokehlab local in every ipynb file can do
%blc -g resources=local
and %bokehlab will use locally served resources from now on.
Config is also capable or 'memorizing' the repeated arguments to any of the commands described above. For example, to tell Bokehlab to use thicker lines:
%blc plot.line_width=2
and all subsequent calls to plot will assume line_width argument to be 2 (pixels) instead of one (this feature is work-in-progress, not all options are configurable yet).
To revert any configured option:
%blc -d plot.line_width
A list of currently active settings is displayed with
%blc
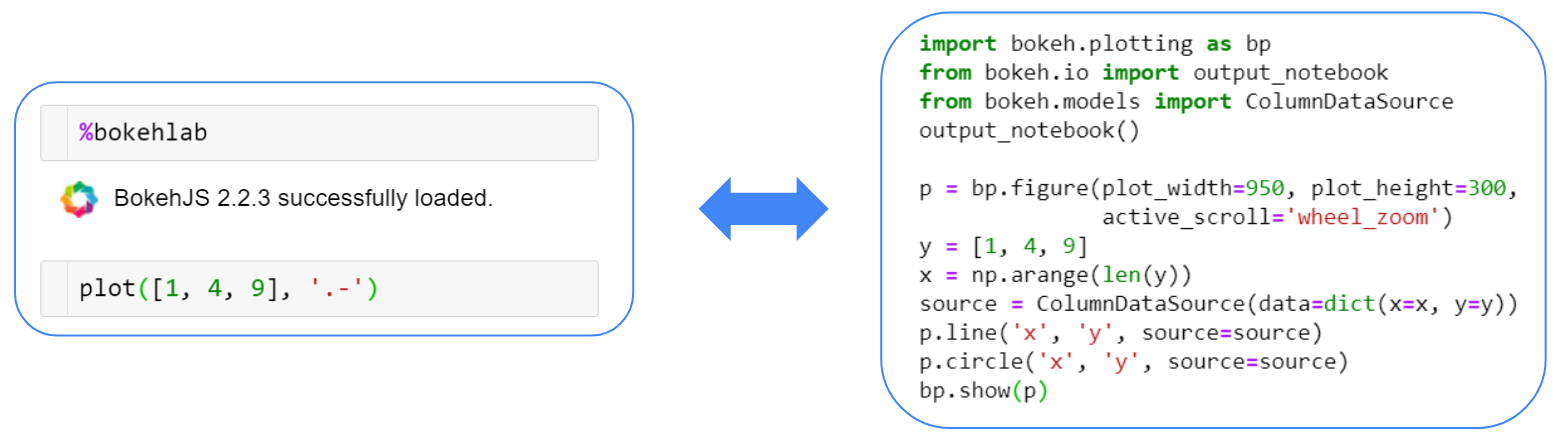
Comparison to bokeh
Bokehlab is a thin wrapper over the excellent library bokeh primarily aimed at cutting down the amount of boilerplate code.
The following commands are equivalent:
Release history Release notifications | RSS feed


Download files
Download the file for your platform. If you're not sure which to choose, learn more about installing packages.
Source Distribution
Built Distribution
Filter files by name, interpreter, ABI, and platform.
If you're not sure about the file name format, learn more about wheel file names.
Copy a direct link to the current filters
File details
Details for the file bokehlab-0.2.10.tar.gz.
File metadata
- Download URL: bokehlab-0.2.10.tar.gz
- Upload date:
- Size: 25.5 kB
- Tags: Source
- Uploaded using Trusted Publishing? No
- Uploaded via: twine/4.0.2 CPython/3.10.1
File hashes
| Algorithm | Hash digest | |
|---|---|---|
| SHA256 |
c0a4c7bb742e2ac41eeeabb64b46a3b394e9122b8f81c8860b2a7aa3bb18a090
|
|
| MD5 |
8d334ca7babc9e5fe1ac2a3aafa4c5c9
|
|
| BLAKE2b-256 |
dcfea26bfb376e62da0e7bb0b31ef2dc034a298a723c1982053a7b827b84dbde
|
File details
Details for the file bokehlab-0.2.10-py3-none-any.whl.
File metadata
- Download URL: bokehlab-0.2.10-py3-none-any.whl
- Upload date:
- Size: 23.8 kB
- Tags: Python 3
- Uploaded using Trusted Publishing? No
- Uploaded via: twine/4.0.2 CPython/3.10.1
File hashes
| Algorithm | Hash digest | |
|---|---|---|
| SHA256 |
f51b7af8ba7972fd9b6400edc1cf84a748cd1c2f1576d0c36b4014ad8e1f2664
|
|
| MD5 |
33580cac8aec011fa4c2aecb5212853f
|
|
| BLAKE2b-256 |
66a59e0bb41ac44f1917e393b698ef5a07df913a813ff066449c123044bedc46
|


