
bootplot is a package for black-box uncertainty visualization.

Project description





bootplot is a package for black-box uncertainty visualization. By providing a dataset and a plotting function, bootplot automatically generates a static image and an animation of your uncertainty.
The method works by resampling the original dataset using bootstrap and plotting each bootstrapped sample. The plots are then combined into a single image or an animation. bootplot is also especially useful when dealing with small datasets, since it relies on the bootstrap method which robustly estimates uncertainty using resampling.
bootplot supports datasets represented as numpy arrays or pandas dataframes. Supported image output formats include popular formats such as JPG, PNG, BMP. Supported animation formats include popular formats such as GIF and MP4.
Installation
bootplot requires Python version 3.8 or greater. You can install it using:
pip install bootplot
Alternatively, you can install bootplot using:
git clone https://github.com/davidnabergoj/bootplot
cd bootplot
python setup.py install
Example
Suppose we have some data and their corresponding targets. We can model our targets with a regression line and visualize the uncertainty with the following code:
import numpy as np
from sklearn.linear_model import LinearRegression

from bootplot import bootplot


def plot_regression(data_subset, data_full, ax):
    # Plot full dataset
    ax.scatter(data_full[:, 0], data_full[:, 1])

    # Plot regression line trained on the subset
    lr = LinearRegression()
    lr.fit(data_subset[:, 0].reshape(-1, 1), data_subset[:, 1])
    ax.plot([-10, 10], lr.predict([[-10], [10]]), c='r')

    # Show root mean squared error in a text box
    rmse = np.sqrt(np.mean(np.square(data_subset[:, 1] - lr.predict(data_subset[:, 0].reshape(-1, 1)))))
    bbox_kwargs = dict(facecolor='none', edgecolor='black', pad=10.0)
    ax.text(x=0, y=-8, s=f'RMSE: {rmse:.4f}', fontsize=12, ha='center', bbox=bbox_kwargs)

    ax.set_xlim(-10, 10)
    ax.set_ylim(-10, 10)

if __name__ == '__main__':
    np.random.seed(0)

    # Dataset to be modeled
    dataset = np.random.randn(100, 2)
    noise = np.random.randn(len(dataset)) * 2.5
    dataset[:, 1] = dataset[:, 0] * 1.5 + 2 + noise

    # Create image and animation that show uncertainty
    bootplot(
        plot_regression,
        dataset,
        output_image_path='demo_image.png',
        output_animation_path='demo_animation.gif',
        verbose=True
    )
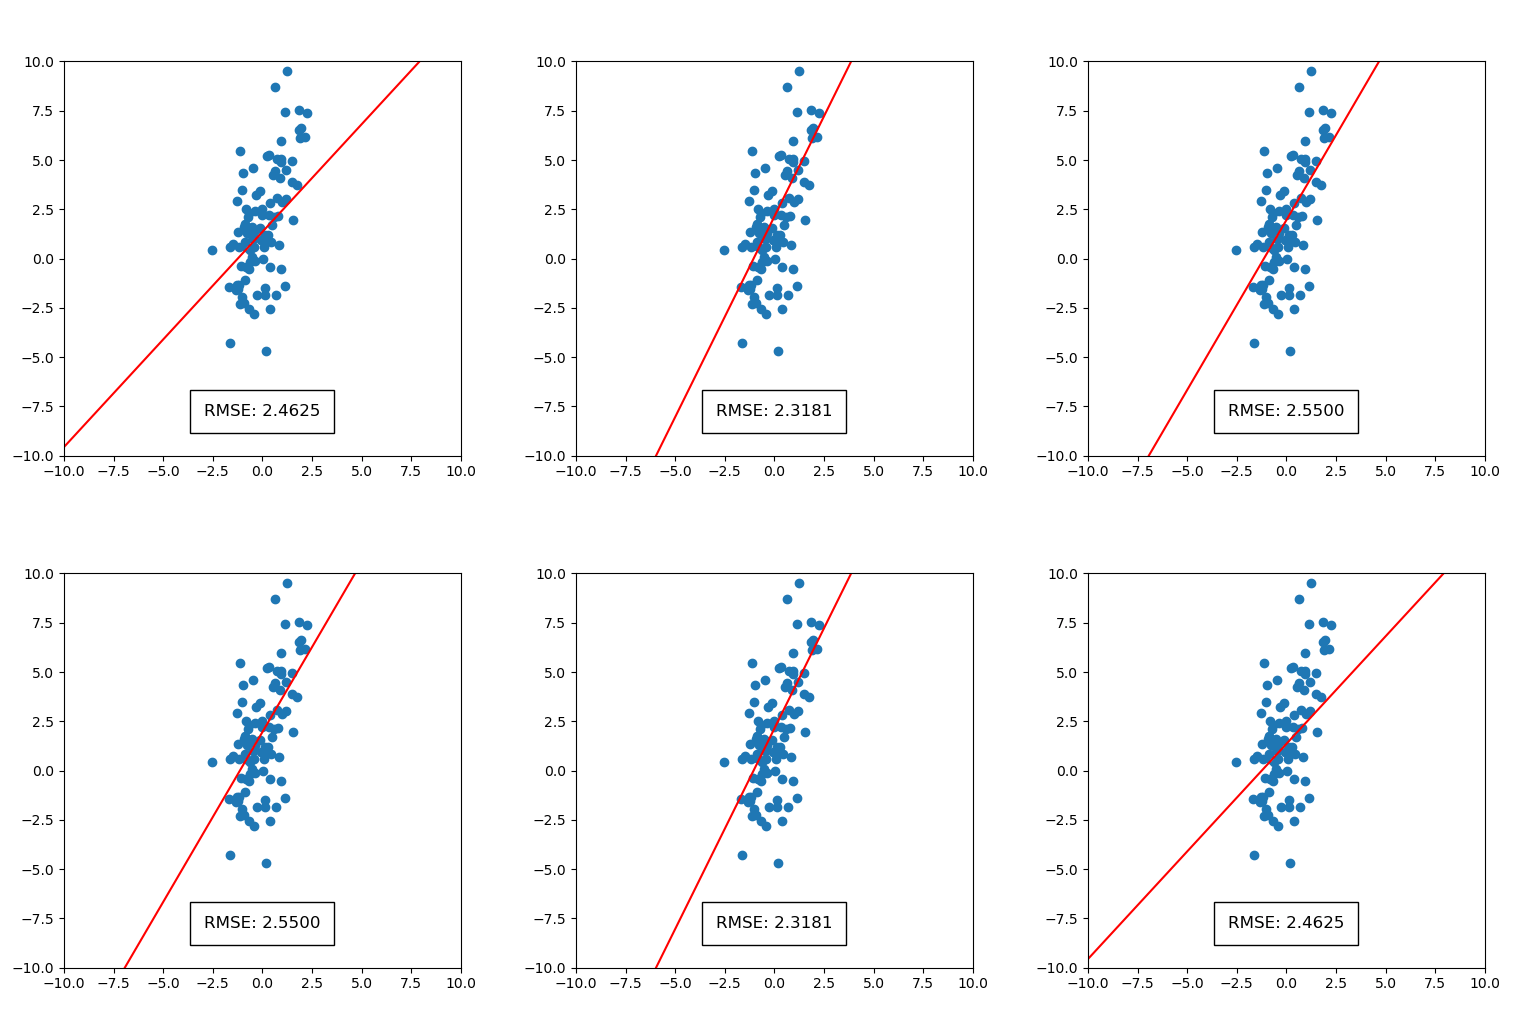
This will generate a static image and an animation, as shown below. The static image on points shows the full scattered dataset in blue and regression lines that correspond to each bootstrapped sample of the dataset in red. The spread of regression lines represents uncertainty according to the bootstrap process. We can also see the uncertainty in root mean squared error (RMSE). We see that only the first digit of RMSE is significant, since the decimal part is blurred. The animation on the right displays uncertainty by iterating over a sequence of plots containing regression lines.
 |
 |
See the examples folder for more examples, including bar charts, point plots, polynomial regression models, pie charts, text plots and pandas dataframes.
Documentation
Read the documentation and check out tutorials at https://bootplot.readthedocs.io/en/latest/
Release history Release notifications | RSS feed


Download files
Download the file for your platform. If you're not sure which to choose, learn more about installing packages.
Source Distribution
Built Distribution
Filter files by name, interpreter, ABI, and platform.
If you're not sure about the file name format, learn more about wheel file names.
Copy a direct link to the current filters
File details
Details for the file bootplot-0.0.17.tar.gz.
File metadata
- Download URL: bootplot-0.0.17.tar.gz
- Upload date:
- Size: 14.5 kB
- Tags: Source
- Uploaded using Trusted Publishing? No
- Uploaded via: twine/6.2.0 CPython/3.9.25
File hashes
| Algorithm | Hash digest | |
|---|---|---|
| SHA256 |
8e82abbdfe32833676c64504144ca0ba69acedf4c03493787dbe2dcfcc65c242
|
|
| MD5 |
bc2fa7e787472a6bcb57f9f1a2881853
|
|
| BLAKE2b-256 |
a5577047f5bb0a106c3c83270f3d86a80bb63063b0b7b7e87fa7c70180204323
|
File details
Details for the file bootplot-0.0.17-py3-none-any.whl.
File metadata
- Download URL: bootplot-0.0.17-py3-none-any.whl
- Upload date:
- Size: 15.3 kB
- Tags: Python 3
- Uploaded using Trusted Publishing? No
- Uploaded via: twine/6.2.0 CPython/3.9.25
File hashes
| Algorithm | Hash digest | |
|---|---|---|
| SHA256 |
0c61e1d37e49db79038256d94816f02a730cc6d679aae86cb3ec93ae8e7383e3
|
|
| MD5 |
a3e962bfdf689a5f263fdeb3d103008f
|
|
| BLAKE2b-256 |
cb4225a9309b03ea76c8911b51351a03a58d5bbdcf28d9938975c021107e0cb5
|






