A Matplotlib-based utility module for creating broken axes.

Project description
break_axes: Matplotlib Axis Break and Custom Scaling Tool
A Python-based Matplotlib extension module for implementing axis breaks (visual gaps) and multi-interval custom scaling functions, suitable for displaying data with large value ranges or irrelevant intermediate intervals.
Module Overview
Matplotlib natively does not support axis breaks (visual gaps) and flexible multi-interval scaling. This module fills this gap with a series of easy-to-use functions, including:
- Drawing break markers on axis edges to indicate data gaps
- Clipping axis spines, lines, and plot elements to hide unwanted intervals
- Supporting linear/logarithmic custom scaling for multiple data intervals
Installation
-
Install from PyPI
pip install break_axes
-
Build the binary distribution package (wheel) locally
First install thebuildtool:pip install build, then run:python -m build
This generates a
.whlbinary package in thedist/directory (faster installation). -
Install the package locally (development mode)
Use this for development and real-time debugging, allowing code changes without reinstalling:pip install -e .
Core Functions
The functions are usually used are below:
scale_axesbroken_and_clip_axesremove_minor_ticks
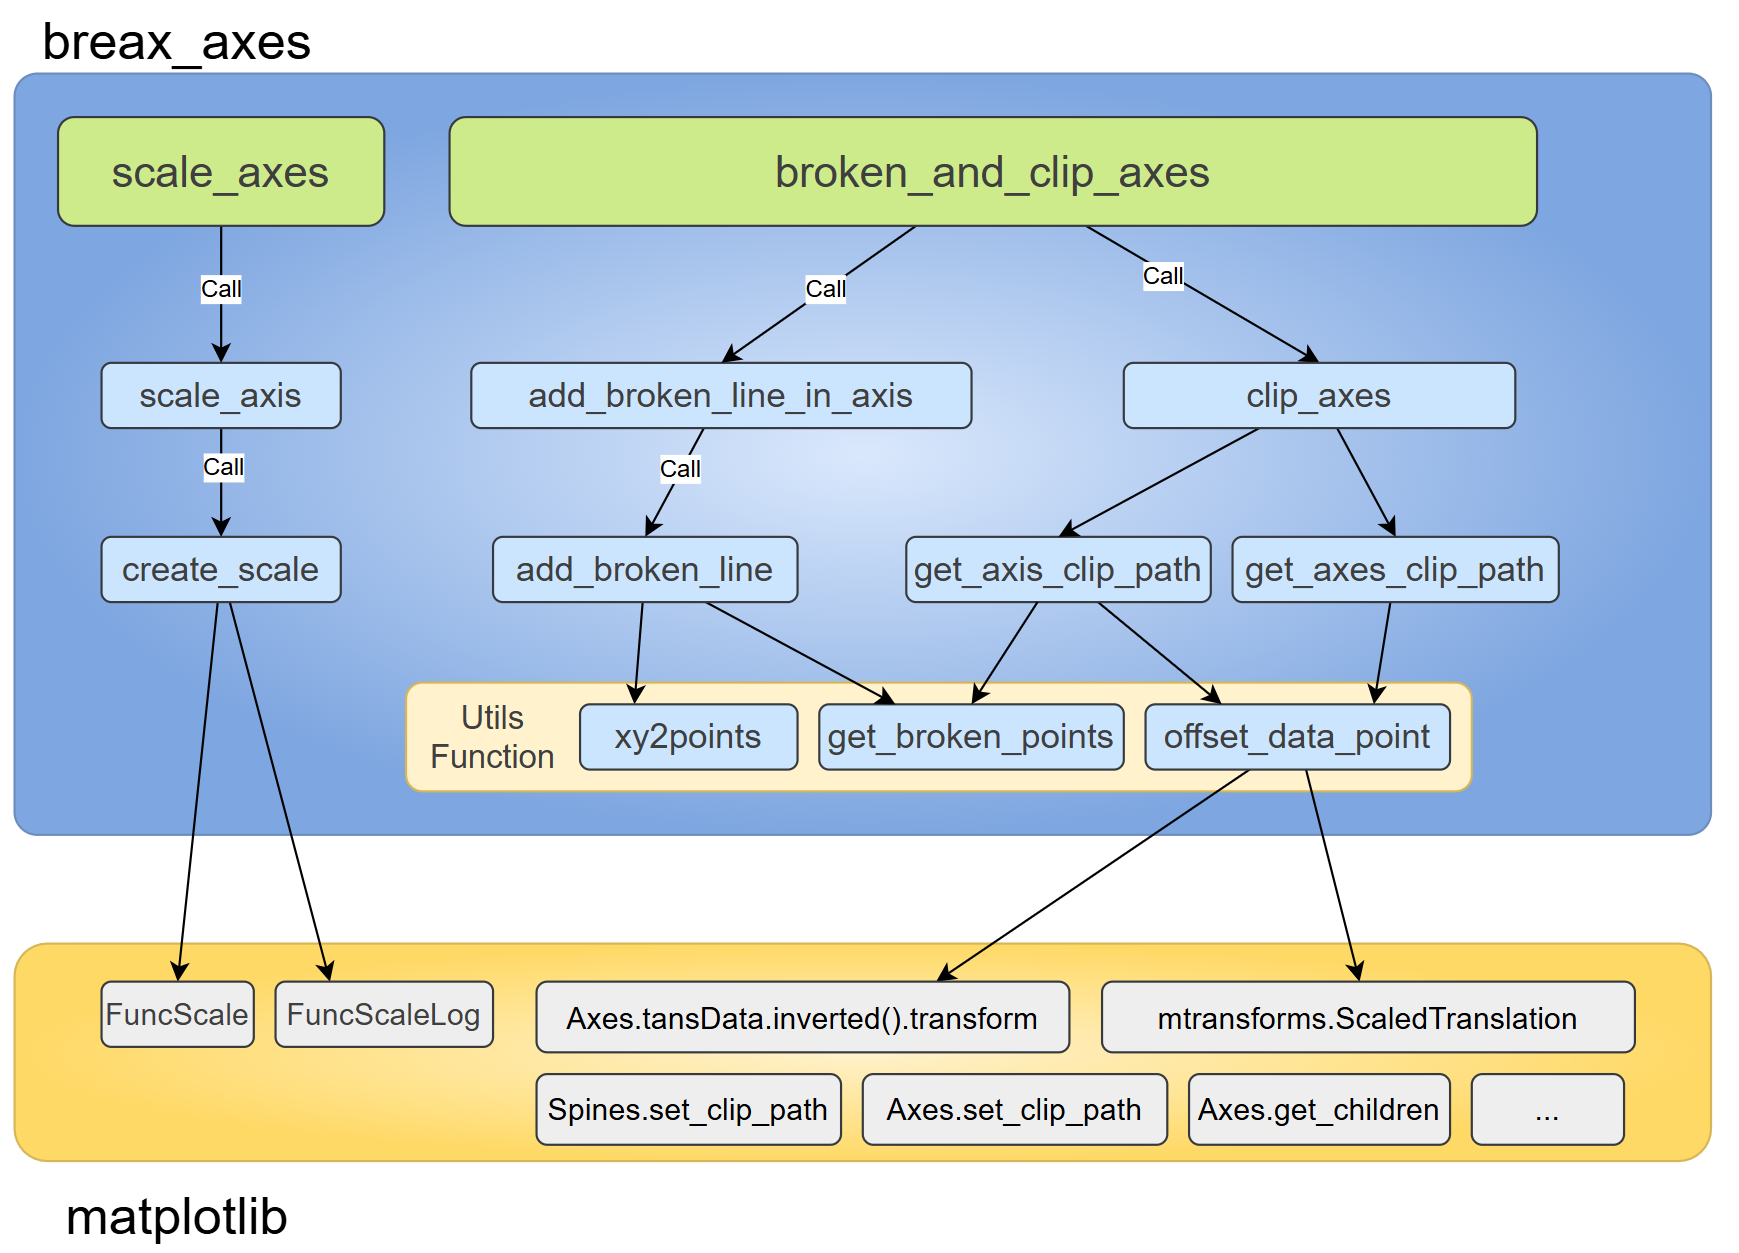
However, for more flexible break settings, you may need to read the source code (less than 900 lines, about half of which are docstrings).
| Function Name | Description |
|---|---|
create_scale |
Used to generate a ScaleBase object for scaled axes |
scale_axis |
A wrapper function for create_scale, used to directly apply scaling |
scale_axes |
Used to apply axis scaling in batches, supporting simultaneous scaling of x-axis and y-axis |
offset_data_point |
Get the vertex coordinates of the break identifier corresponding to the specified break point |
get_broken_points |
Get the vertex coordinates of the marker end points |
xy2points |
Combine input x, y coordinates into data point coordinates |
add_broken_line |
Add break markers at specified positions |
add_broken_line_in_axis |
Add break markers on the axis |
get_axis_clip_path |
Get the clipping path of the specified axis for clipping axis spines |
get_axes_clip_path |
Get the clipping path of the axes for clipping artists within the axes |
clip_axes |
Clip spines and artists |
broken_and_clip_axes |
Wrapper for add_broken_line_in_axis and clip_axes |
remove_minor_ticks |
Remove minor ticks from the given axis |
remove_xaxis_minor_ticks |
Remove minor ticks from the x-axis |
remove_yaxis_minor_ticks |
Remove minor ticks from the y-axis |
Dependencies
- Python 3.8 or higher
- Matplotlib 3.5.0 or higher
Installation command:pip install matplotlib
Quick Start
1. Import the Module
import matplotlib.pyplot as plt

from break_axes import __version__, scale_axes, broken_and_clip_axes

plt.rcParams['figure.figsize'] = (3,3)
plt.rcParams['figure.dpi'] = 200
plt.rcParams['axes.linewidth'] = 1.5

print(f"break_axes version: {__version__}")
2. Multiple Axis Breaks
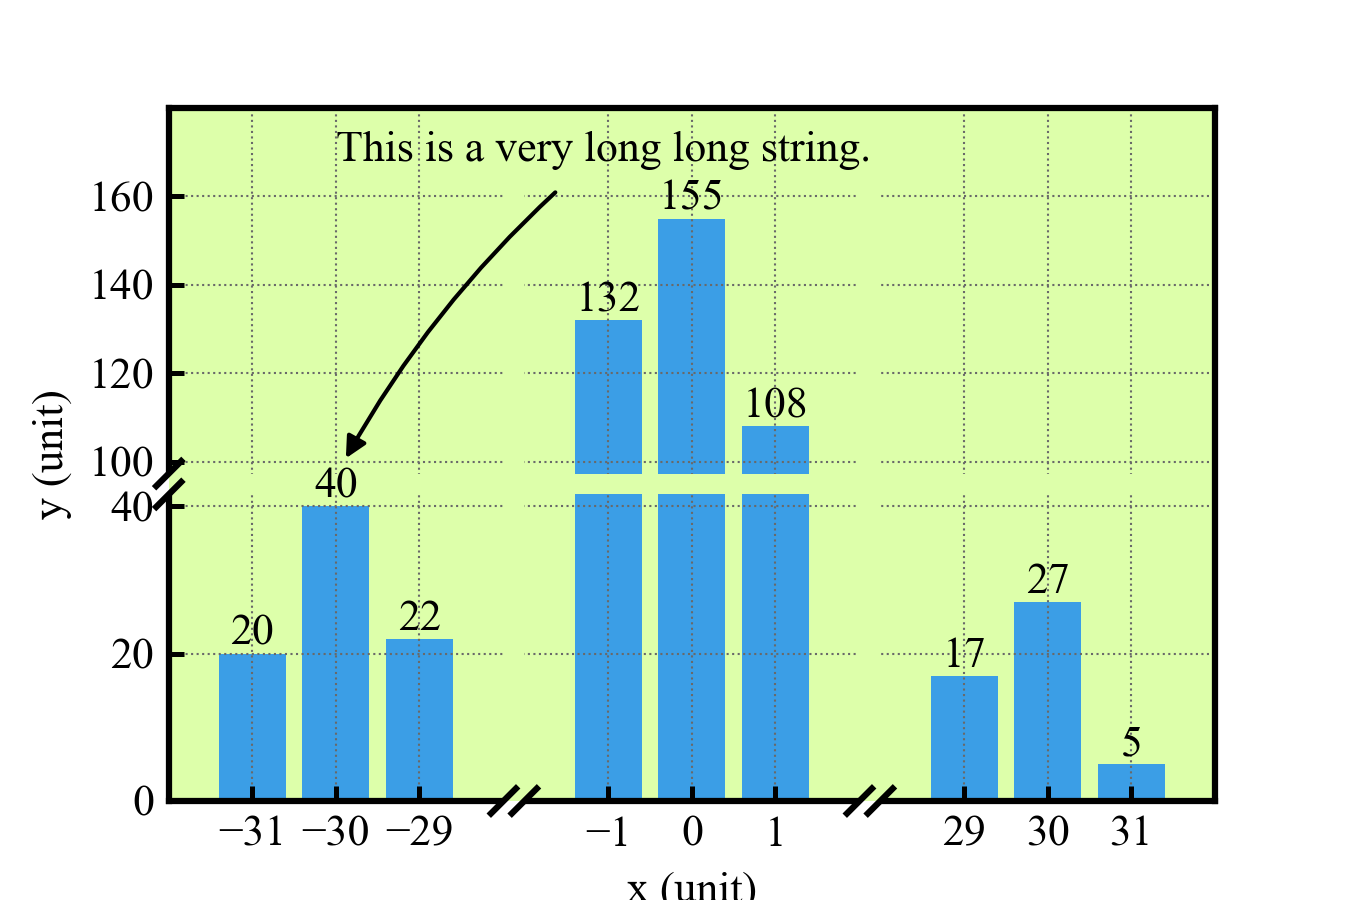
fig, ax = plt.subplots(figsize=(4.5,3))
ax.set(xlim=(-32,32), ylim=(0,180), xlabel="x (unit)", ylabel="y (unit)")
ax.set_facecolor("#DDFFAA")
ax.grid(ls=':', lw=0.5, color='dimgray')
# scale x-axis and y-axis to reduce the blank space
scale_axes(ax,
x_interval=[(-28, -2, 0.01), (2, 28, 0.01)],
y_interval=[(40,100, 0.1), (100, 180, 0.6)],
mode="linear")
_ = ax.set_xticks([-31,-30,-29,-1,0,1,29,30,31])
_ = ax.set_yticks([0,20, 40, 100, 120, 140,160])
rects = ax.bar([-31,-30,-29,-1,0,1,31,30,29], [20,40,22,132,155,108,5,27,17] )
ax.bar_label(rects)
# Text and Annotation wont be clipped
ax.annotate("This is a very long long string.", xy=(-30, 80), xytext=(-30, 168),
arrowprops=dict(
arrowstyle='-|>',
connectionstyle="arc3,rad=0.1",
color='k',
shrinkA=5, shrinkB=5
)
)
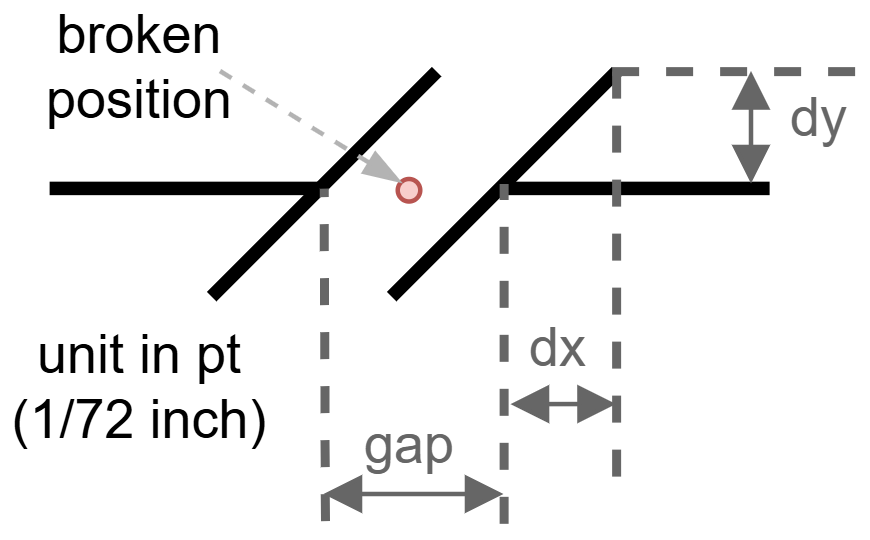
# Add broken line in x-axis and y-axis, clip spines and artists in axes
broken_and_clip_axes(ax, x=[-15,15], y=[70], axes_clip=True, which='lower',
gap=5, dx=3, dy=3)
# plt.savefig("break_axes_bar.png", transparent=False)
3. Logarithmic Axes
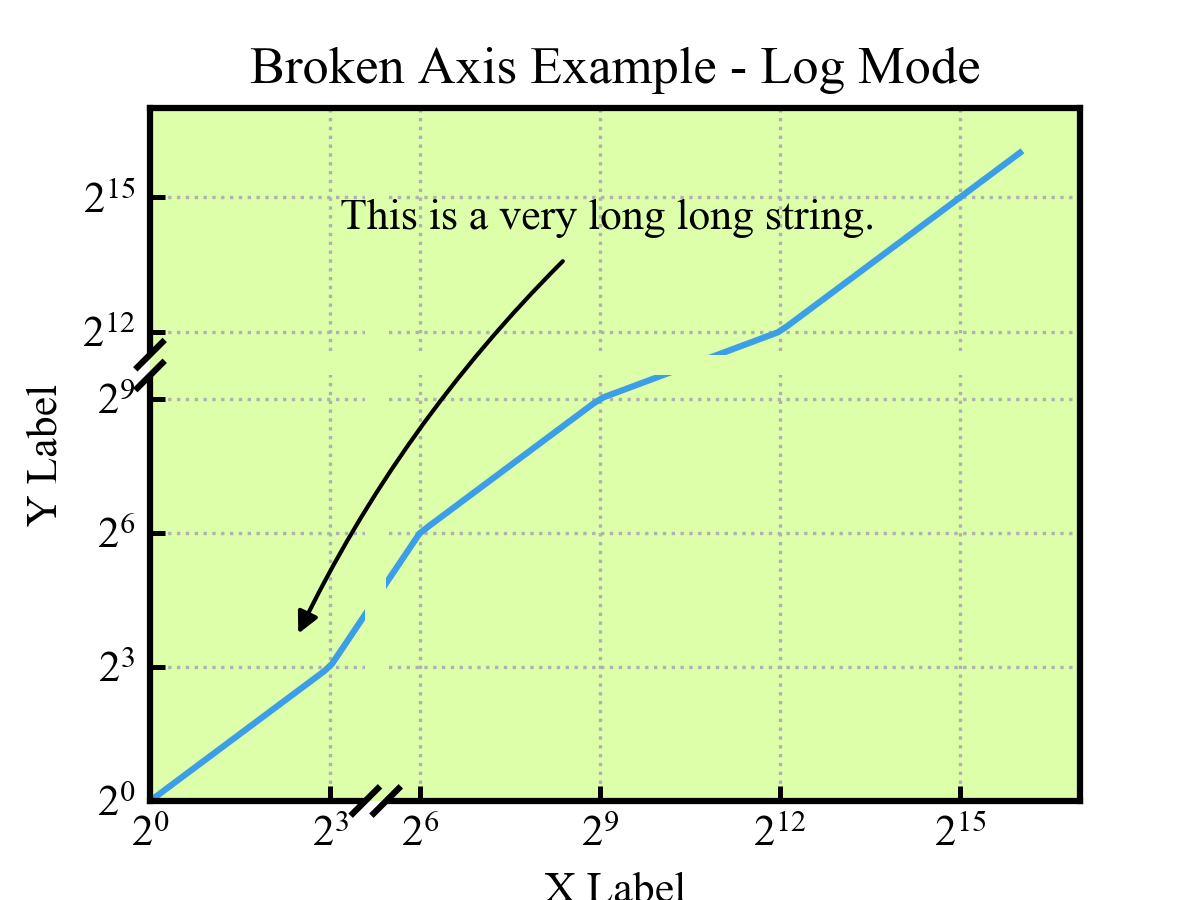
import numpy as np

x = np.logspace(0, 16, 100, base=2)

fig, ax = plt.subplots(figsize=(4,3))
ax.set(xlim=(1, 2<<16), ylim=(1, 2<<16), facecolor="#DDFFAA")
ax.plot(x, x)
ax.set_xticks([ 2<<i for i in range(0,17,3)])
# ax.set_yticks([1, 10, 100, 500, 5000, 10000],
#               [1, 10, 100, 500, 5000, r'$10^4$'])  # type: ignore

ax.annotate("This is a very long long string.",
    xy=(5, 10), xytext=(10, 20000),
    arrowprops=dict(
        arrowstyle='-|>',
        connectionstyle="arc3,rad=0.1",
        color='k',
        shrinkA=5, shrinkB=5
    )
)

ax.grid(ls=':')
ax.set_xlabel("X Label")
ax.set_ylabel("Y Label")
ax.set_title("Broken Axis Example - Log Mode")

scale_axes(ax,
    x_interval=[(3, 6, 0.5)],
    y_interval=[(9, 12, 0.5)],
    mode='log', base_x=2, base_y=2)
broken_and_clip_axes(ax, x=[23], y=[1450],
    axes_clip=True, which='lower', gap=5, dx=3, dy=3)

plt.show()
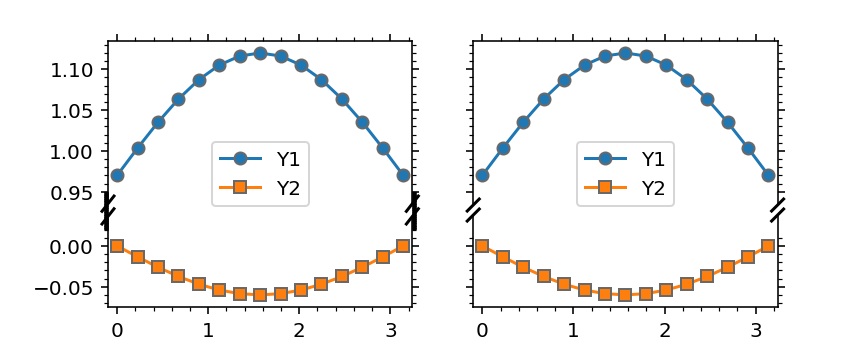
4. Remove Minor Ticks
Minor Ticks in scaled interval maybe too dense because of the small scale factor,
use remove_minor_ticks to remove minor ticks in the given axis.
import matplotlib.pyplot as plt
import numpy as np

from break_axes import broken_and_clip_axes, scale_axes
from break_axes.break_axes import remove_yaxis_minor_ticks

plt.rcParams["ytick.minor.visible"] = True
plt.rcParams["xtick.minor.visible"] = True
plt.rcParams["xtick.top"] = True
plt.rcParams["ytick.right"] = True


x = np.linspace(0, np.pi, 25)
y1 = 0.15 * np.sin(x) + 0.97
y2 = -0.06 * np.sin(x)

fig, (ax1, ax2) = plt.subplots(1, 2, figsize=(6, 2.4), sharey=True)
for ax in (ax1, ax2):
    ax.set_xlim(-0.1, np.pi + 0.1)
    ax.plot(x, y1, marker="o", mew=1, mec="dimgray")
    ax.plot(x, y2, marker="s", mew=1, mec="dimgray")

    ax.set_yticks([-0.05, 0, 0.95, 1, 1.05, 1.1])
    scale_axes(ax, y_interval=[(0.02, 0.95, 0.05)])

    ax.set_yticks([-0.05, 0, 0.95, 1, 1.05, 1.1])

    broken_and_clip_axes(ax, y=[0.5])

# must be put below set_yticks or set_xticks
remove_yaxis_minor_ticks(ax2, intervals=[(0.02, 0.95)])

plt.show()
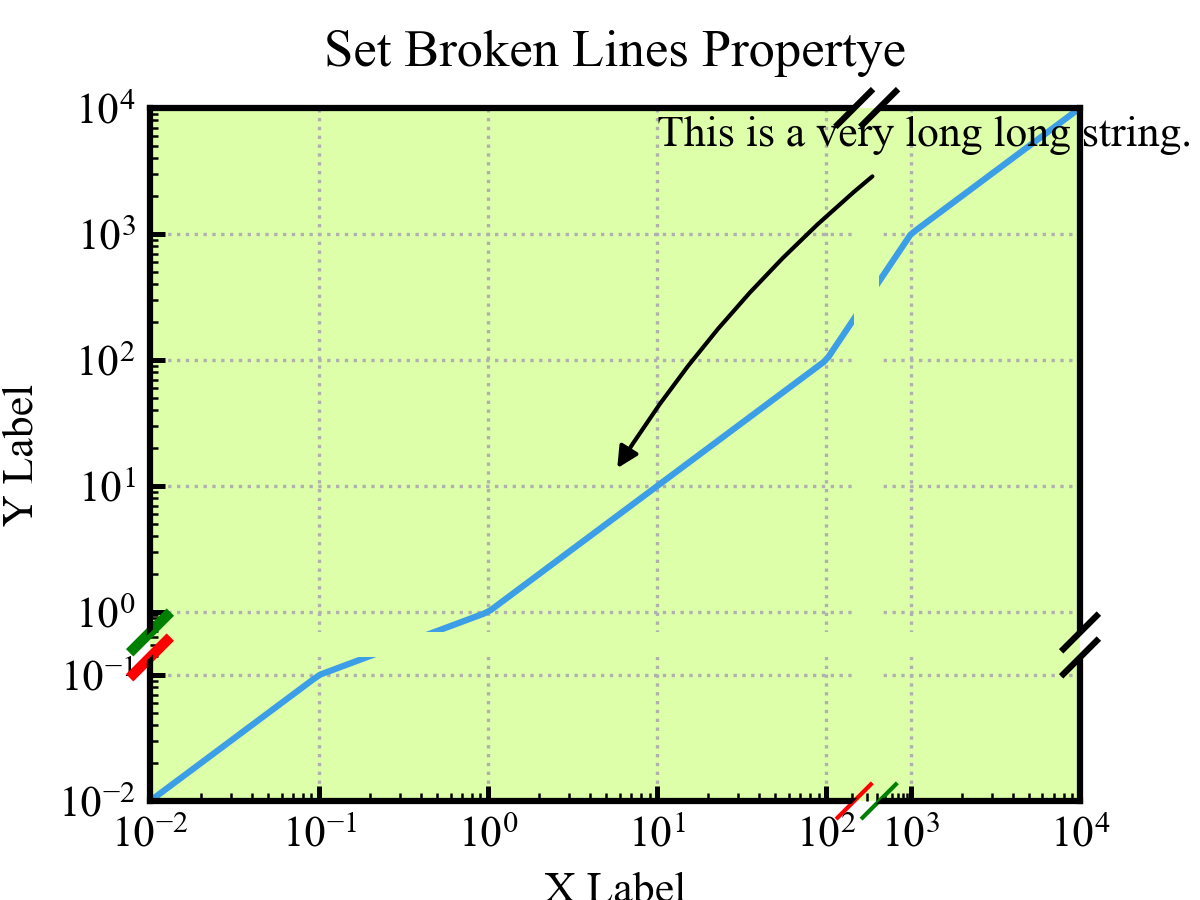
5. Set Broken Lines Property
import numpy as np

x = np.logspace(-2, 4, 150)

fig, ax = plt.subplots(figsize=(4,3))
ax.set(xlim=(1,10000), ylim=(1,10000), facecolor="#DDFFAA")
ax.plot(x, x)
ax.set_xticks([0.01, 0.1, 1, 10, 100, 500, 5000, 10000])
ax.set_yticks([0.01, 0.1, 1, 10, 100, 500, 5000, 10000])

ax.annotate("This is a very long long string.",
    xy=(5, 10), xytext=(10, 5000),
    arrowprops=dict(
        arrowstyle='-|>',
        connectionstyle="arc3,rad=0.1",
        color='k',
        shrinkA=5, shrinkB=5
    )
)

ax.grid(ls=':')
ax.set_xlabel("X Label")
ax.set_ylabel("Y Label")
ax.set_title("Set Broken Lines Propertye", pad=10)

scale_axes(ax,
    x_interval=[(2, 3, 0.5)],
    y_interval=[(-1, 0, 0.5)],
    mode='log')
broken_lines = broken_and_clip_axes(ax, x=[300], y=[0.3],
    axes_clip=True, which='both', gap=6, dx=4, dy=4)

bottom_left, bottom_right = broken_lines["bottom"][0]
bottom_left.set(color='r', linewidth=1)
bottom_right.set(color='g', linewidth=1)

left_bottom, left_top = broken_lines["left"][0]
left_bottom.set(color='r', linewidth=2.5)
left_top.set(color='g', linewidth=2.5)

plt.show()
6. Not Clip Line
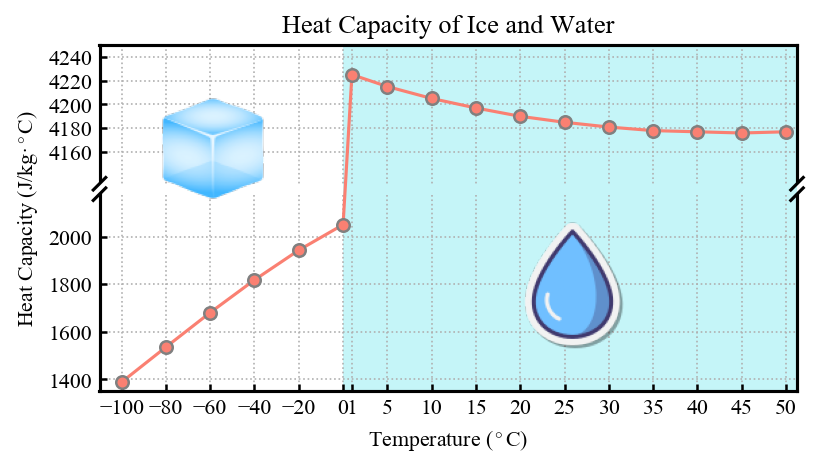
Code to see the example: heat_capacity_of_ice_and_water.ipynb
Notes
- Fix axis ranges first: Before calling the break/clip functions, you must fix the axis ranges using
ax.set_xlim()orax.set_ylim()— this is crucial to ensure accurate calculation of break positions. - Interval rules: When using
scale_axes, intervals must be non-overlapping and in order (e.g.,[(0,2,2), (5,10,1)]is valid,[(5,10,1), (0,2,2)]is invalid). - Clipping exclusions: Text elements (such as labels, tick values) and the axis background (
ax.patch) will not be clipped to avoid affecting readability. Users can also useget_axes_clip_pathto obtain the axis clipping path and manually add artists that need to be clipped with reference to theclip_axesfunction.
Version and Author
- Version: 0.5.0
- Author: Wu Yao wuyao1997@qq.com
Release history Release notifications | RSS feed


Download files
Download the file for your platform. If you're not sure which to choose, learn more about installing packages.
Source Distribution
Built Distribution
Filter files by name, interpreter, ABI, and platform.
If you're not sure about the file name format, learn more about wheel file names.
Copy a direct link to the current filters
File details
Details for the file break_axes-0.5.0.tar.gz.
File metadata
- Download URL: break_axes-0.5.0.tar.gz
- Upload date:
- Size: 16.0 kB
- Tags: Source
- Uploaded using Trusted Publishing? No
- Uploaded via: twine/6.1.0 CPython/3.13.3
File hashes
| Algorithm | Hash digest | |
|---|---|---|
| SHA256 |
6adfd2a8a412bc6ac121e2ddff06b13841d88d251a8b6b3a3afb1b3440dc862f
|
|
| MD5 |
6cac7e0e005126a063871434c8d7387f
|
|
| BLAKE2b-256 |
a2e91452f8cc18eaa6f46de4959252c84bd8588926670572d58b80d060b3f001
|
File details
Details for the file break_axes-0.5.0-py3-none-any.whl.
File metadata
- Download URL: break_axes-0.5.0-py3-none-any.whl
- Upload date:
- Size: 13.1 kB
- Tags: Python 3
- Uploaded using Trusted Publishing? No
- Uploaded via: twine/6.1.0 CPython/3.13.3
File hashes
| Algorithm | Hash digest | |
|---|---|---|
| SHA256 |
8343ee762ac87da739a0c5231a25b4dd9117314e1dbbd8dbf25be4931f42e049
|
|
| MD5 |
5031491038986c0047c281f090f30523
|
|
| BLAKE2b-256 |
416d2f2982e35646fd1e18849cfb42a9c61b1584229456508a574efe483c40a4
|


