
brokenaxes

brokenaxes makes matplotlib plots with breaks in the axes for showing data across a discontinuous range.



Features
- Break x and y axes.
- Supports multiple breaks on a single axis.
- Automatically scales axes according to relative ranges.
- Plot multiple lines.
- Legend with positioning relative to entire broken axes object
- x and y label centered to entire plot
- Make brokenaxes object a subplot itself with
matplotlib.GridSpec.subplot_spec. - xlims and ylims may be
datetime.datetimeobjects - Supports log scales.
Installation
I recommend the Anaconda python distribution and this package is available via pypi:
pip install brokenaxes
Usage
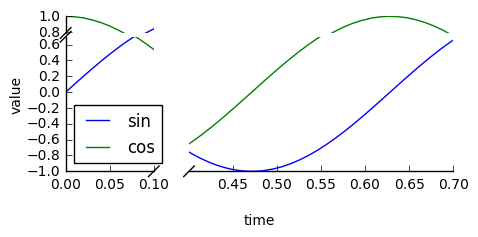
import matplotlib.pyplot as plt
from brokenaxes import brokenaxes
import numpy as np

fig = plt.figure(figsize=(5, 2))
bax = brokenaxes(xlims=((0, .1), (.4, .7)), ylims=((-1, .7), (.79, 1)), hspace=.05)
x = np.linspace(0, 1, 100)
bax.plot(x, np.sin(10 * x), label='sin')
bax.plot(x, np.cos(10 * x), label='cos')
bax.legend(loc=3)
bax.set_xlabel('time')
bax.set_ylabel('value')
Create subplots
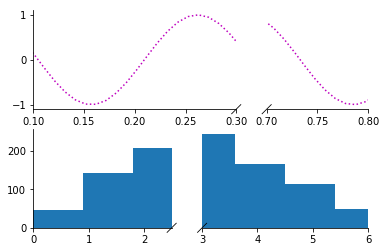
from brokenaxes import brokenaxes
from matplotlib.gridspec import GridSpec
import numpy as np

sps1, sps2 = GridSpec(2,1)

bax = brokenaxes(xlims=((.1, .3), (.7, .8)), subplot_spec=sps1)
x = np.linspace(0, 1, 100)
bax.plot(x, np.sin(x*30), ls=':', color='m')

x = np.random.poisson(3, 1000)
bax = brokenaxes(xlims=((0, 2.5), (3, 6)), subplot_spec=sps2)
bax.hist(x, histtype='bar')
Log scales
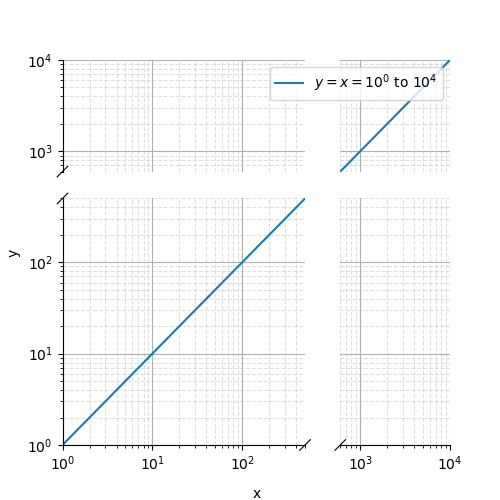
import matplotlib.pyplot as plt
from brokenaxes import brokenaxes
import numpy as np

fig = plt.figure(figsize=(5, 5))
bax = brokenaxes(
    xlims=((1, 500), (600, 10000)),
    ylims=((1, 500), (600, 10000)),
    hspace=.15,
    xscale='log',
    yscale='log',
)

x = np.logspace(0.0, 4, 100)
bax.loglog(x, x, label='$y=x=10^{0}$ to $10^{4}$')

bax.legend(loc='best')
bax.grid(axis='both', which='major', ls='-')
bax.grid(axis='both', which='minor', ls='--', alpha=0.4)
bax.set_xlabel('x')
bax.set_ylabel('y')
plt.show()
datetime
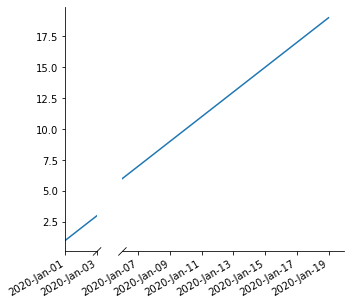
import matplotlib.pyplot as plt
from brokenaxes import brokenaxes
import numpy as np
import datetime

fig = plt.figure(figsize=(5, 5))
xx = [datetime.datetime(2020, 1, x) for x in range(1, 20)]

yy = np.arange(1, 20)

bax = brokenaxes(
    xlims=(
        (
            datetime.datetime(2020, 1, 1),
            datetime.datetime(2020, 1, 3),
        ),
        (
            datetime.datetime(2020, 1, 6),
            datetime.datetime(2020, 1, 20),
        )
    )
)

bax.plot(xx, yy)

fig.autofmt_xdate()
[x.remove() for x in bax.diag_handles]
bax.draw_diags()

import matplotlib.dates as mdates
for ax in bax.axs:
    ax.xaxis.set_major_formatter(mdates.DateFormatter('%Y-%b-%d'))
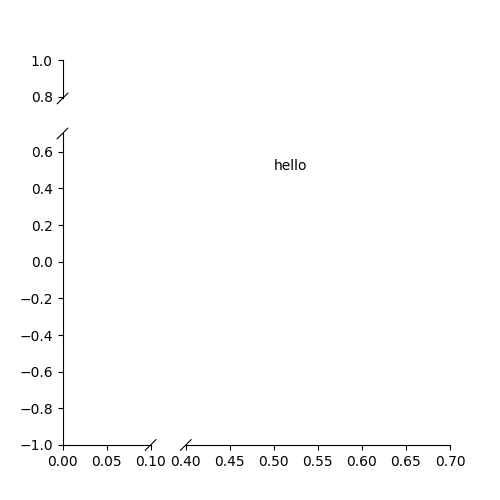
text annotation
import matplotlib.pyplot as plt
from brokenaxes import brokenaxes

fig = plt.figure(figsize=(5, 5))
bax = brokenaxes(
    xlims=((0, 0.1), (0.4, 0.7)), ylims=((-1, 0.7), (0.79, 1))
)
bax.text(0.5, 0.5, "hello")
How do I do more?
You can customize brokenaxes outside of the supported features listed above. Brokenaxes works by creating a number of smaller axes objects, with the positions and sizes of those axes dictated by the data ranges used in the constructor. Those individual axes are stored as a list in bax.axs. Most customizations will require accessing those inner axes objects. (See the last two lines of the datetime example). There is also a larger invisible axes object, bax.big_ax, which spans the entire brokenaxes region and is used for things like x and y axis labels which span all of the smaller axes.
Gallery
If you make a plot with this tool that you are proud of, send me a png and code and I'll add it to the gallery!
Life advice
Please use this tool wisely. Any data visualization techique can be used to elucidate trends in the data, but can also be used to manipulate and mislead. The latter is particularly true for broken axes plots, so please try to use them responsibly. Other than that, this software is free to use. See the license file for details.
Testing
brokenaxes uses pytest-mpl to ensure that the plots are created correctly.
To test that the plots are created correctly, run pytest --mpl --mpl-baseline-path test_baseline test.py from the root directory.
To generate new test plots, run pytest --mpl-generate-path test_baseline test.py from the root directory.
If you are running the tests on a headless server, you may need to set the MPLBACKEND environment variable to Agg.
1 maintainer

Release files for brokenaxes 0.6.2
For a detailed explanation of source distributions (sdists) and built distributions (wheels), please see the package formats documentation.
Source distribution (sdist)
| File | Size | Uploaded | |
|---|---|---|---|
| brokenaxes-0.6.2.tar.gz | 9.8 kB | Details |
Built distribution (wheel)
| File | Interpreter | ABI | Platform | Reset |
|---|---|---|---|---|
| brokenaxes-0.6.2-py3-none-any.whl | Python 3 | none | any | Details |
Total release size: 17.1 kB
Release files / brokenaxes-0.6.2.tar.gz
| Download URL | brokenaxes-0.6.2.tar.gz |
|---|---|
| Size | 9.8 kB |
| Tags | Source |
|
SHA-256 checksum How to use checksums |
bfa68242f003c02fe57ce7b5c5671c78c733ac8cc51a2be0f3ee6906c18e5d49
|
|
BLAKE2b-256 checksum How to use checksums |
fe243b8232880f8413f5e85bab6ecb5440418f071fdcbdc7090d858ee36026bb
|
| Upload date | |
|
Uploaded using Trusted Publishing? What is trusted publishing? |
Yes |
| Uploaded via |
twine/5.1.1 CPython/3.12.6
|
Release files / brokenaxes-0.6.2-py3-none-any.whl
| Download URL | brokenaxes-0.6.2-py3-none-any.whl |
|---|---|
| Size | 7.3 kB |
| Tags | Python 3 |
|
SHA-256 checksum How to use checksums |
bc0a269c4a9a9a643504fbb7d734a279629cc2cada5ee90c57645e75c89f38ad
|
|
BLAKE2b-256 checksum How to use checksums |
987616158f60d2305cae16c07e25e9d7c5912c346071e2440fe6fe231982e0d9
|
| Upload date | |
|
Uploaded using Trusted Publishing? What is trusted publishing? |
Yes |
| Uploaded via |
twine/5.1.1 CPython/3.12.6
|














