Data science tools

Project description
BTG DATA SCIENCE LAB
This package provides tools for data science
Installation
You can install the python package using this command line:
pip install btgPy
Creating a CHAID Tree
from btgPy import btgLab
import numpy as np
import pandas as pd

## create the data
ndarr = np.array(([1, 2, 3] * 5) + ([2, 2, 3] * 5)).reshape(10, 3)
df = pd.DataFrame(ndarr)
df.columns = ['a', 'b', 'c']
arr = np.array(([1] * 5) + ([2] * 5))
df['d'] = arr

>>> df
   a  b  c  d
0  1  2  3  1
1  1  2  3  1
2  1  2  3  1
3  1  2  3  1
4  1  2  3  1
5  2  2  3  2
6  2  2  3  2
7  2  2  3  2
8  2  2  3  2
9  2  2  3  2
lab = btgLab()
lab.readDataFrame(df,4*['nominal'])
indep_variables = ['a','b','c']
alpha_merge = 0.05
max_depth = 2
min_parent_node_size = 30
min_child_node_size = 0
#This will save a .csv with the dummi variables of the node
save_dataset = True
#This will save a file with the image of the tree
render = True

tree = lab.chaid(indep_variables,'d',alpha_merge,max_depth,min_parent_node_size,min_child_node_size,save_dataset,render)
>>> tree.print_tree()
([], {1: 5, 2: 5}, ('a', p=0.001565402258, score=10.0, groups=[[1], [2]]), dof=1))
├── ([1], {1: 5, 2: 0}, <Invalid Chaid Split>)
└── ([2], {1: 0, 2: 5}, <Invalid Chaid Split>)
You can also read the data from a csv file:
from btgPy import btgLab

lab.read("demo.csv")
indep_variables = ['a','b','c']
alpha_merge = 0.05
max_depth = 2
min_parent_node_size = 30
min_child_node_size = 0
#This will save a .csv with the dummi variables of the node
save_dataset = True
#This will save a file with the image of the tree
render = True

tree = lab.chaid(indep_variables,'d',alpha_merge,max_depth,min_parent_node_size,min_child_node_size,save_dataset,render)
>>> tree.print_tree()
([], {1: 5, 2: 5}, ('a', p=0.001565402258, score=10.0, groups=[[1], [2]]), dof=1))
├── ([1], {1: 5, 2: 0}, <Invalid Chaid Split>)
└── ([2], {1: 0, 2: 5}, <Invalid Chaid Split>)
Csv (demo.csv) file must have this structure: (types,titles,values)
nominal,nominal,nominal,nominal
a,b,c,d
1,2,3,1
1,2,3,1
1,2,3,1
1,2,3,1
1,2,3,1
2,2,3,2
2,2,3,2
2,2,3,2
2,2,3,2
2,2,3,2
This is the inner code of the CHAID Tree and how to use it:
from btgPy.CHAID import Tree

## create the data
ndarr = np.array(([1, 2, 3] * 5) + ([2, 2, 3] * 5)).reshape(10, 3)
df = pd.DataFrame(ndarr)
df.columns = ['a', 'b', 'c']
arr = np.array(([1] * 5) + ([2] * 5))
df['d'] = arr

>>> df
   a  b  c  d
0  1  2  3  1
1  1  2  3  1
2  1  2  3  1
3  1  2  3  1
4  1  2  3  1
5  2  2  3  2
6  2  2  3  2
7  2  2  3  2
8  2  2  3  2
9  2  2  3  2

## set the CHAID input parameters
independent_variable_columns = ['a', 'b', 'c']
dep_variable = 'd'

## create the Tree via pandas
tree = Tree.from_pandas_df(df, dict(zip(independent_variable_columns, ['nominal'] * 3)), dep_variable)
## create the same tree, but without pandas helper
tree = Tree.from_numpy(ndarr, arr, split_titles=['a', 'b', 'c'], min_child_node_size=5)
## create the same tree using the tree constructor
cols = [
  NominalColumn(ndarr[:,0], name='a')
  NominalColumn(ndarr[:,1], name='b')
  NominalColumn(ndarr[:,2], name='c')
]
tree = Tree(cols, NominalColumn(arr, name='d'), {'min_child_node_size': 5})

>>> tree.print_tree()
([], {1: 5, 2: 5}, ('a', p=0.001565402258, score=10.0, groups=[[1], [2]]), dof=1))
├── ([1], {1: 5, 2: 0}, <Invalid Chaid Split>)
└── ([2], {1: 0, 2: 5}, <Invalid Chaid Split>)

## to get a LibTree object,
>>> tree.to_tree()
<treelib.tree.Tree object at 0x114e2e350>

## the different nodes of the tree can be accessed like
first_node = tree.tree_store[0]

>>> first_node
([], {1: 5, 2: 5}, ('a', p=0.001565402258, score=10.0, groups=[[1], [2]]), dof=1))

## the properties of the node can be access like
>>> first_node.members
{1: 5, 2: 5}

## the properties of split can be accessed like
>>> first_node.split.p
0.001565402258002549
>>> first_node.split.score
10.0
Creating a Tree using Bartlett's or Levene's Significance Test for Continuous Variables
When the dependent variable is continuous, the chi-squared test does not work due to very low frequencies of values across subgroups. As a consequence, and because the F-test is very susceptible to deviations from normality, the normality of the dependent set is determined and Bartlett's test for significance is used when the data is normally distributed (although the subgroups may not necessarily be so) or Levene's test is used when the data is non-normal.
from btgPy.CHAID import Tree

## create the data
ndarr = np.array(([1, 2, 3] * 5) + ([2, 2, 3] * 5)).reshape(10, 3)
df = pd.DataFrame(ndarr)
df.columns = ['a', 'b', 'c']
df['d'] = np.random.normal(300, 100, 10)
independent_variable_columns = ['a', 'b', 'c']
dep_variable = 'd'

>>> df
   a  b  c           d
0  1  2  3  262.816747
1  1  2  3  240.139085
2  1  2  3  204.224083
3  1  2  3  231.024752
4  1  2  3  263.176338
5  2  2  3  440.371621
6  2  2  3  221.762452
7  2  2  3  197.290268
8  2  2  3  275.925549
9  2  2  3  238.471850

## create the Tree via pandas
tree = Tree.from_pandas_df(df, dict(zip(independent_variable_columns, ['nominal'] * 3)), dep_variable, dep_variable_type='continuous')

## print the tree (though not enough power to split)
>>> tree.print_tree()
([], {'s.t.d': 86.562258585515579, 'mean': 297.52027436303212}, <Invalid Chaid Split>)
Parameters
df: Pandas DataFramei_variables: Dict<string, string>: Independent variable column names as keys and the type as the values (nominal or ordinal)d_variable: String: Dependent variable column nameopts: {}:alpha_merge: Float (default = 0.05): If the respective test for a given pair of predictor categories is not statistically significant as defined by analpha_mergevalue, the least significant predictor categories are merged and the splitting of the node is attempted with the newly formed categoriesmax_depth: Integer (default = 2): The maximum depth of the treemin_parent_node_size: Float (default = 30): The minimum number of respondents required for a split to occur on a particular nodemin_child_node_size: Float (default = 0): If the split of a node results in a child node whose node size is less thanmin_child_node_size, child nodes that have too few cases (as with this minimum) will merge with the most similar child node as measured by the largest of the p-values. However, if the resulting number of child nodes is 1, the node will not be split.split_threshold: Float (default = 0): The split threshold when bucketing root node surrogate splitsweight: String (default = None): The name of the weight columndep_variable_type (default = categorical, other_options = continuous): Whether the dependent variable is 'categorical' or 'continuous' Running from the Command Line
You can play around with the repo by cloning and running this from the command line:
python -m btgPy.CHAID tests/data/titanic.csv survived sex embarked --max-depth 4 --min-parent-node-size 2 --alpha-merge 0.05
It calls the print_tree() method, which prints the tree to terminal:
([], {0: 809, 1: 500}, (sex, p=1.47145310169e-81, chi=365.886947811, groups=[['female'], ['male']]))
├── (['female'], {0: 127, 1: 339}, (embarked, p=9.17624191599e-07, chi=24.0936494474, groups=[['C', '<missing>'], ['Q', 'S']]))
│   ├── (['C', '<missing>'], {0: 11, 1: 104}, <Invalid Chaid Split>)
│   └── (['Q', 'S'], {0: 116, 1: 235}, <Invalid Chaid Split>)
└── (['male'], {0: 682, 1: 161}, (embarked, p=5.017855245e-05, chi=16.4413525404, groups=[['C'], ['Q', 'S']]))
    ├── (['C'], {0: 109, 1: 48}, <Invalid Chaid Split>)
    └── (['Q', 'S'], {0: 573, 1: 113}, <Invalid Chaid Split>)
or to test the continuous dependent variable case:
python -m CHAID tests/data/titanic.csv fare sex embarked --max-depth 4 --min-parent-node-size 2 --alpha-merge 0.05 --dependent-variable-type continuous
([], {'s.t.d': 51.727293077231302, 'mean': 33.270043468296414}, (embarked, p=8.46027456424e-24, score=55.3476155546, groups=[['C'], ['Q', '<missing>'], ['S']]), dof=1308))
├── (['C'], {'s.t.d': 84.029951444532529, 'mean': 62.336267407407405}, (sex, p=0.0293299541476, score=4.7994643184, groups=[['female'], ['male']]), dof=269))
│   ├── (['female'], {'s.t.d': 90.687664523113241, 'mean': 81.12853982300885}, <Invalid Chaid Split>)
│   └── (['male'], {'s.t.d': 76.07029674707077, 'mean': 48.810619108280257}, <Invalid Chaid Split>)
├── (['Q', '<missing>'], {'s.t.d': 15.902095006812658, 'mean': 13.490467999999998}, <Invalid Chaid Split>)
└── (['S'], {'s.t.d': 37.066877311088625, 'mean': 27.388825164113786}, (sex, p=3.43875930713e-07, score=26.3745361415, groups=[['female'], ['male']]), dof=913))
    ├── (['female'], {'s.t.d': 48.971933059814894, 'mean': 39.339305154639177}, <Invalid Chaid Split>)
    └── (['male'], {'s.t.d': 28.242580058030033, 'mean': 21.806819261637241}, <Invalid Chaid Split>)
Note that the frequency of the dependent variable is replaced with the standard deviation and mean of the continuous set at each node and that any NaNs in the dependent set are automatically converted to 0.0.
Generating Splitting Rules
Append --rules to the cli or call tree.classification_rules(node) (either pass in the node or if node is None then it will return all splitting rules)
python -m btgPy.CHAID tests/data/titanic.csv fare sex embarked --max-depth 4 --min-parent-node-size 2 --alpha-merge 0.05 --dependent-variable-type continuous --rules
{'node': 2, 'rules': [{'variable': 'sex', 'data': ['female']}, {'variable': 'embarked', 'data': ['C']}]}
{'node': 3, 'rules': [{'variable': 'sex', 'data': ['male']}, {'variable': 'embarked', 'data': ['C']}]}
{'node': 4, 'rules': [{'variable': 'embarked', 'data': ['Q', '<missing>']}]}
{'node': 6, 'rules': [{'variable': 'sex', 'data': ['female']}, {'variable': 'embarked', 'data': ['S']}]}
{'node': 7, 'rules': [{'variable': 'sex', 'data': ['male']}, {'variable': 'embarked', 'data': ['S']}]}
Parameters
Run python -m btgPy.CHAID -h to see description of command line arguments
How to Read the Tree
We'll start with a real world example using the titanic dataset.
First make sure to install all required packages:
python setup.py install && pip install ipdb
Run:
python -m btgPy.CHAID tests/data/titanic.csv survived sex embarked --max-depth 4 --min-parent-node-size 2 --alpha-merge 0.05
after placing an ipdb statement on like 55 on __main__.py as in the example below. The parameters mean max depth two 4 levels, a minimum parent node size threshold to 2 and merge the groups if the p-value is greater than 0.05 when comparing the groups.
82        tree = Tree.from_pandas_df(data, independent_variables,
83                                   nspace.dependent_variable[0],
84                                   variable_types=types, **config)
---> 85   import ipdb; ipdb.set_trace()
86
87        if nspace.classify:
88            predictions = pd.Series(tree.node_predictions())
89            predictions.name = 'node_id'
90            data = pd.concat([data, predictions], axis=1)
91            print(data.to_csv())
92        elif nspace.predict:
Running tree.print_tree() gives:
([], {0: 809, 1: 500}, (sex, p=1.47145310169e-81, score=365.886947811, groups=[['female'], ['male']]), dof=1))
├── (['female'], {0: 127, 1: 339}, (embarked, p=9.17624191599e-07, score=24.0936494474, groups=[['C', '<missing>'], ['Q', 'S']]), dof=1))
│   ├── (['C', '<missing>'], {0: 11, 1: 104}, <Invalid Chaid Split>)
│   └── (['Q', 'S'], {0: 116, 1: 235}, <Invalid Chaid Split>)
└── (['male'], {0: 682, 1: 161}, (embarked, p=5.017855245e-05, score=16.4413525404, groups=[['C'], ['Q', 'S']]), dof=1))
    ├── (['C'], {0: 109, 1: 48}, <Invalid Chaid Split>)
    └── (['Q', 'S'], {0: 573, 1: 113}, <Invalid Chaid Split>)
as show above. The first line is the root node, all the data is present in this node. The the vertical bars originating from a node represents paths to that node's children.
Running tree.tree_store will give you a list of all the nodes in the tree:
[
  ([], {0: 809, 1: 500}, (sex, p=1.47145310169e-81, score=365.886947811, groups=[['female'], ['male']]), dof=1)),
  (['female'], {0: 127, 1: 339}, (embarked, p=9.17624191599e-07, score=24.0936494474, groups=[['C', '<missing>'], ['Q', 'S']]), dof=1)),
  (['C', '<missing>'], {0: 11, 1: 104}, <Invalid Chaid Split>), (['Q', 'S'], {0: 116, 1: 235}, <Invalid Chaid Split>),
  (['male'], {0: 682, 1: 161}, (embarked, p=5.017855245e-05, score=16.4413525404, groups=[['C'], ['Q', 'S']]), dof=1)),
  (['C'], {0: 109, 1: 48}, <Invalid Chaid Split>), (['Q', 'S'], {0: 573, 1: 113}, <Invalid Chaid Split>)
]
So let's inspect the root node tree.tree_store[0]:
([], {0: 809, 1: 500}, (sex, p=1.47145310169e-81, score=365.886947811, groups=[['female'], ['male']]), dof=1))
Nodes have certain properties. Firstly, they show the column that was chosen to split to this node (for a root node the column is empty '([])'). The second property {0: 809, 1: 500} show the members of that node, and represent the current frequency of the dependent variable. In this case, it is all the answers in the 'survived' column, as that was the first column past to the program in the command line (python -m CHAID tests/data/titanic.csv survived). The next property represents the splitting of the node. What column was chosen to make that split (in this case, sex), the p-value of the split and the chi-score and most importantly, which variables in sex create the new nodes and the degrees of freedom associated with that split (1, in this case)
These properties that can be accessed:
ipdb> root_node = tree.tree_store[0]
ipdb> root_node.choices
[]
ipdb> root_node.members
{0: 809, 1: 500}
ipdb> root_node.split
(sex, p=1.47145310169e-81, score=365.886947811, groups=[['female'], ['male']]), dof=1)
The split variable can be further inspected:
ipdb> split = root_node.split
ipdb> split.column
'sex'
ipdb> split.p
1.4714531016922664e-81
ipdb> split.score
365.88694781112048
ipdb> split.dof
1
ipdb> split.groupings
"[['female'], ['male']]"
Therefore, in this example, the root node is split on the column 'sex' in the data, splitting up the females and males. These females and males each form a new node and further down, the all male and all female nodes are split on the column 'embarked' (although they needn't split on the same column). A <Invalid Chaid Split> is reached when either the node is pure (only one dependent variable remains) or when a terminating parameter is met (e.g. min node size, or max depth [see tree parameters above])
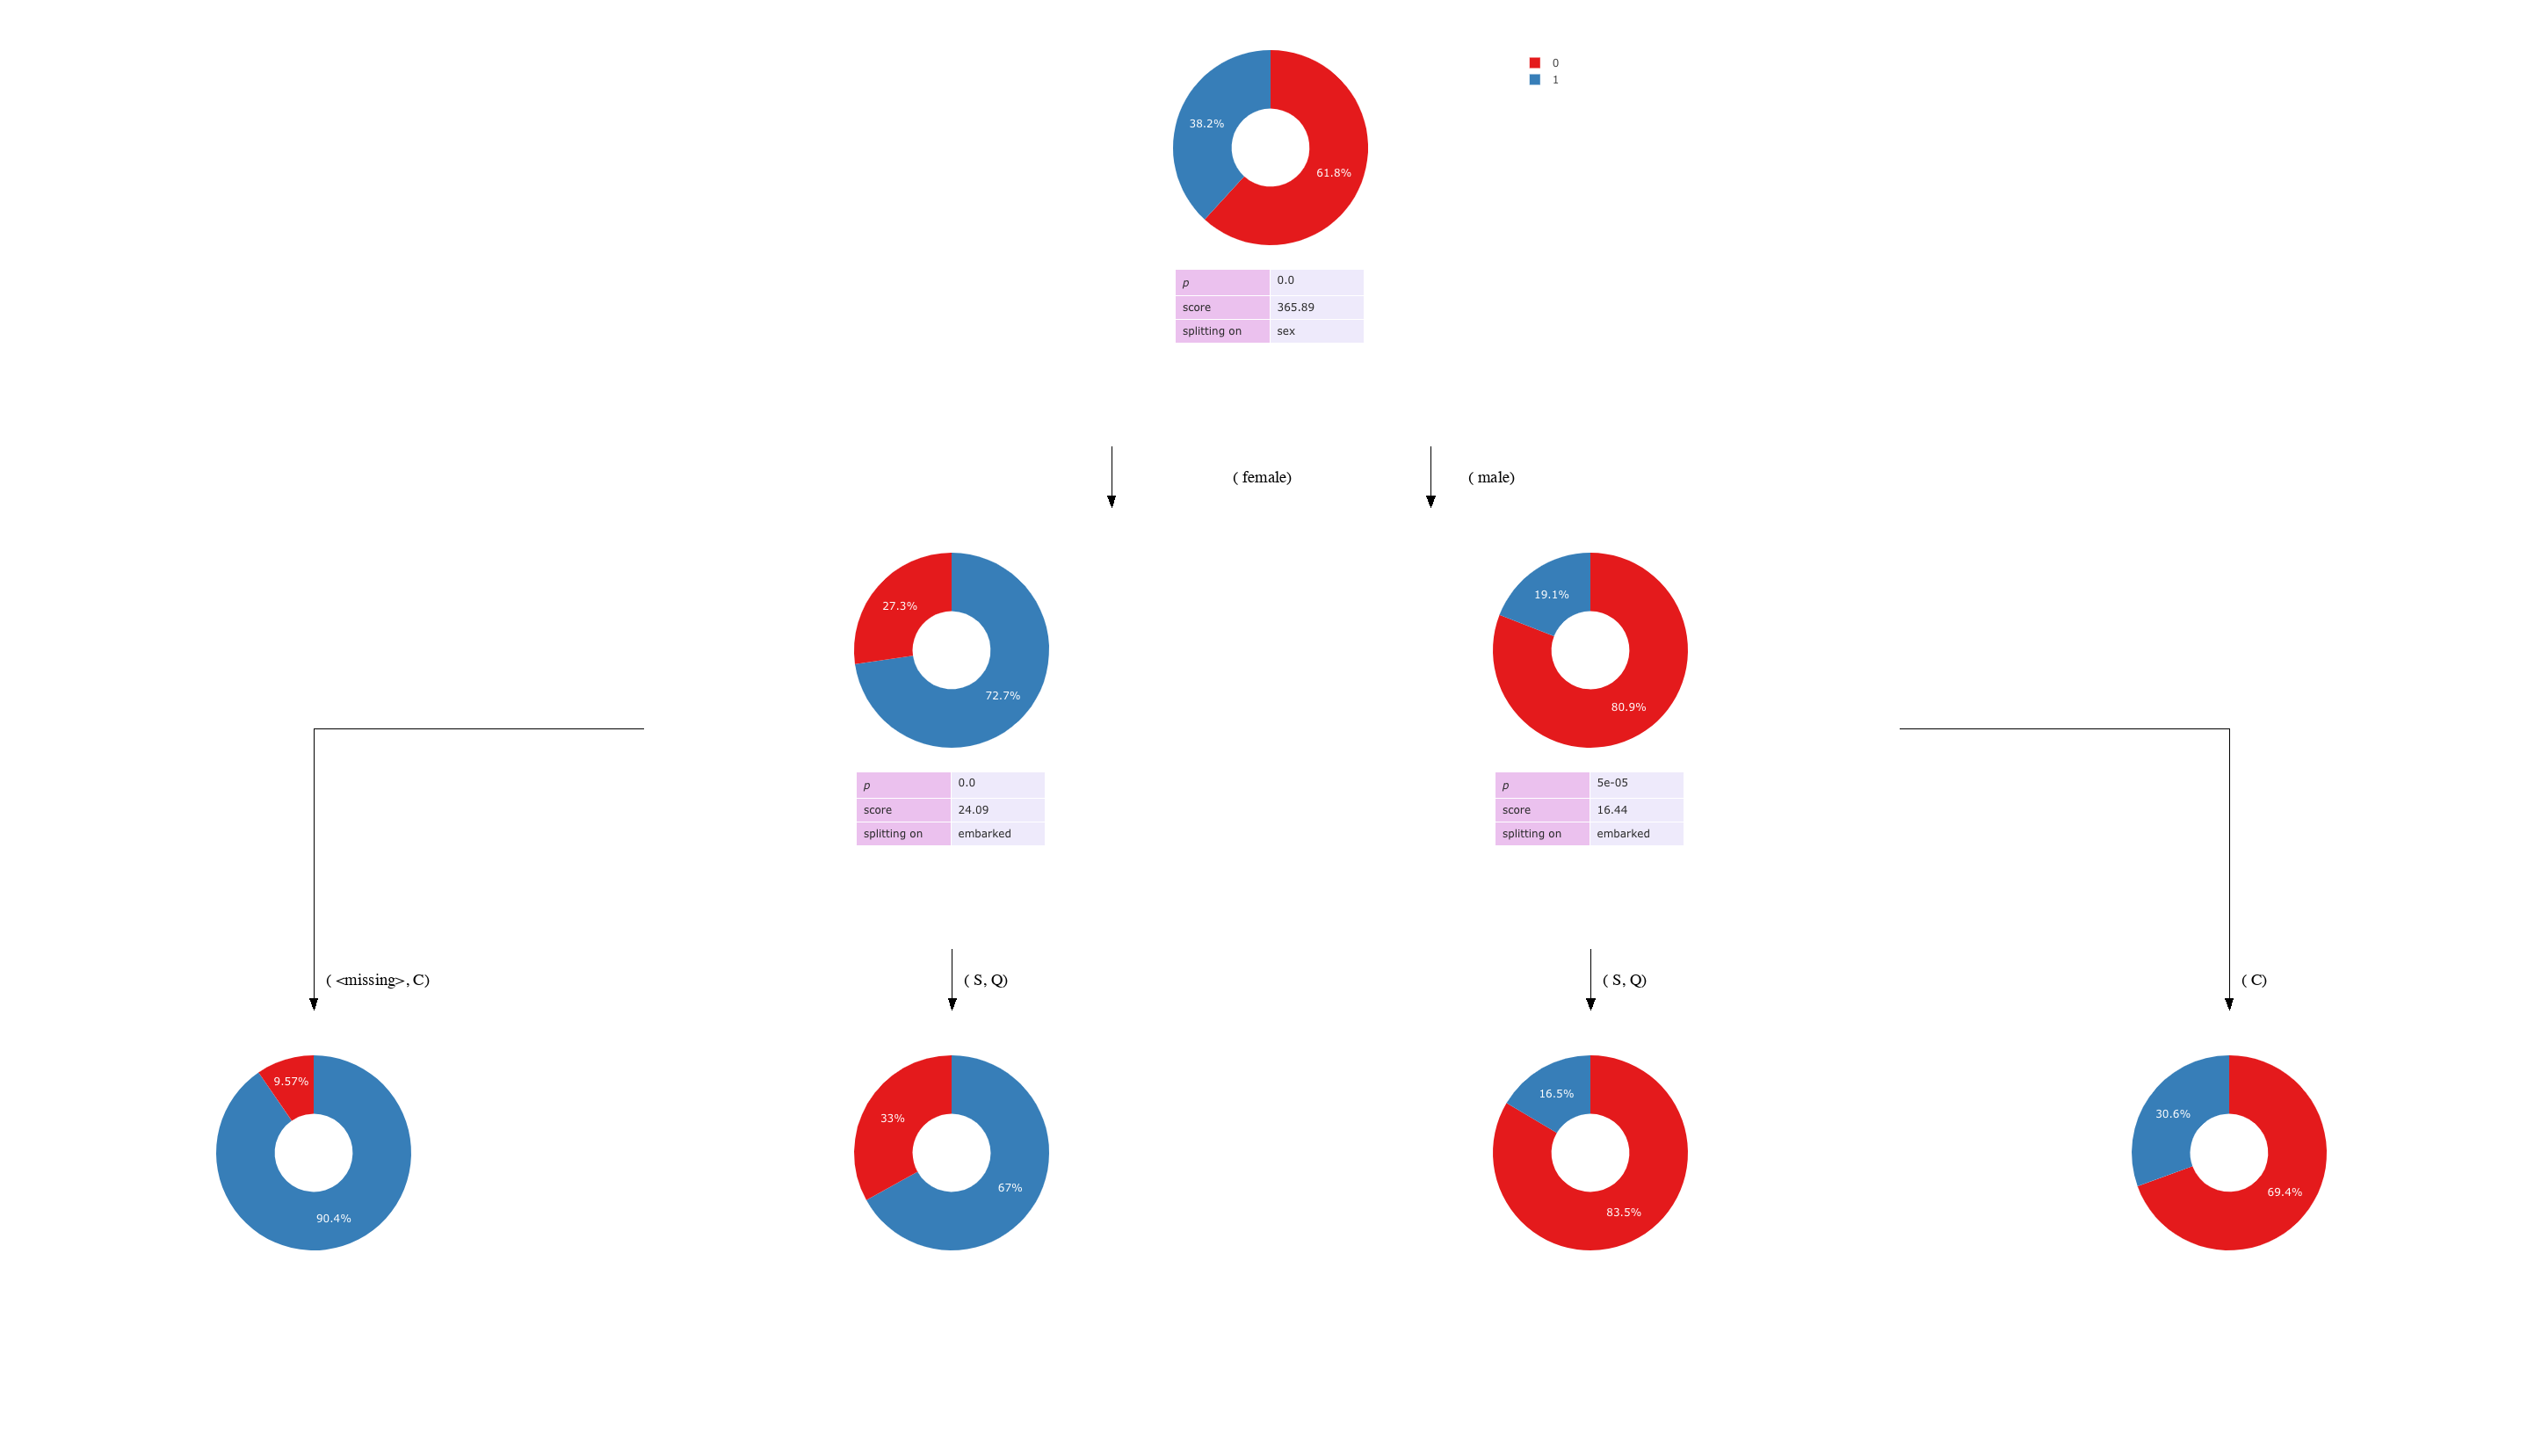
The conclusion drawn from this tree is that: "Gender was the most important factor driving the survival of people on the titanic. Whereby females had a much higher likelihood of surviving (survival = 1 in the survival column and 0 means they died). Of those females, those who embarked first class (class 'C', node 2) had a much higher likelihood of surviving."
Exporting the tree
If you want to export the tree to a dot file, then use:
tree.to_tree()
This creates a treelib which has a .to_graphviz() method here.
In order to use visually graph the CHAID tree, you'll need to install two more libraries that aren't distributed via pypi:
- graphviz - see here for platform specific installations
- orca - see the README.md for platform specific installations
You can export the tree to .gv and png using:
tree.render(path=None, view=False)
Which will save it to a file specified at path and can be instantly viewed when view=True.
This can also be triggered from the command line using --export or --export-path. The former causes it to be stored in a newly created trees folder and the latter specifies the location of the file. Both will trigger an auto-viewing of the tree. E.g:
python -m btgPy.CHAID tests/data/titanic.csv survived sex embarked --max-depth 4 --min-parent-node-size 2 --alpha-merge 0.05 --export
python -m btgPy.CHAID tests/data/titanic.csv survived sex embarked --max-depth 4 --min-parent-node-size 2 --alpha-merge 0.05 --export-path YOUR_PATH.gv
The output will look like:
gem install github_changelog_generator && github_changelog_generator --exclude-labels maintenance,refactor,testing


Download files
Download the file for your platform. If you're not sure which to choose, learn more about installing packages.
Source Distribution
Built Distribution
Filter files by name, interpreter, ABI, and platform.
If you're not sure about the file name format, learn more about wheel file names.
Copy a direct link to the current filters
File details
Details for the file btgPy-1.0.2.tar.gz.
File metadata
- Download URL: btgPy-1.0.2.tar.gz
- Upload date:
- Size: 29.6 kB
- Tags: Source
- Uploaded using Trusted Publishing? No
- Uploaded via: twine/3.2.0 pkginfo/1.5.0.1 requests/2.24.0 setuptools/49.6.0 requests-toolbelt/0.9.1 tqdm/4.47.0 CPython/3.7.4
File hashes
| Algorithm | Hash digest | |
|---|---|---|
| SHA256 |
8fb3b6742981c6d75e936f7ba53bb2cbe5de4370111ac2a89d7e7149dfcf8d14
|
|
| MD5 |
1dec9a7afdf7390048346abbadb4a9e0
|
|
| BLAKE2b-256 |
1df3be5777c7c1202b8e399fe3bb7cd7cd554b89f9c1124dc5005b7c77c13ff1
|
File details
Details for the file btgPy-1.0.2-py3-none-any.whl.
File metadata
- Download URL: btgPy-1.0.2-py3-none-any.whl
- Upload date:
- Size: 43.9 kB
- Tags: Python 3
- Uploaded using Trusted Publishing? No
- Uploaded via: twine/3.2.0 pkginfo/1.5.0.1 requests/2.24.0 setuptools/49.6.0 requests-toolbelt/0.9.1 tqdm/4.47.0 CPython/3.7.4
File hashes
| Algorithm | Hash digest | |
|---|---|---|
| SHA256 |
e6322c1eb4f2935856aa1ed66846dfb0414b87d0650d01fbe24a6e190d7ac806
|
|
| MD5 |
f3b266ed8e2053fdfc01d5aaae3595da
|
|
| BLAKE2b-256 |
14ffbd676cac13493da3c1d0c1ccb4e7ad8d0683d24462285fc6583ece2cf498
|


