
Clustering 4 Fairness


Discover where a model's errors fall unevenly. c4fairness clusters the rows of a
model's test set and reports how prediction-error disparities and sensitive-attribute
composition vary across the discovered clusters — surfacing under-served subgroups
without pre-specifying the protected group. Works for binary, multi-class, and
regression tasks.
Made at Vrije Universiteit Amsterdam (VU), in collaboration with the University of Twente (UT).
Install
pip install c4fairness              # from PyPI
pip install "c4fairness[web]"       # + the Gradio web UI
pip install "c4fairness[r]"         # + rpy2
Or from a local checkout (editable, for development):
pip install -e .
The import name is c4fairness; the CLI command is c4fairness (equivalently
python -m c4fairness.main).
Quick start
c4fairness --data_path docs/datasets/compas_audit.csv \
    --regular_cols age,priors_count \
    --sensitive_cols sex,race,age --continuous_sensitive_cols age \
    --error_col errors --error_type binary \
    --algorithm kmeans --n_clusters 4 --seed 42
This clusters the test set on age/priors_count (+ the sensitive columns), then writes a
per-cluster recap and heatmap showing each cluster's error rate and its sex/race/age
make-up. String sensitive columns (sex, race) are one-hot encoded automatically.
What the output looks like
Both heatmaps below come from a single experiment-mode run on the bundled COMPAS extract, auditing a recidivism classifier's false-positive rate:
c4fairness --data_path docs/datasets/compas_audit.csv --experiment \
  --regular_cols age,priors_count \
  --sensitive_cols sex,race,age --continuous_sensitive_cols age \
  --y_true_col true_class --y_pred_col predicted_class --binary_error_metric fpr \
  --error_label "FP Rate" --multicat_table_option salient --sensitive_labels "race:Ethnicity" \
  --algorithm kmeans --n_clusters 4 --seed 42
Detailed heatmap — one row per cluster
Condition +REG +SEN -err: clustered on the features and the sensitive attributes, not on
the error itself.
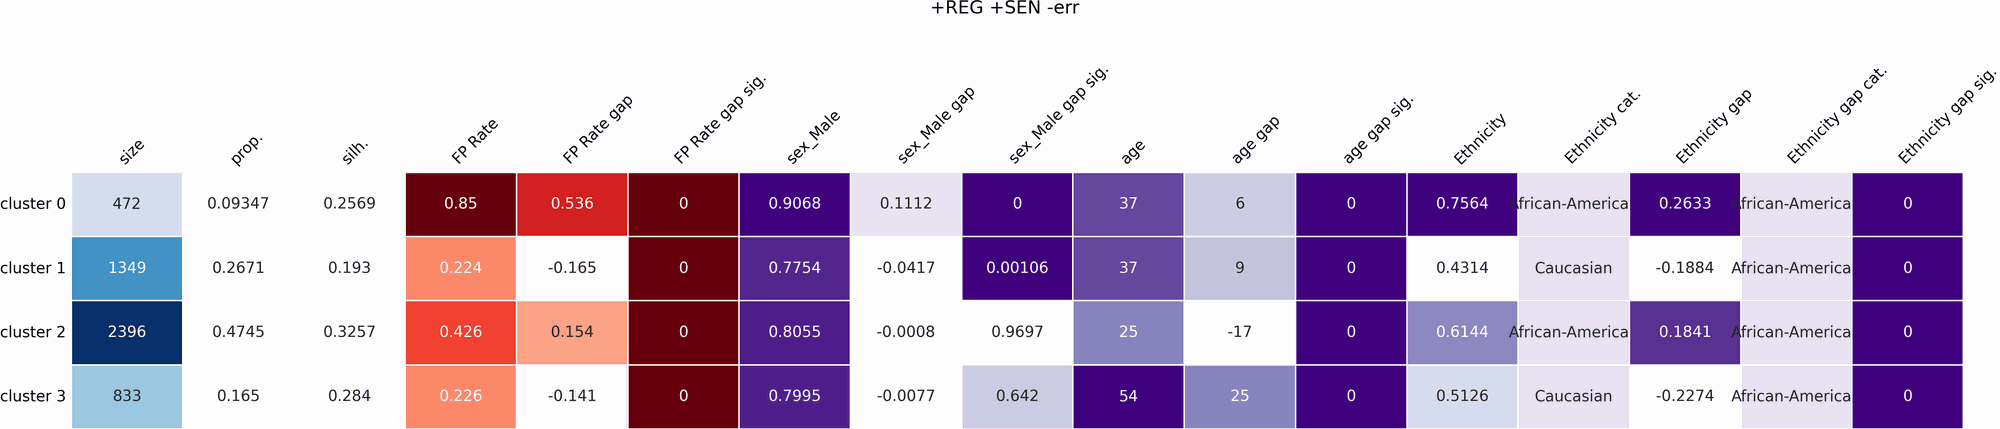
Cluster 0 holds 9.3% of the test set and carries an FP Rate of 0.85 against 0.34 overall — a gap of +0.54 at p ≈ 0. Its sensitive columns say who is in it: 76% African-American, 91% male, median age 37. The other three clusters sit between 0.22 and 0.43. That is a disparity localised to a pocket of the feature space, which a single per-race average would flatten.
Overview heatmap — one row per condition
Experiment mode reruns the audit for every combination of feature groups (REG = regular
features, SEN = sensitive, ERR = the error column), so you can check whether a finding
survives the choice of what to cluster on.
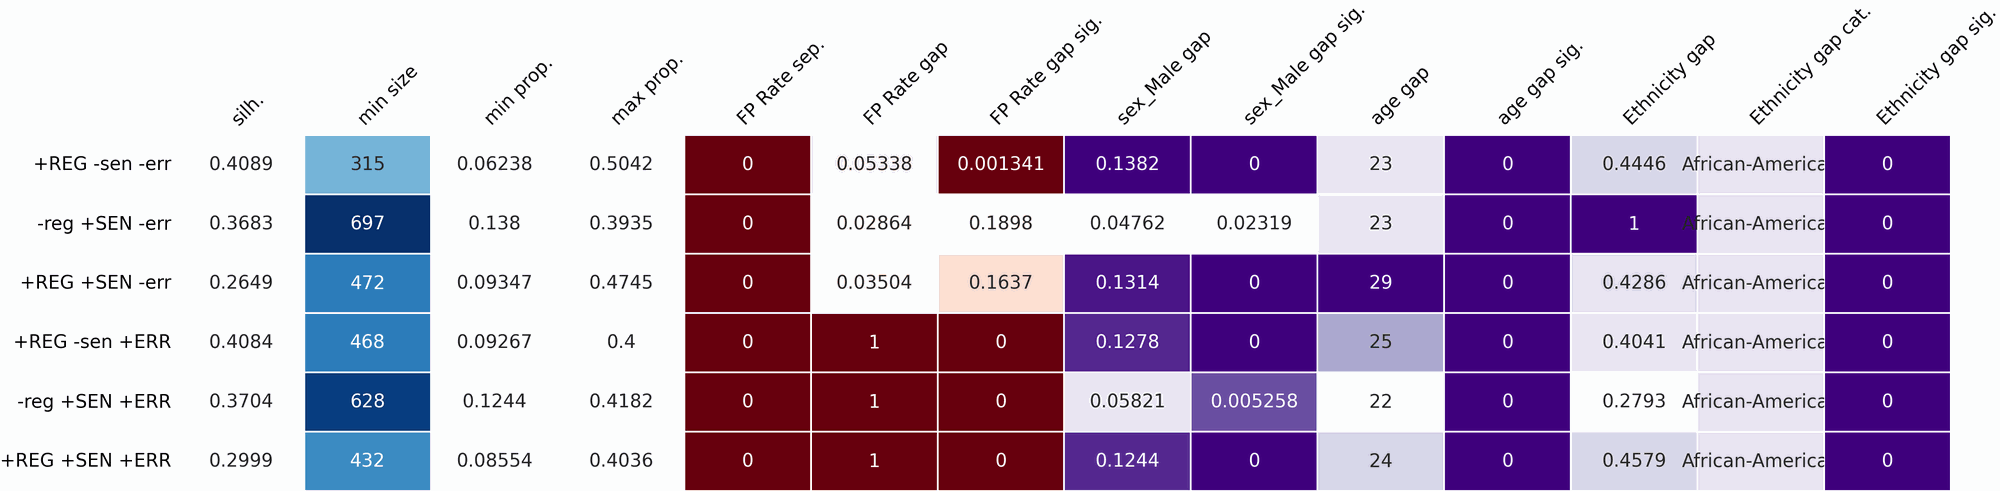
Blue = cluster size, red = error, violet = sensitive composition; p-value columns render
darker the more significant they are. Conditions that include ERR cluster on the error,
so their FP Rate gap of 1.0 is expected, not a finding.
Web UI
A Gradio web app wraps the CLI: upload a CSV, assign column roles, and run from the browser. Results (heatmaps, an overview table, downloadable CSVs) render in tabs, with Home, Documentation, and About pages.
pip install "c4fairness[web]"
c4fairness-web
Then open the printed local URL (default http://localhost:7860). Load example dataset fills the form with the bundled COMPAS extract if you just want to see it work.
Two run modes: Single run (the default) audits the one configuration on the form,
while Full sweep repeats it for every feature-group combination. The sweep is
several times slower. The form exposes every CLI option; algorithm-specific fields
(eps, min_samples, max_iter) appear only for the relevant algorithm, and the run
log streams while the job is running.
Requirements
Python 3.10+. A virtual environment is recommended.
python -m venv venv
source venv/bin/activate        # Windows: venv\Scripts\activate
pip install -e .                # or: pip install c4fairness
R (optional) — exact multi-categorical Fisher
The omnibus significance test for multi-class errors and multi-categorical sensitive
features can use R's fisher.test (exact r×c Fisher–Freeman–Halton) via rpy2. This is
optional: without R, c4fairness falls back to scipy automatically (chi-square with
0-cell handling, or one-vs-all 2×2 Fisher). Install the extra + a system R ≥ 4.5 only if you
need the exact test on sparse tables (--multicat_sig auto/fisher_rxc):
pip install "c4fairness[r]"
On macOS the bundled R framework is often too old and rpy2 picks it up, failing with
symbol 'R_getVar' not found. Install a modern R (brew install r) and point rpy2 at it:
export R_HOME="$(/opt/homebrew/opt/r/bin/R RHOME)"   # Intel: /usr/local/opt/r/bin/R
export RPY2_CFFI_MODE=ABI
Parameters
Run c4fairness --help for the full list. Key options:
Data & feature columns
| Parameter | Description |
|---|---|
--data_path |
Required. Path to input CSV. |
--regular_cols |
Features to cluster on (comma-separated). |
--sensitive_cols |
Protected attributes to audit. Binary, multi-categorical (auto one-hot), or numeric. |
--continuous_sensitive_cols |
Subset of --sensitive_cols to analyse as numbers (median), e.g. age. Otherwise treated as categories. |
--proxy_cols / --special_cols |
Proxies for sensitive attributes / extra features (e.g. SHAP) — clustered but reported separately. |
--categorical_cols |
Force-mark integer-coded columns as categorical (string/object columns are detected automatically). |
Error definition
| Parameter | Description |
|---|---|
--error_type |
binary (default), regression, or multiclass. |
--error_col |
Pre-computed error column: 0/1 for binary, signed float for regression. |
--y_true_col / --y_pred_col |
Derive the error from ground truth + prediction (required for multiclass and for binary rate metrics). |
--binary_error_metric |
Binary error definition for the tables: raw (default, use --error_col), fpr, fnr, precision (=1−Precision), prec_neg. Rate options are derived per cluster from y_true/y_pred. |
--error_multiclass_option |
How to type multi-class errors: per_class (default), accuracy, precision, per_cell (confusion cell), binary_cells, onehot, classwise. |
--error_label |
Display label for the error in tables/heatmaps (e.g. "FP Rate"). |
Sensitive-feature reporting
| Parameter | Description |
|---|---|
--multicat_table_option |
Multi-categorical sensitive display: onehot (default, one column per category) or salient (winning category + value). |
--sensitive_labels |
Display labels for sensitive features in heatmaps, as col:Label,col2:Label2 (display-only; CSVs keep raw names). |
--sensitive_gap_test |
Significance test for <F>_gap_sig: chi2 (default) or fisher. |
Significance
| Parameter | Description |
|---|---|
--multicat_sig |
Omnibus test for multi-class error / multi-categorical *_sep: auto (default; exact r×c Fisher if R present, else scipy), fisher_rxc (force R), chi2, fisher_ova. |
Algorithm
| Parameter | Description |
|---|---|
--algorithm |
kmeans (default), bisectingkmeans, kmedoids, kprototypes, dbscan, hdbscan. |
--distance |
euclidean (default), manhattan, gower (mixed types; required for kmedoids on categoricals). |
--n_clusters |
Fixed k — use this or --n_min/--n_max. |
--n_min / --n_max |
k range for automatic selection. |
--eps |
DBSCAN neighborhood radius. |
--min_samples |
Core-point threshold (DBSCAN / HDBSCAN). |
--max_iter |
Iterations for KMeans / BisectingKMeans / KMedoids. |
--scoring |
k-selection objective: composite (default), silhouette, chi2_error, chi2_sensitive. |
--composite_weights |
Composite scorer weights, e.g. silhouette:0.3,error:0.5,fairness:0.2. |
--feature_weights |
Per-column clustering weights, e.g. age:2.0,income:0.5. Recorded in the output directory name (_w_...). |
--seed / --seeds |
Random seed / comma-separated seeds for multi-seed experiment runs. |
Analysis & output
| Parameter | Description |
|---|---|
--subset |
Restrict to a confusion-matrix subset: TP, TN, FP, FN, TP_TN, FP_FN. |
--min_datapoints |
Drop clusters smaller than this before analysis. |
--separability_check |
Also print feature separability tests to the console. |
--projection |
Scatter-plot projection(s), comma-separated: pca, tsne, mds, none (e.g. pca,tsne emits one plot each). t-SNE uses the same distance as clustering (precomputed Gower, Manhattan, or Euclidean). |
--no_standardize |
Skip StandardScaler on numeric features. |
--no_plots |
Skip all plots. |
--output_dir |
Output directory (default clustering_results/<date>/). |
--experiment |
Run experiment mode over feature-group combinations (REG / SEN / ERR); optionally exclude groups, e.g. --experiment SPECIAL,ERR. |
What the result tables contain
Each run writes a Detailed recap (one row per cluster) and, in experiment mode, an Overview (one row per condition). Columns are coloured by family in the heatmaps — blue = size, red = error, violet = sensitive; p-value columns render darker when more significant.
| Column | Meaning | Significance test |
|---|---|---|
silh |
Silhouette | — |
count / proportion (min_size/min_prop/max_prop in Overview) |
Cluster size / share | — |
error_value (or error_mean, abs_error_mean for regression) |
Cluster error magnitude / rate | — |
error_cat / error_gap_class |
Winning error type (multi-class, salient/Option 3) |
— |
error_gap |
Error gap vs. the rest (detailed, one-vs-all) / max cross-cluster spread (overview) | — |
error_sep |
Omnibus error separability | binary → Fisher; multiclass → --multicat_sig; regression → ANOVA |
error_gap_sig |
Error-gap significance | detailed → one-vs-all Fisher (binary/multiclass) / Mann-Whitney (regression); overview → extreme-pair Fisher / ANOVA |
<F>_value / <F>_cat |
Sensitive value per cluster (positive proportion / median / winning category) | — |
<F>_gap / <F>_gap_cat |
Sensitive gap vs. rest + winning category | — |
<F>_gap_sig |
Sensitive separability | binary/multicat → Chi-square (--sensitive_gap_test, default); numeric → Mann-Whitney / ANOVA |
Multi-class errors and multi-categorical sensitive features can be shown either one-hot
(one column set per class/category) or salient (a single winning-category column) — see
--error_multiclass_option, --multicat_table_option. In experiment mode, per-condition
omnibus *_sep p-values are collected in chi_res.csv and Benjamini-Hochberg corrected
across sensitive features.
Input data notes — one-hot encoding & StandardScaler
The pipeline auto-detects string/object/category columns and one-hot encodes them, keeping
the 0/1 dummies out of StandardScaler. Applying StandardScaler to binary OHE columns
distorts Euclidean distances — rarer categories get scaled to larger values and contribute
more to distances regardless of importance. Skipping it for OHE columns avoids this. See
Cross Validated — bias when one-hot encoding and standardizing.
If your CSV already has externally one-hot-encoded 0/1 columns (integers, so not detected by
dtype), pass them via --categorical_cols so they are excluded from scaling — or use
--no_standardize if all features are already on comparable scales.
kprototypes silhouette
Standard silhouette can't be computed directly for kprototypes (mixed numeric + categorical
distance). The pipeline precomputes the full pairwise distance matrix with the same distance
the algorithm uses (squared Euclidean + Hamming, weighted by the fitted gamma) and passes it
to silhouette_score(metric='precomputed').
Output structure
Single run
clustering_results/<date>/<timestamp>_<dataset>_<algorithm>_<distance>_s<seed>[_w_<weights>]/
  recap/<run_name>.csv          # per-cluster: error_value/gap/gap_sig, <F>_value/gap/gap_sig, silh
  separability/<run_name>.csv   # per-feature separability tests across clusters
  <run_name>.png                # recap heatmap
  clusters_<method>.png         # one scatter per --projection method
  composition_<attr>.png        # cluster composition per sensitive attribute
  metadata.csv
Experiment mode
clustering_results/<date>/<timestamp>_experiment_<dataset>_<algorithm>_<distance>_s<seed>[_w_<weights>]/
  results_summary.csv           # Overview: one row per condition
  <condition>.csv               # per-cluster detailed recap + OVERALL / SEP rows
  <condition>.png               # detailed heatmap
  all_quali_heatmap.png         # Overview heatmap across conditions
  chi_res.csv / chi_res_heatmap.png   # omnibus separability p-values per condition
  exp_condition.csv             # feature set per condition
The _w_<weights> suffix records --feature_weights (feature + weight, e.g.
_w_age2.0_priors_count0.5).
Examples
All four run against the datasets in docs/datasets/.
Binary classification (COMPAS), auditing the false-positive rate:
c4fairness --data_path docs/datasets/compas_audit.csv \
  --regular_cols age,priors_count --sensitive_cols sex,race,age --continuous_sensitive_cols age \
  --y_true_col true_class --y_pred_col predicted_class --binary_error_metric fpr \
  --multicat_table_option salient --algorithm kmeans --n_clusters 4 --seed 42
Experiment mode with automatic k selection:
c4fairness --data_path docs/datasets/compas_audit.csv \
  --regular_cols age,priors_count --sensitive_cols sex,race \
  --error_col errors --error_type binary \
  --algorithm kmeans --n_min 2 --n_max 6 --scoring chi2_error --experiment
Regression (student grades):
c4fairness --data_path docs/datasets/student_grades.csv \
  --regular_cols G1,G2,studytime,absences --sensitive_cols sex_F,Medu,age \
  --continuous_sensitive_cols age --categorical_cols Medu \
  --y_true_col y_true --y_pred_col y_pred --error_type regression \
  --algorithm kmeans --n_clusters 3 --seed 42
Mixed numeric/categorical types with Gower distance:
c4fairness --data_path docs/datasets/student_grades.csv \
  --regular_cols G1,G2,studytime,absences --sensitive_cols sex_F,Medu,age \
  --continuous_sensitive_cols age --categorical_cols Medu,sex_F \
  --y_true_col y_true --y_pred_col y_pred --error_type regression \
  --algorithm hdbscan --distance gower --min_samples 15 --min_datapoints 25 \
  --no_standardize --projection pca --experiment
Worked, narrated notebooks: docs/example_binary.ipynb and
docs/example_regression.ipynb.
Datasets
Bundled
Two extracts ship with the repository, in docs/datasets/. Each row is
one test-set example carrying the features, the ground truth, and a model's prediction, so
they can be audited as-is.
| File | Task | Sensitive attributes | N | Source |
|---|---|---|---|---|
compas_audit.csv |
Classification | sex, race, age |
5050 | ProPublica, Machine Bias (compas-scores-two-years.csv) |
student_grades.csv |
Regression | sex_F, Medu, age |
670 | UCI — Student Performance |
Also evaluated
Not redistributed here — fetch them from the source and add your model's predictions as a column.
| Dataset | Task | Sensitive attributes | N | Source |
|---|---|---|---|---|
| Open University | Classification | gender, region, imd_band, disability, age_band |
32593 | UCI — OULAD |
| German Credit | Classification | Gender, Age, ForeignWorker |
1000 | UCI — Statlog (German Credit Data) |
| Communities & Crime | Regression | racepctblack |
1994 | UCI — Communities and Crime |
The bundled extracts are derived from their sources: columns are subset, and y_pred /
predicted_class come from a model trained for these examples. Both originals carry their
own licence and citation requirements — check the source before redistributing either.
Project structure
Clustering_4_Fairness/
├── c4fairness/               # the package
│   ├── main.py               # CLI entry point (`c4fairness` / python -m c4fairness.main)
│   ├── cli.py                # argument parsing + column-role helpers
│   ├── clustering.py         # cluster(), gower_distance(), ClusteringResult
│   ├── scoring.py            # silhouette / chi2 / kruskal / composite scorers
│   ├── preprocessing.py      # encode_categoricals()
│   ├── fairness_metrics.py   # per-cluster error/sensitive metrics + significance tests
│   ├── experiments.py        # make_recap(), make_chi_tests(), recap_quali_metrics()
│   ├── experiment.py         # run_batch_experiment() (experiment mode)
│   ├── result_viz.py         # result-table heatmaps
│   ├── visualization.py      # scatter/projection + composition plots
│   └── webapp.py             # Gradio web UI (`c4fairness-web`)
├── docs/                     # example notebooks
│   ├── datasets/             # the COMPAS + student extracts the notebooks read
│   └── images/               # heatmaps used in this README
├── tests/
└── pyproject.toml
1 maintainer

Metadata
1 maintainer
Release files for c4fairness 0.1.2
For a detailed explanation of source distributions (sdists) and built distributions (wheels), please see the package formats documentation.
Source distribution (sdist)
| File | Size | Uploaded | |
|---|---|---|---|
| c4fairness-0.1.2.tar.gz | 81.6 kB | Details |
Built distribution (wheel)
| File | Interpreter | ABI | Platform | Reset |
|---|---|---|---|---|
| c4fairness-0.1.2-py3-none-any.whl | Python 3 | none | any | Details |
Total release size: 150.9 kB
Release files / c4fairness-0.1.2.tar.gz
| Download URL | c4fairness-0.1.2.tar.gz |
|---|---|
| Size | 81.6 kB |
| Tags | Source |
|
SHA-256 checksum How to use checksums |
8af505d154533b0f3170b2e8a236c54cece7ad78b77764cd03be772ce9b3c454
|
|
BLAKE2b-256 checksum How to use checksums |
a2e9f62716a40bab45027853ff3bbf9b60ea7af399558c666d8f28a10e95285b
|
| Upload date | |
|
Uploaded using Trusted Publishing? What is trusted publishing? |
Yes |
| Uploaded via |
twine/7.0.0 CPython/3.13.14
|
Provenance
Provenance describes where a file came from. On PyPI, provenance is shared via attestations, which provide a verifiable record of the build or publishing details. View details, limitations and caveats.


PyPI Publish Attestation
PyPI verified that this artifact, at this checksum, originated from the publisher listed below.
Signed by GitHub Actions, verified by PyPI on Aug 17, 2026.
Transparency logRelease files / c4fairness-0.1.2-py3-none-any.whl
| Download URL | c4fairness-0.1.2-py3-none-any.whl |
|---|---|
| Size | 69.2 kB |
| Tags | Python 3 |
|
SHA-256 checksum How to use checksums |
6239a8cc5a62de61602ad19a9bd60ad58d31a875c3078ea5a78e25a234027d74
|
|
BLAKE2b-256 checksum How to use checksums |
a9b8b8921f31467577d092b95757056fcffcff195612ceadbb812b397daa8eac
|
| Upload date | |
|
Uploaded using Trusted Publishing? What is trusted publishing? |
Yes |
| Uploaded via |
twine/7.0.0 CPython/3.13.14
|
Provenance
Provenance describes where a file came from. On PyPI, provenance is shared via attestations, which provide a verifiable record of the build or publishing details. View details, limitations and caveats.
PyPI Publish Attestation
PyPI verified that this artifact, at this checksum, originated from the publisher listed below.
Signed by GitHub Actions, verified by PyPI on Aug 17, 2026.
Transparency log













