
See what your AI coding cost and produced. Caliper reads local logs from Codex, Claude Code, Cursor, and Aider, prices the usage at API rates, and attributes it by project, PR, model, and session. Offline, no account, no upload.

Project description
Caliper
Caliper shows what your AI coding cost and what it produced. It reads the logs already on your disk from Codex CLI, Claude Code, Cursor, and Aider, prices the usage at API rates, and breaks it down by project, PR, model, and session. It runs offline.
No account. No upload. No telemetry.


Run it on built-in sample data, without installing anything:
uvx --isolated --from caliper-ai caliper dashboard --demo --open
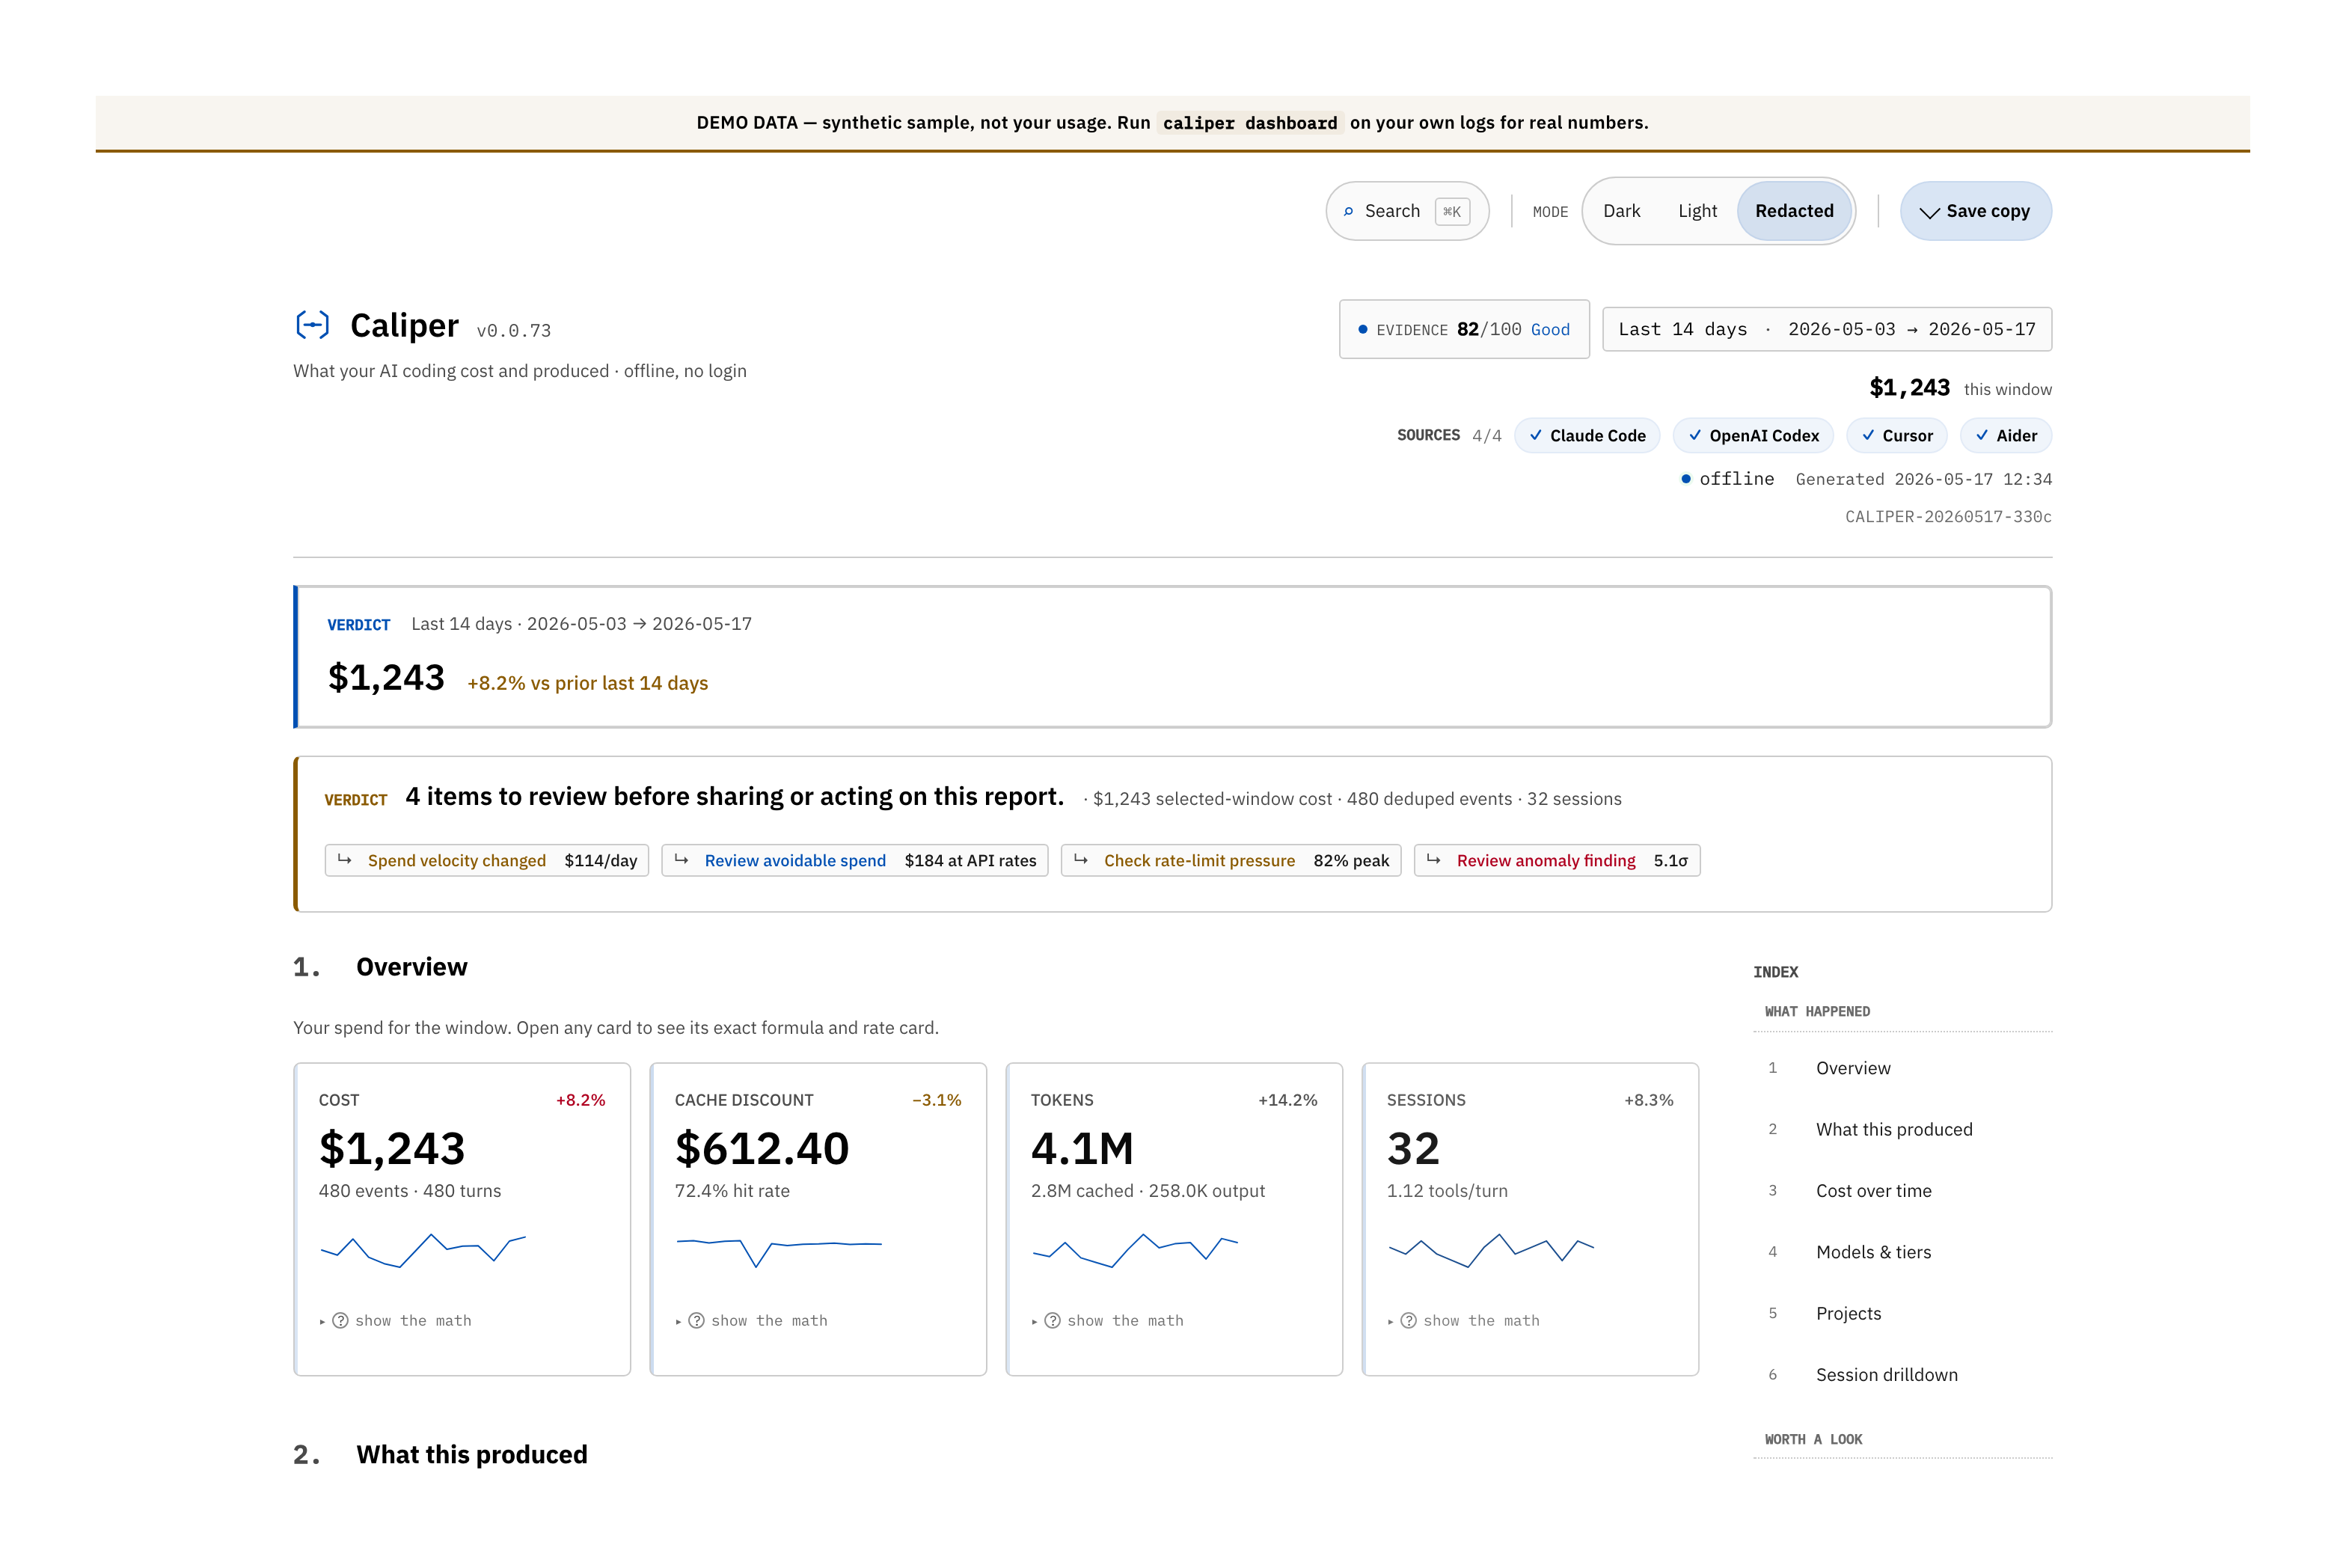
Safe Share mode: paths, projects, and session labels are redacted while costs, evidence status, and next actions stay visible.
What your spend produced
The dashboard's first section is built from the git history and tool calls already on your machine:
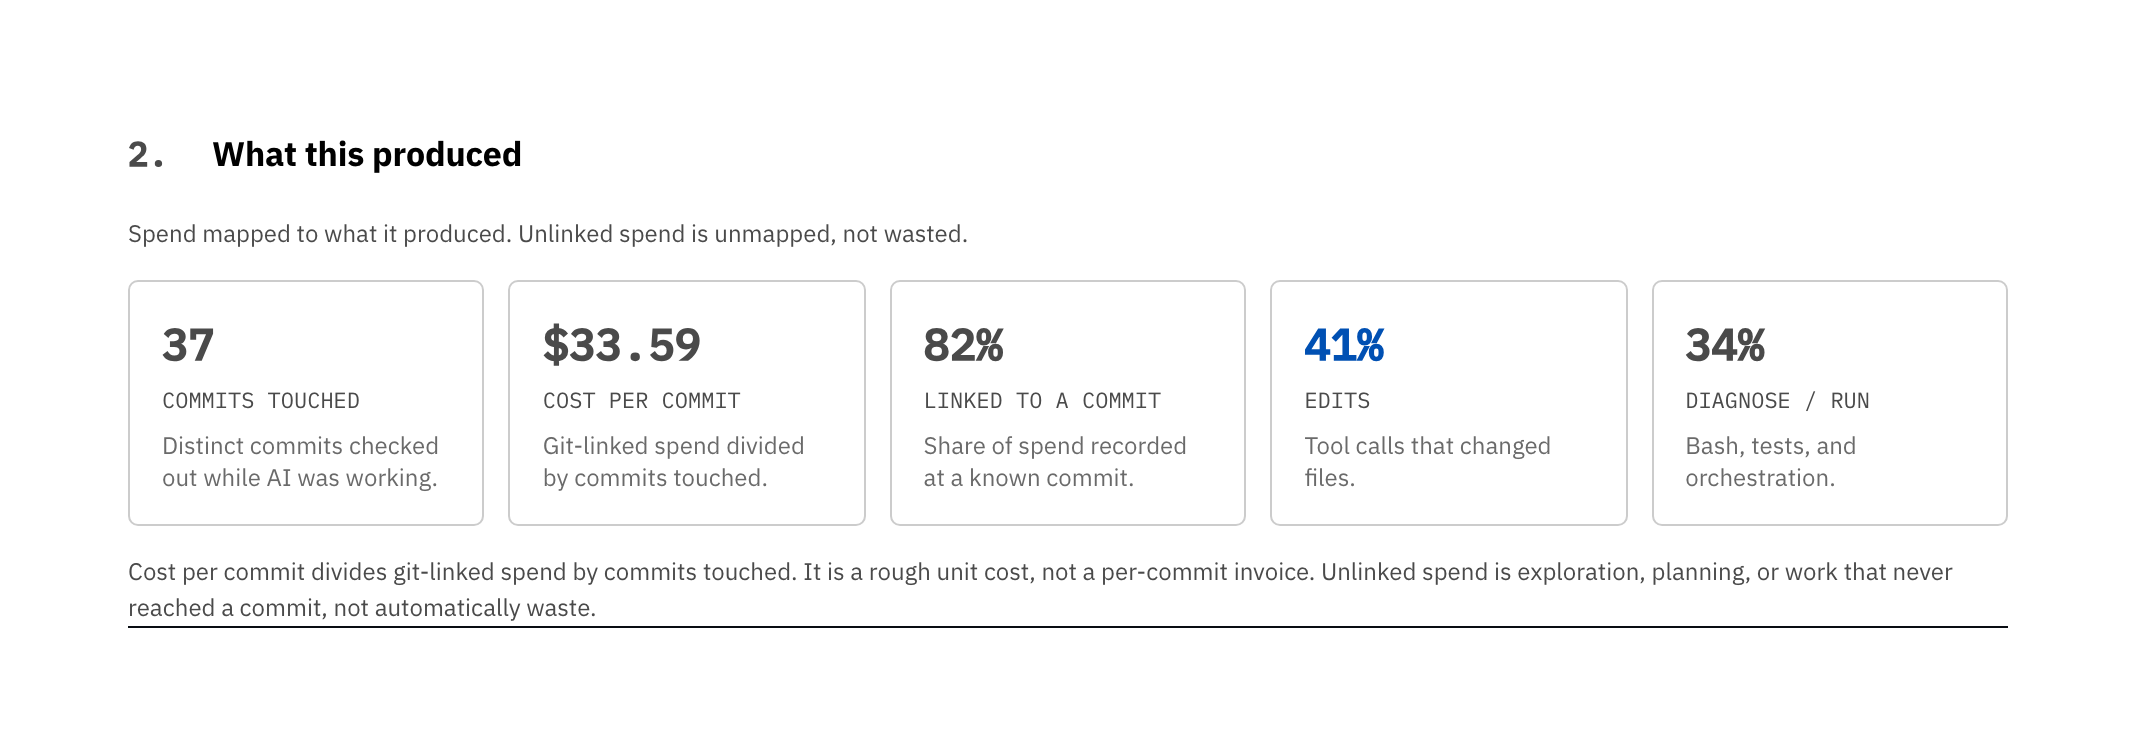
- Commits authored. How many commits you actually shipped in this window, in
the repos your sessions touched — read from local
git log, counting every source. It does not claim every commit was AI-written. - Cost per commit. Total spend divided by commits authored. A unit cost, not an invoice.
- Linked to a commit. The share of spend a source tied to a specific commit. The rest is exploration, planning, or work that never reached a commit. That is not automatically waste, and Caliper says so.
- Edits vs. diagnose/run. The share of tool calls that changed files versus ran shells and tests. A lot of diagnosing and very little editing is the rough shape of a session that spun instead of shipped.
These are signals, not a verdict. Each is labeled with its assumption. Caliper measures cost and effort, not whether the code is good.
What it answers
Vendor dashboards are per-tool, behind a login, and a flat subscription hides the per-token cost behind one price. None of them know your git history, your PRs, or which project caused the work. Caliper reads local logs, prices them with dated rate cards, and answers:
- What did this PR cost?
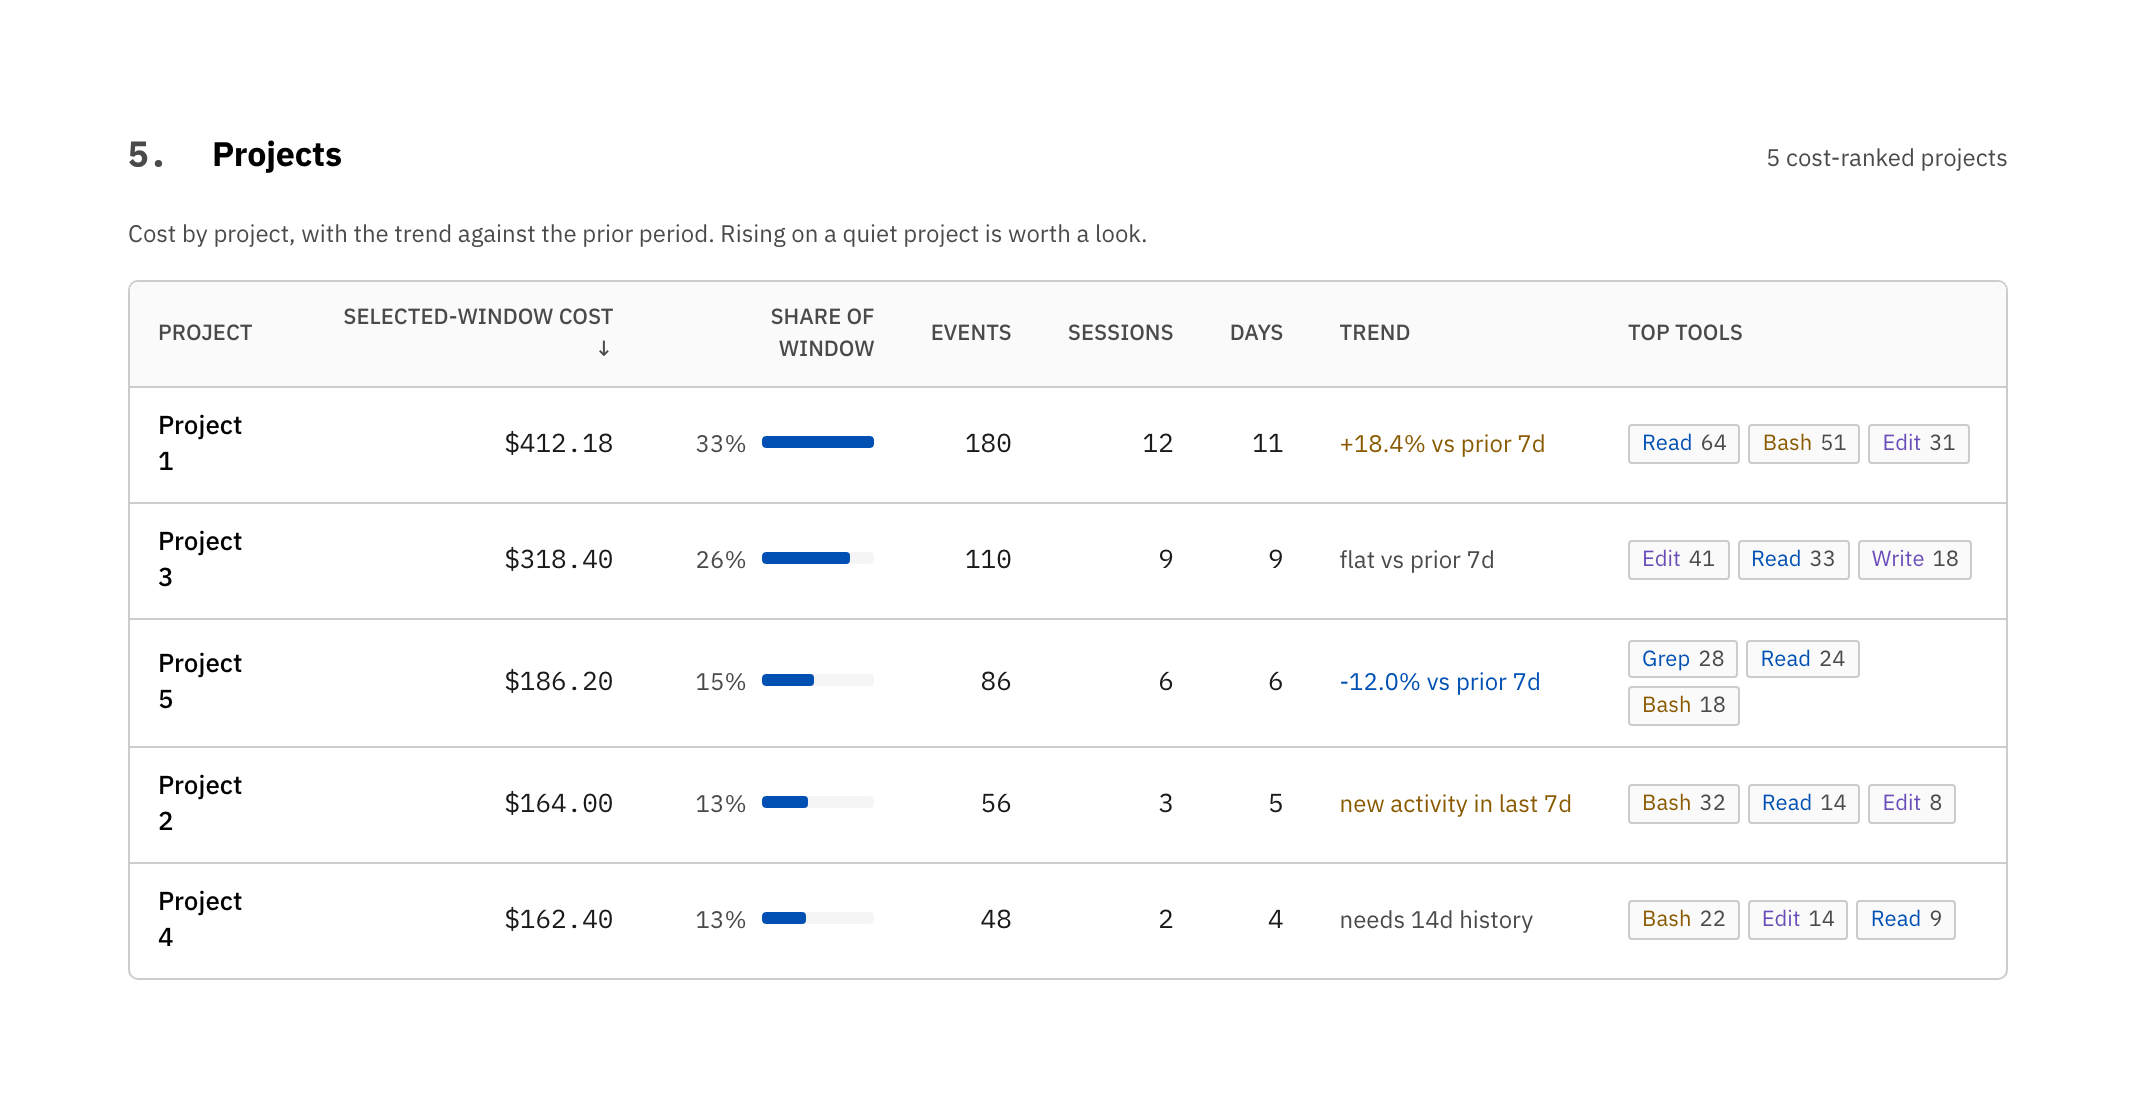
- Which project is driving the spend?
- Where is spend avoidable, and how confident is that number?
- On a flat plan, what would the same usage cost at API rates?
- Is each number exact, estimated, partial, or unsupported?
Running it
caliper dashboard
No logs yet? Run caliper dashboard --demo to open the full report on built-in
sample data before pointing Caliper at your own usage.
It writes a self-contained HTML file and opens it in your browser. The verdict sits at the top: the period, the cost, and the trend. Nothing prescriptive competes with it.
Caliper · Last 30 days · $1,243 · trend +8.2% · top fix: Move low-output
                                  fast tier calls to standard ($96.40)
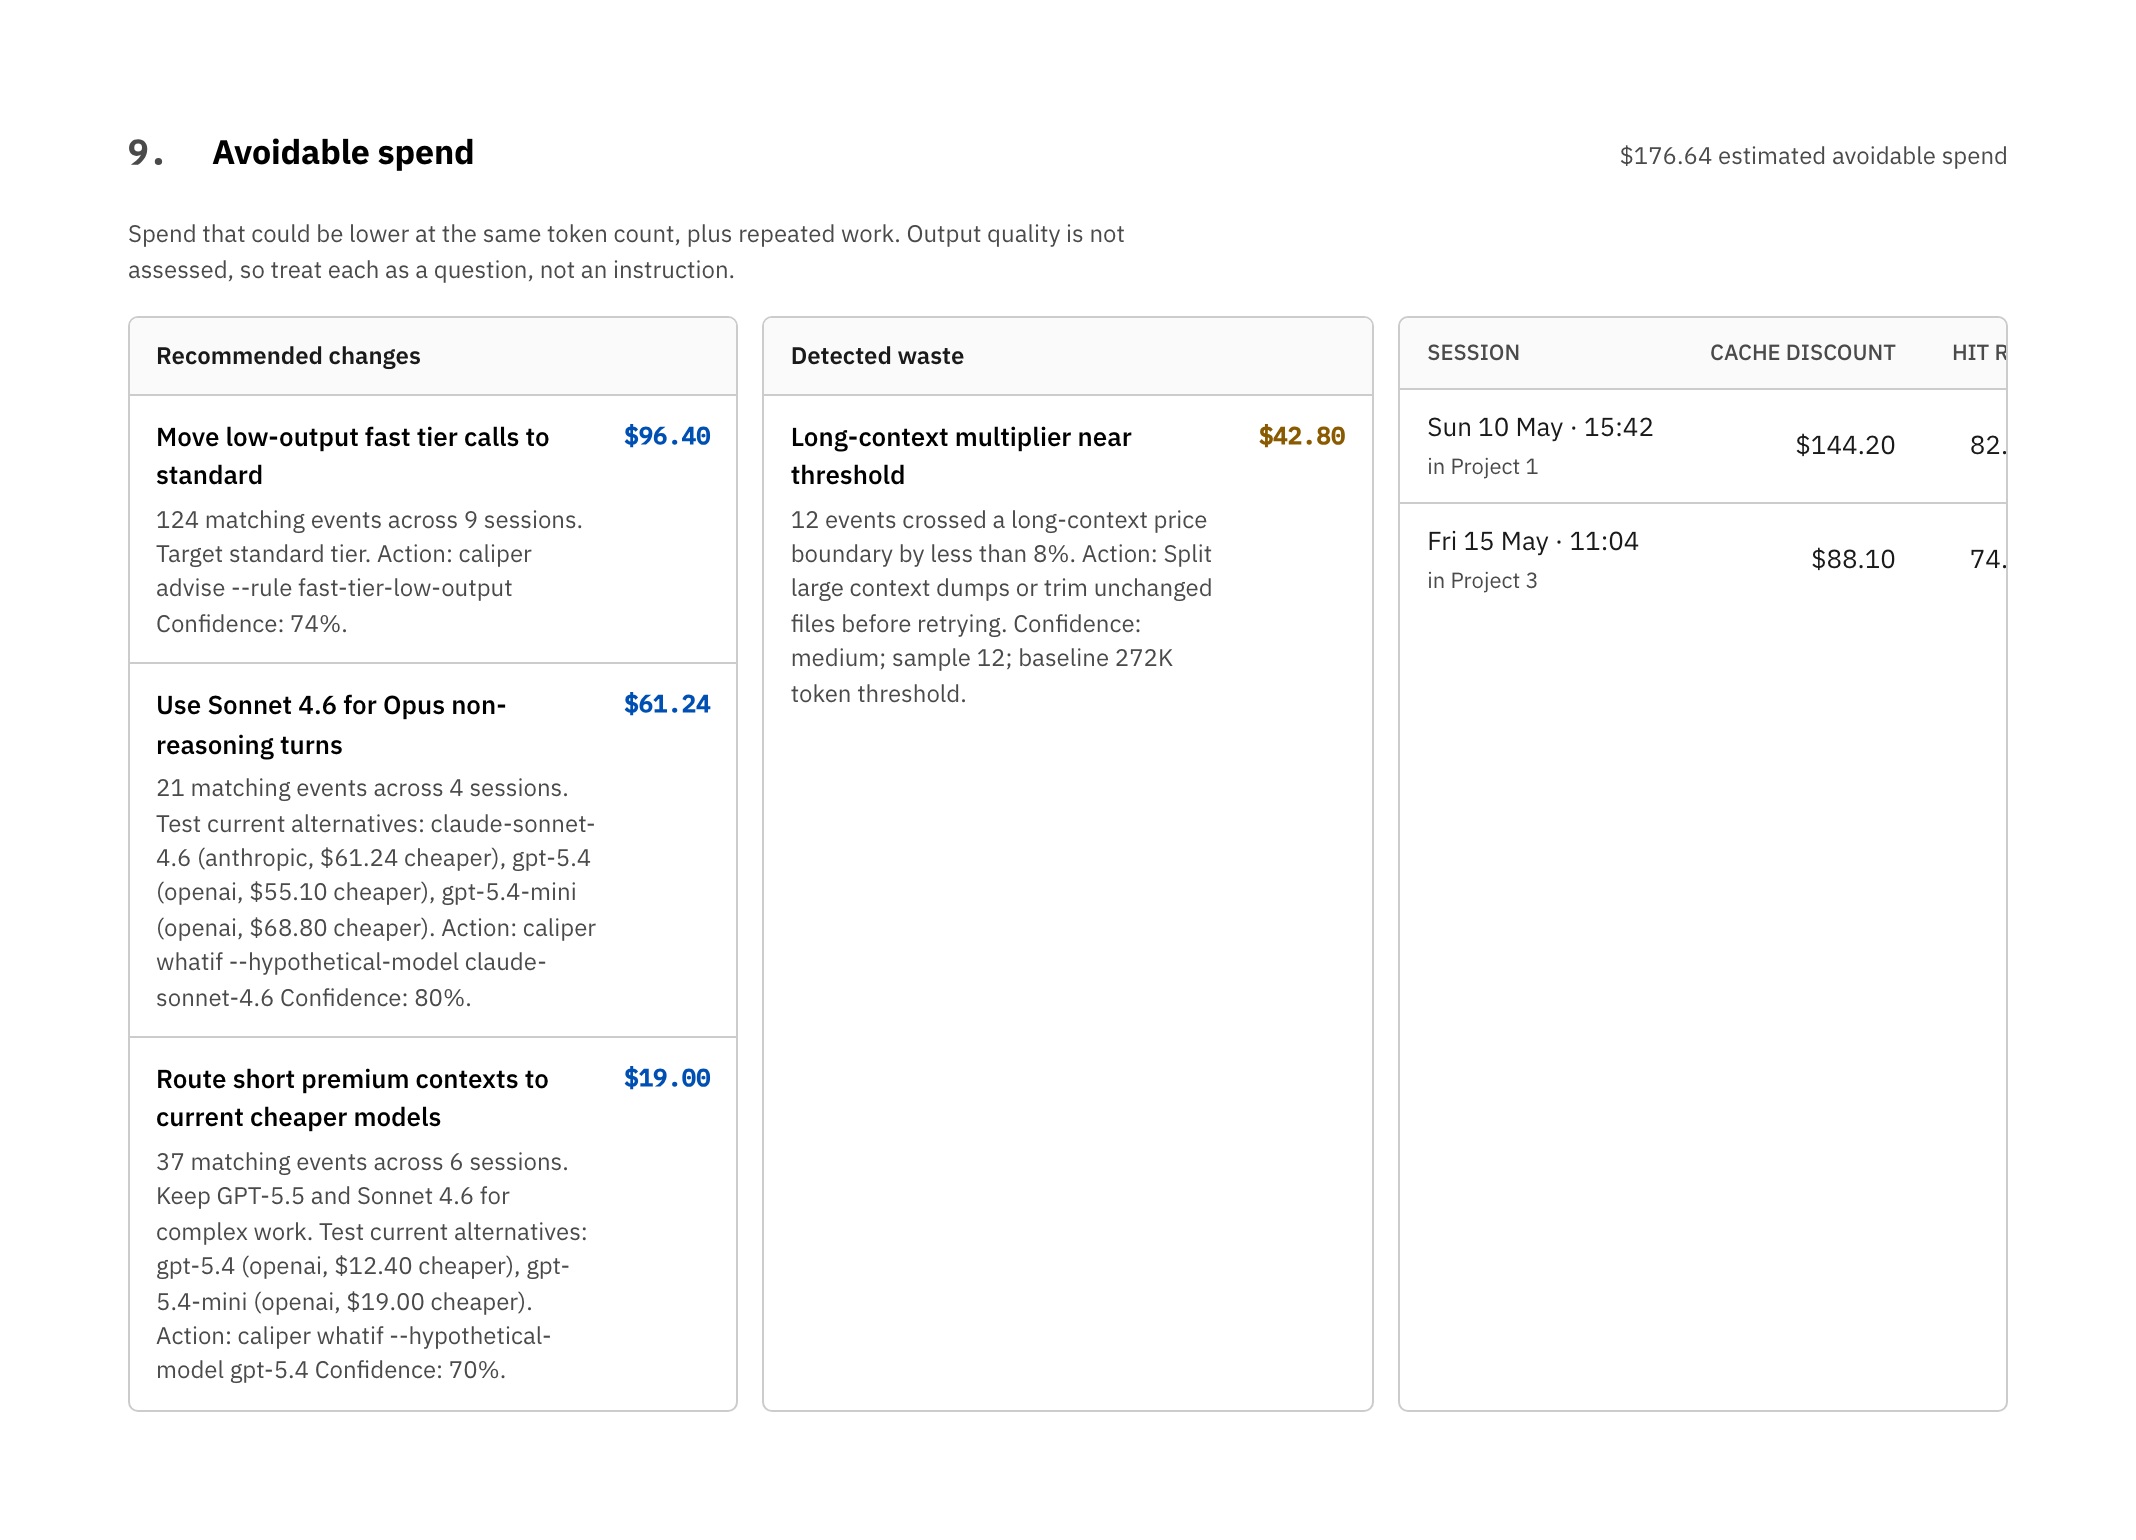
Avoidable: $176.64 across 3 recommendations. Reproduce with `caliper recommend`.
Theme: dark · local-only · re-render: caliper dashboard --open
If Caliper detects a flat-rate subscription, it labels the headline cost API-equivalent value, not a bill, right where you read it. Nobody mistakes what your usage is worth for what you owe.
Every KPI on the page has a "show the math" disclosure: the formula, the rate card date, and the sample size. Evidence, anomalies, avoidable spend, and session rows show the source quality behind each number, so you never trust an unexplained total.
Large first runs spend a moment indexing your local log history. Later runs
reuse the parse cache. Inspect it with caliper cache status, clear it with
caliper cache clear, or relocate it with CALIPER_CACHE_DIR.
Rate cards stay current, on your terms
Costs are priced from a rate card embedded at release time. See exactly which card is active and how old it is:
caliper rates show # active rate card, its sources, and its age
Caliper is offline by default and never fetches on its own. When you want the latest published pricing, opt in explicitly:
caliper rates refresh --allow-network
This is the auditable backing for every dollar: rates show names the dated,
sourced rate card behind the prices, and the dashboard's per-KPI "show the math"
disclosures expand the formula and sample size on top of it.
Dashboard tour
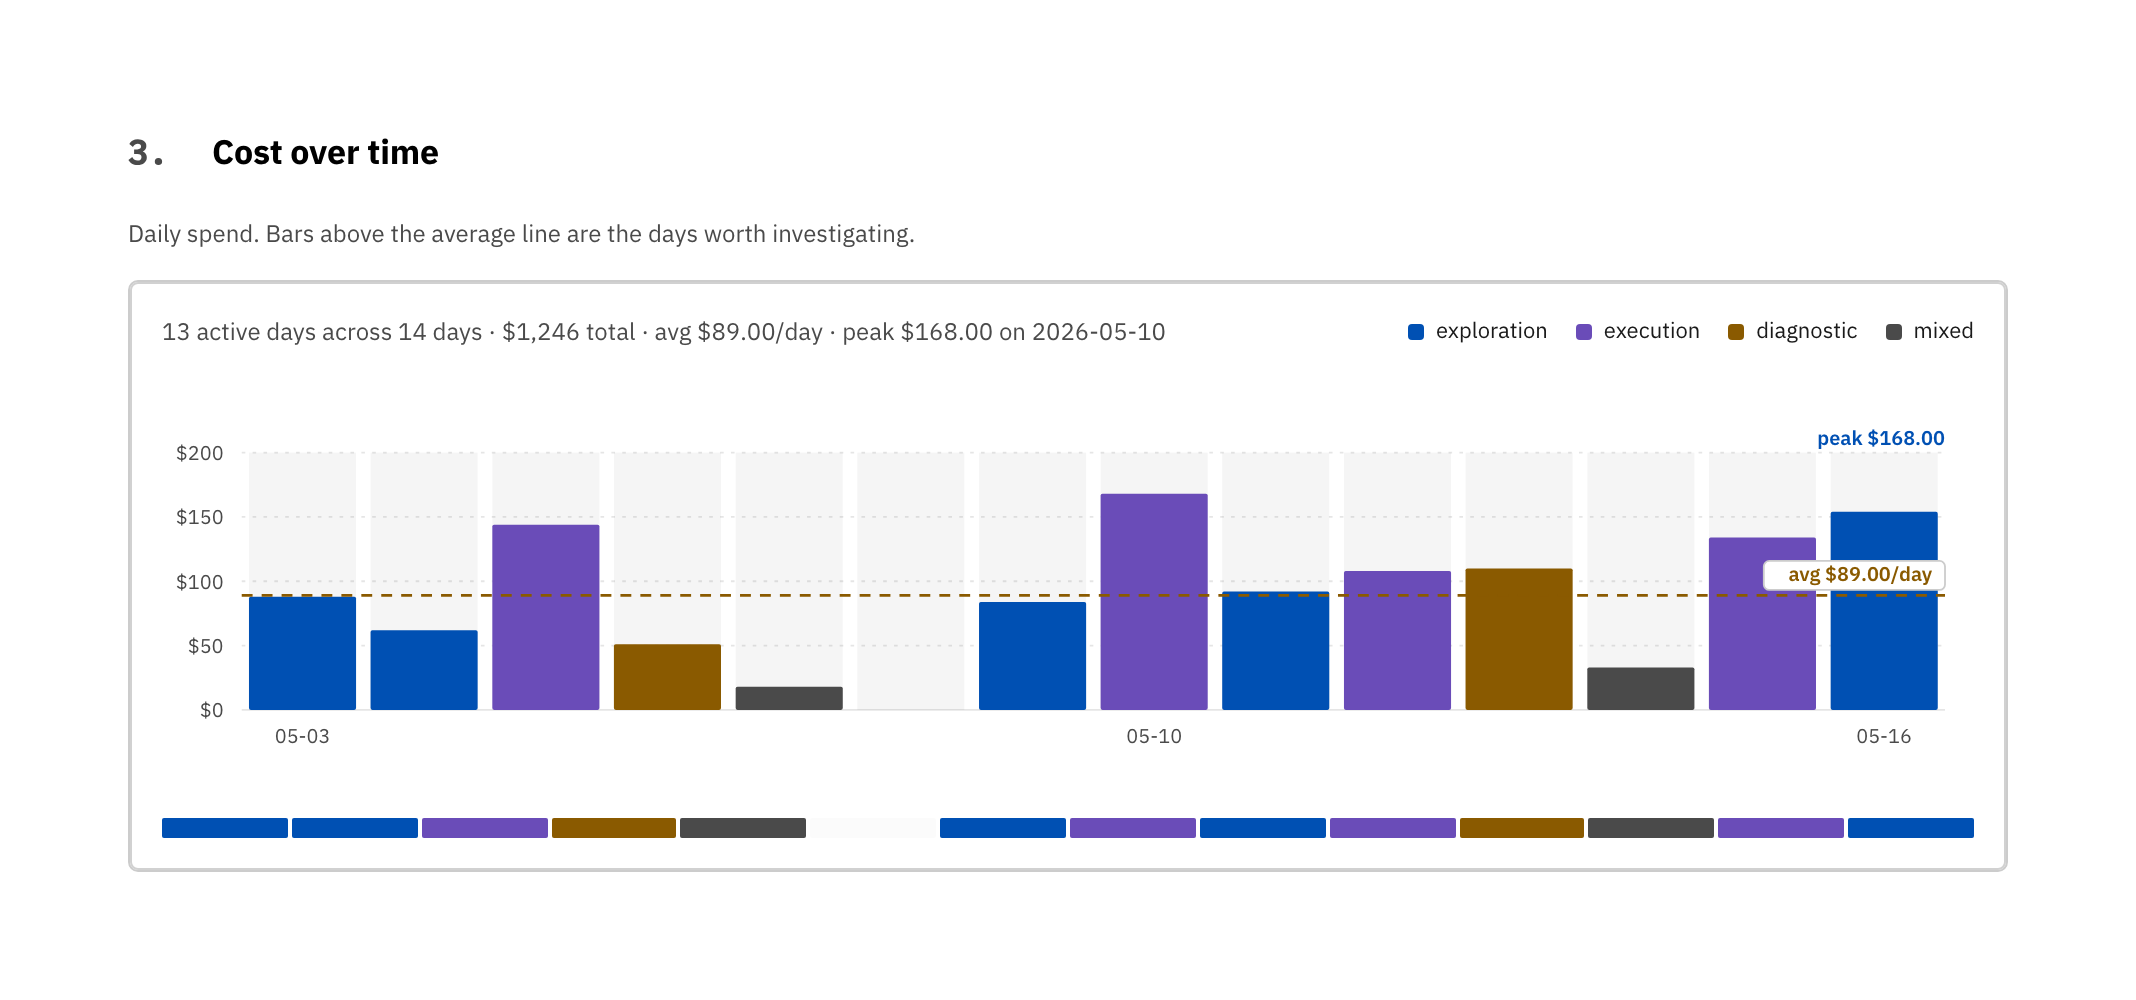
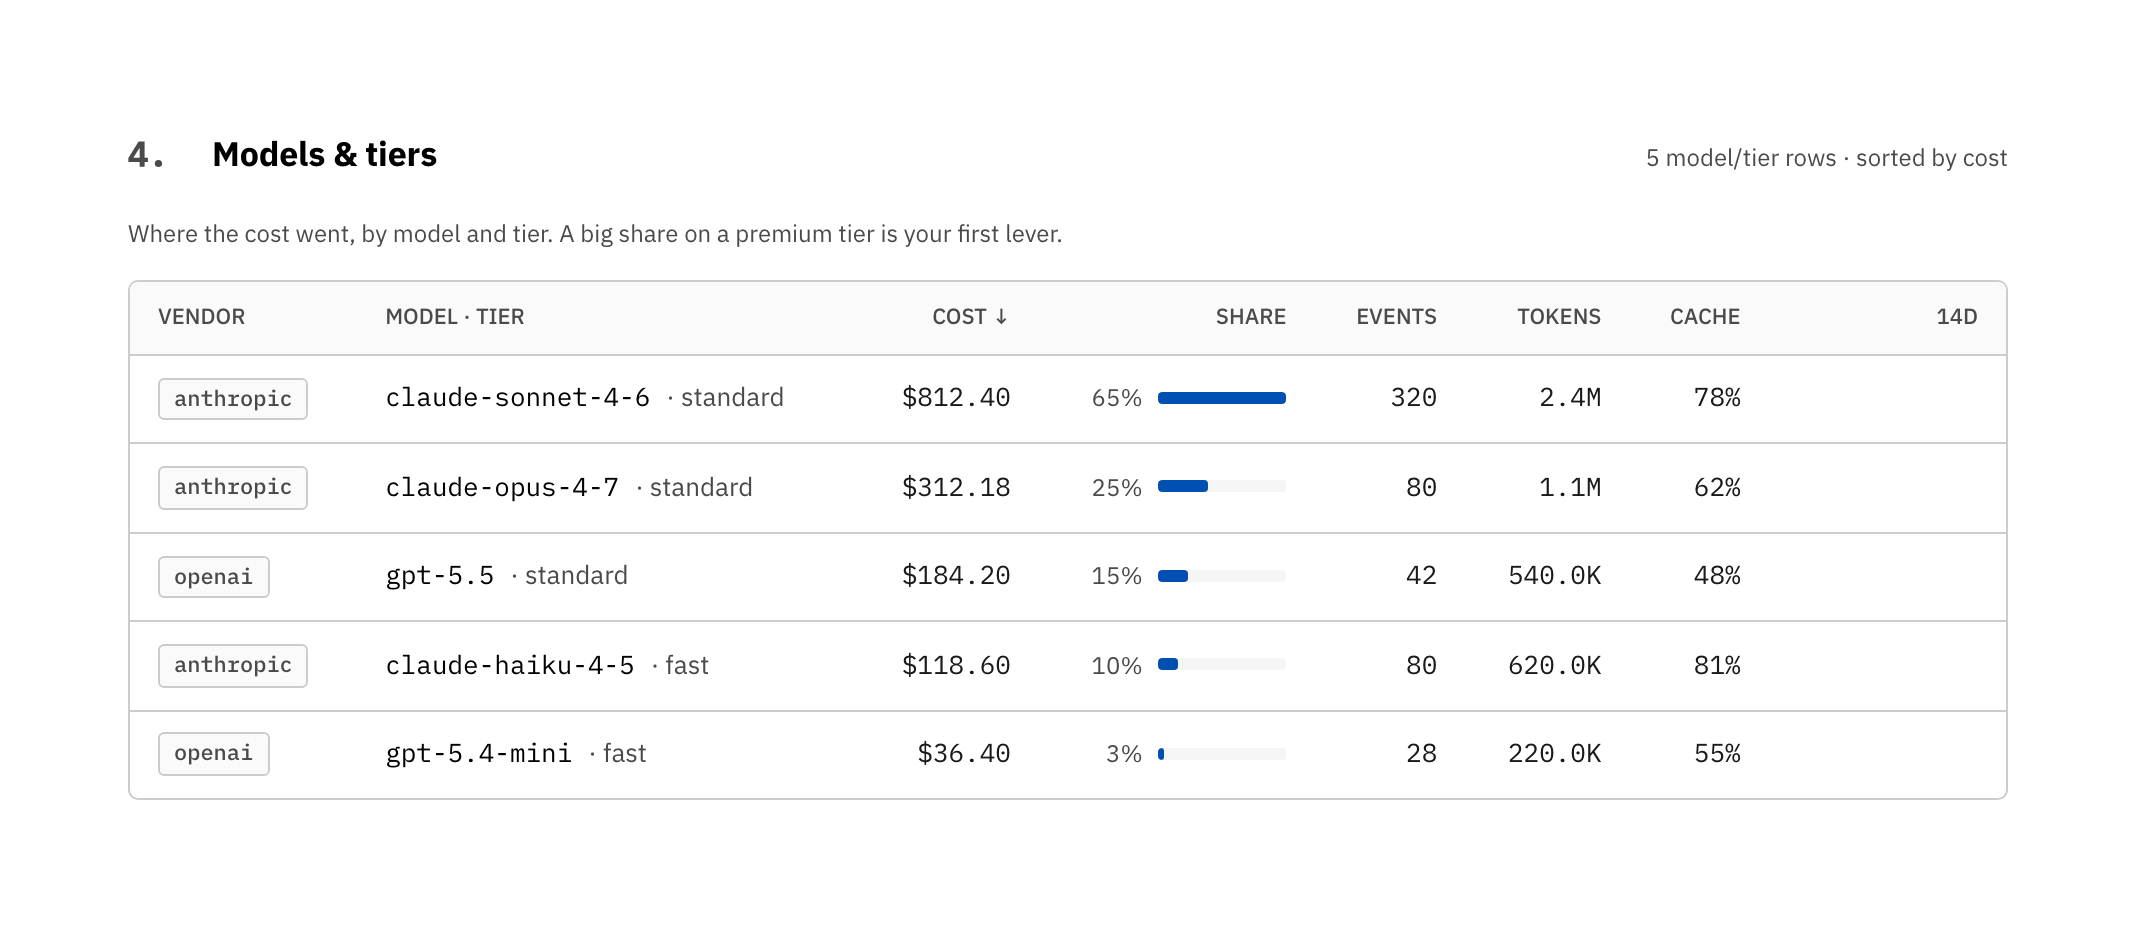
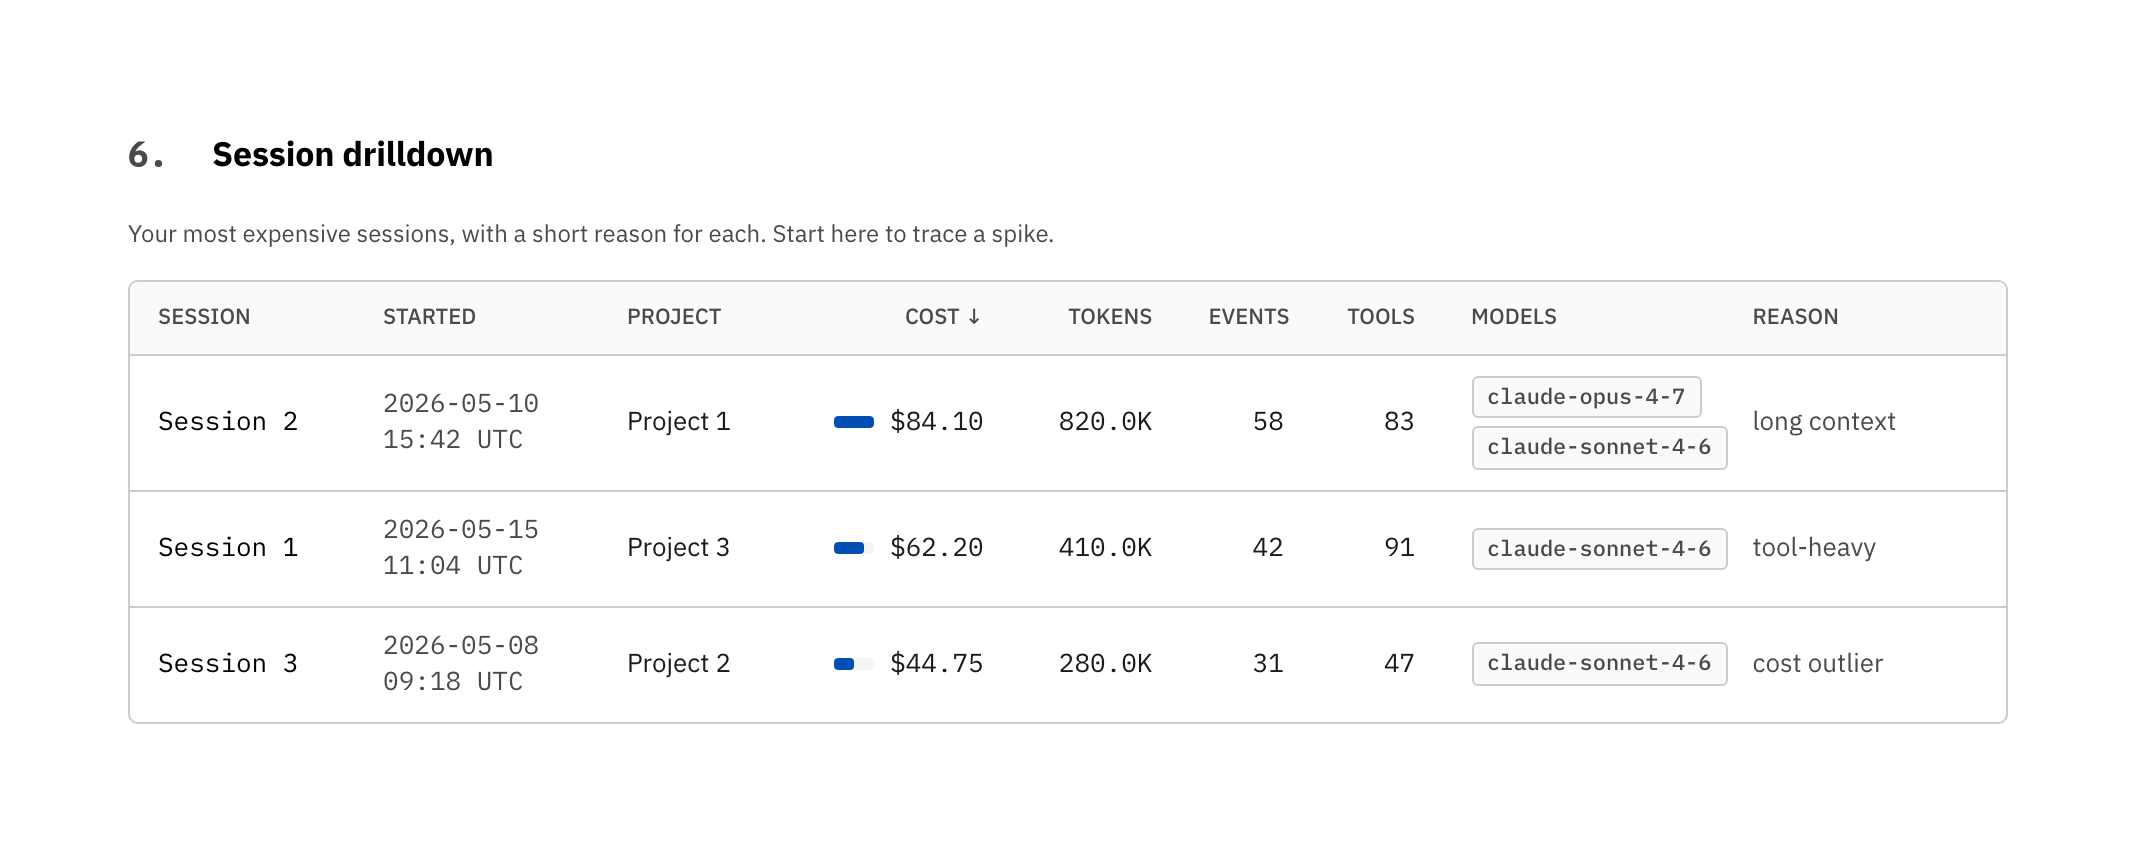
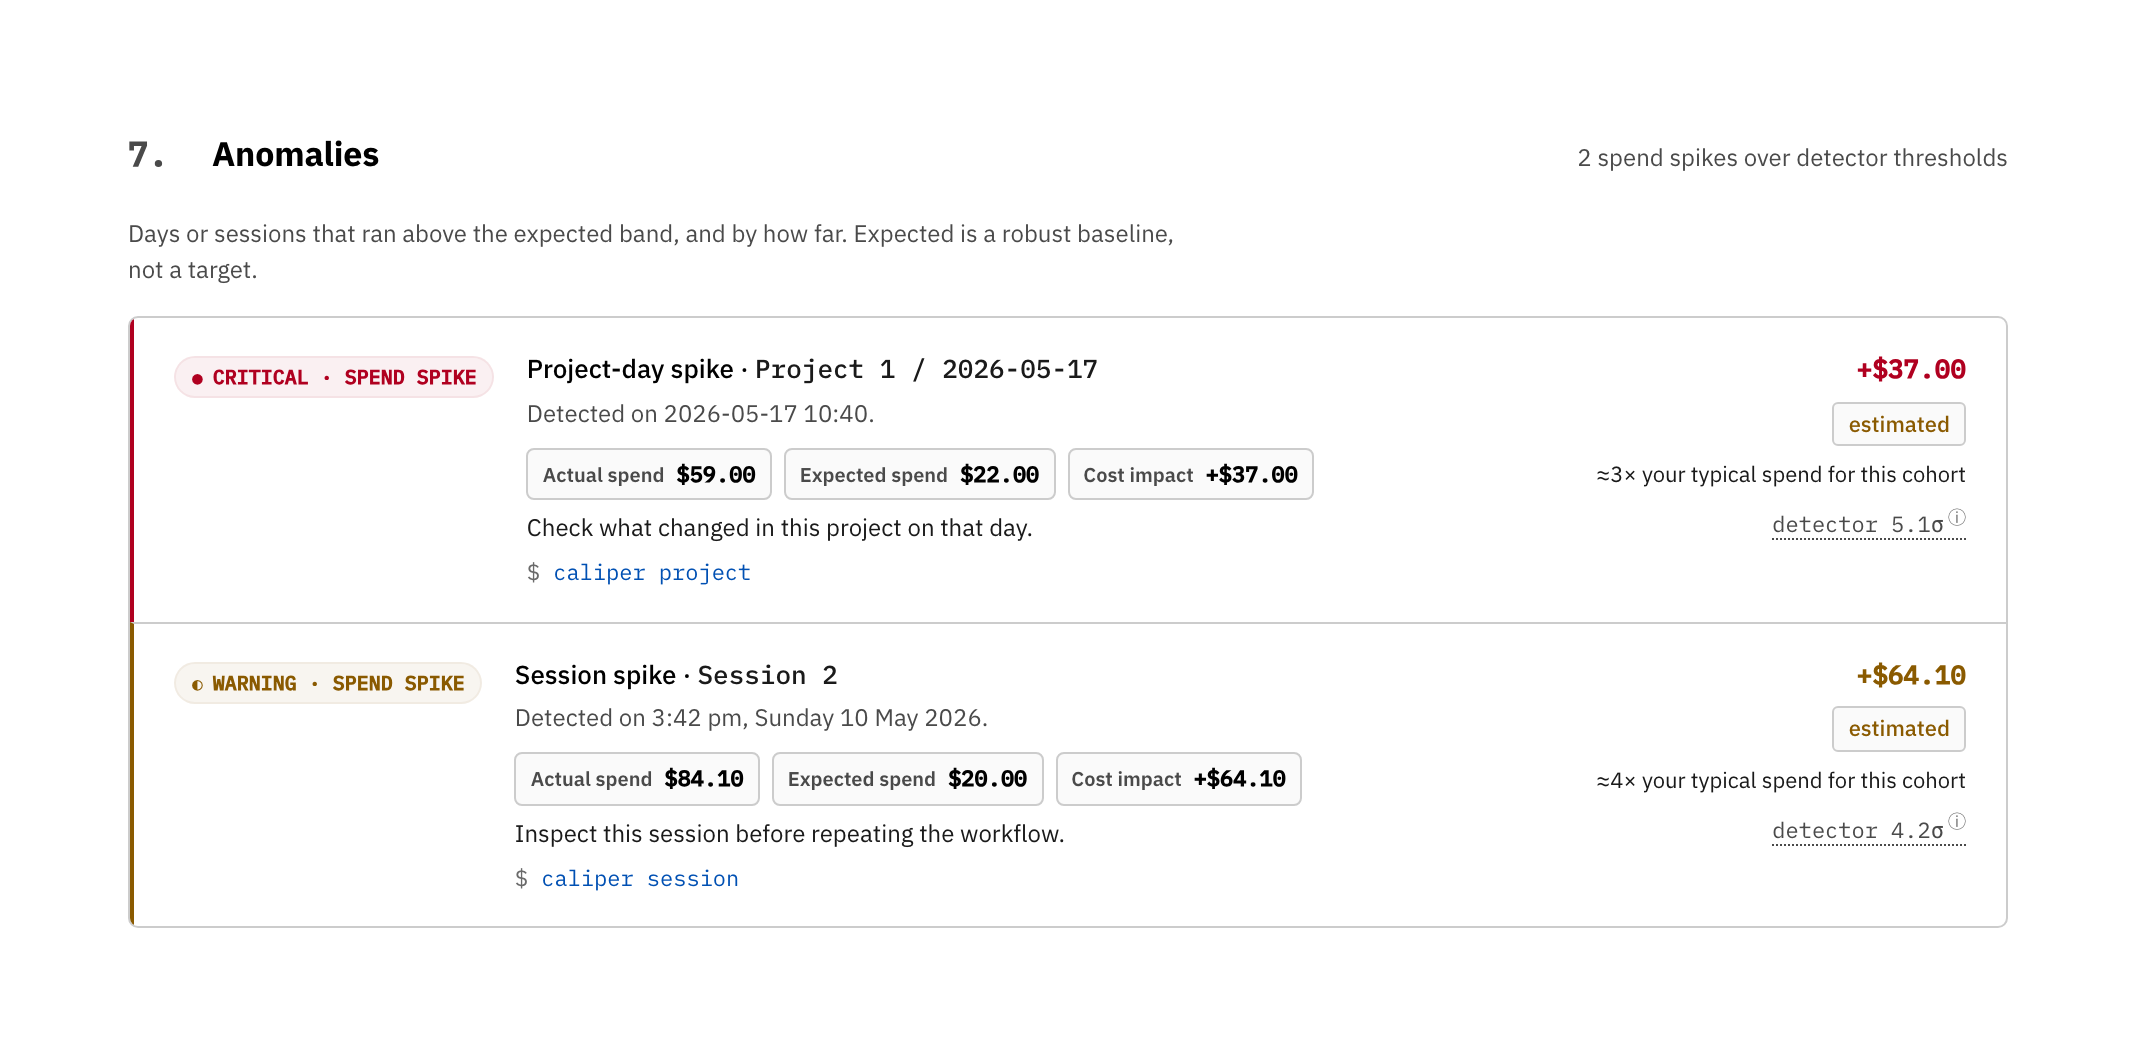
These screenshots come from caliper dashboard --safe-share, so they show the
real report layout without exposing local paths or session identities.
| Cost over time | Models & tiers |
|---|---|
 |
 |
| Projects | Session drilldown |
|---|---|
 |
 |
| Anomalies | Avoidable spend |
|---|---|
 |
 |
Anomalies go past "you spent a lot that day" — which is usually just a busy day you already know about. Alongside raw spikes, Caliper flags efficiency regressions: a session that paid more per 1M tokens than prior sessions of the same size in the same project and model (cache loss, model drift, tool thrash), with the extra dollars quantified. Each row ends in the command that opens its source — paste it and you are looking at the cause, not just the spike.
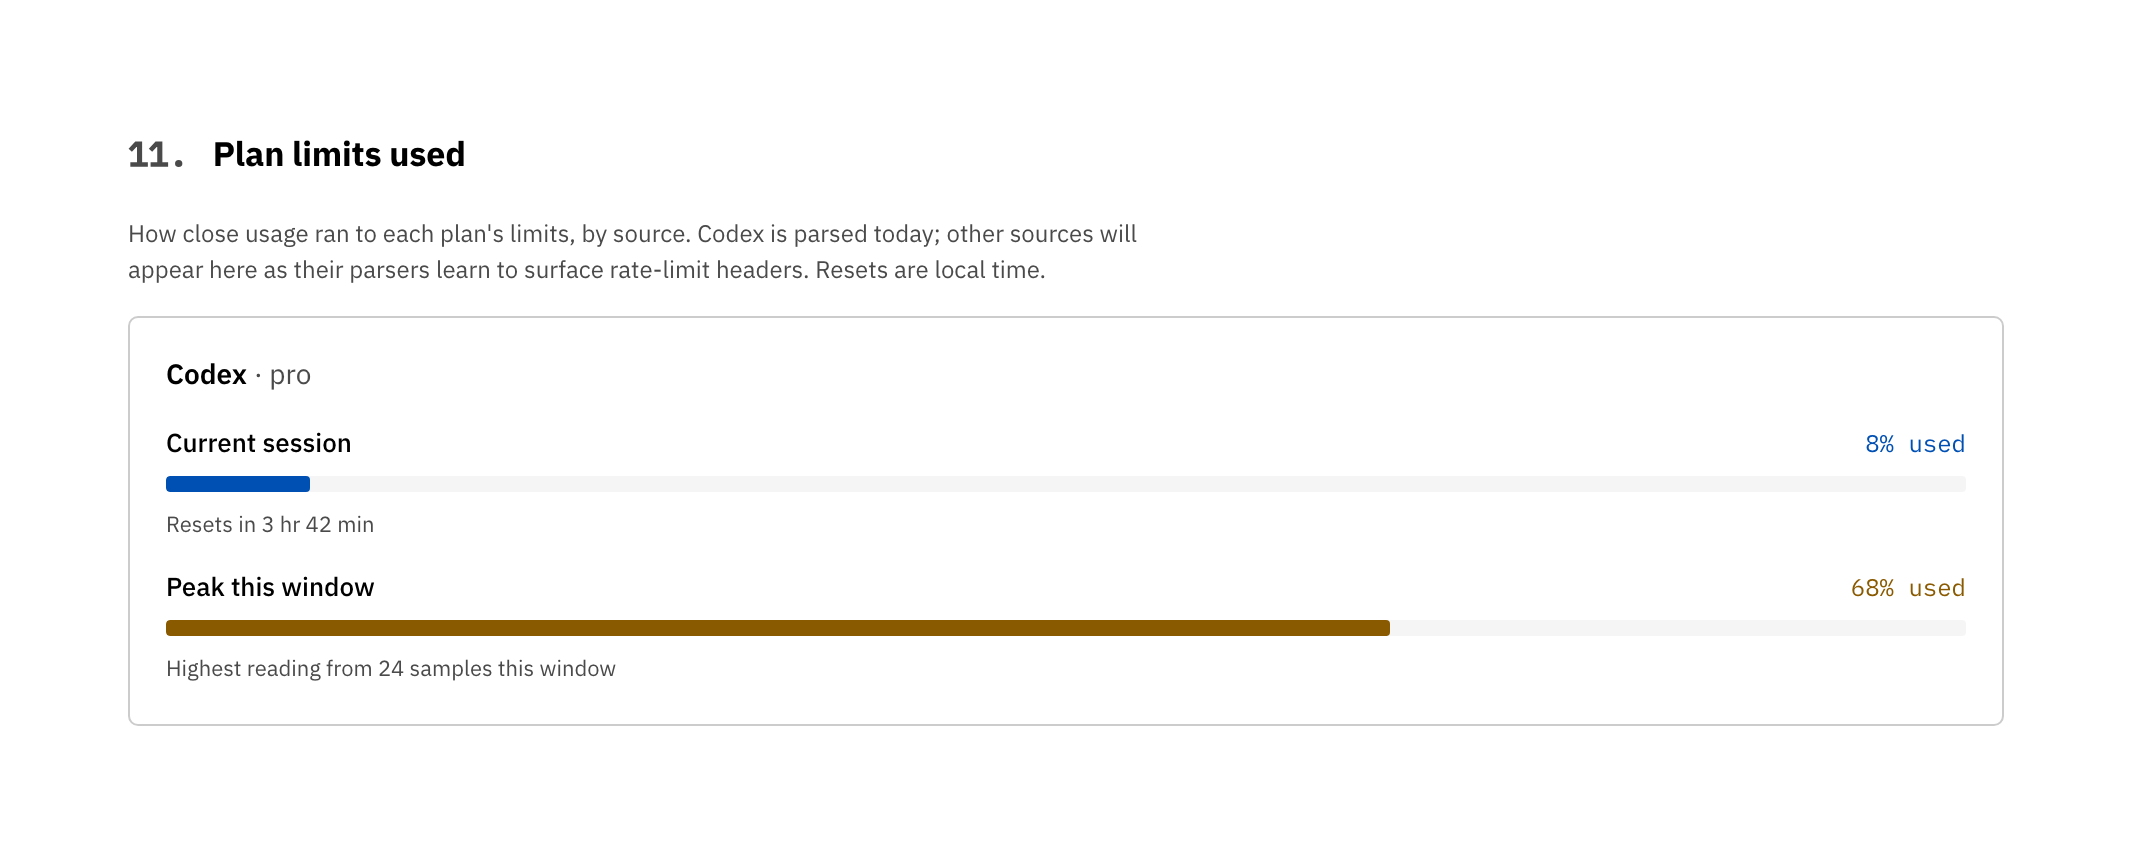
Plan limits used shows how close each source ran to its plan limits. Caliper parses rate-limit headers from Codex today; Claude Code, Cursor, and Aider panels appear automatically once their parsers learn to surface rate-limit info. Each panel reads with human reset times — "Resets in 3 hr 42 min", "Resets Thu 21 May · 09:30" — instead of raw Unix epochs.
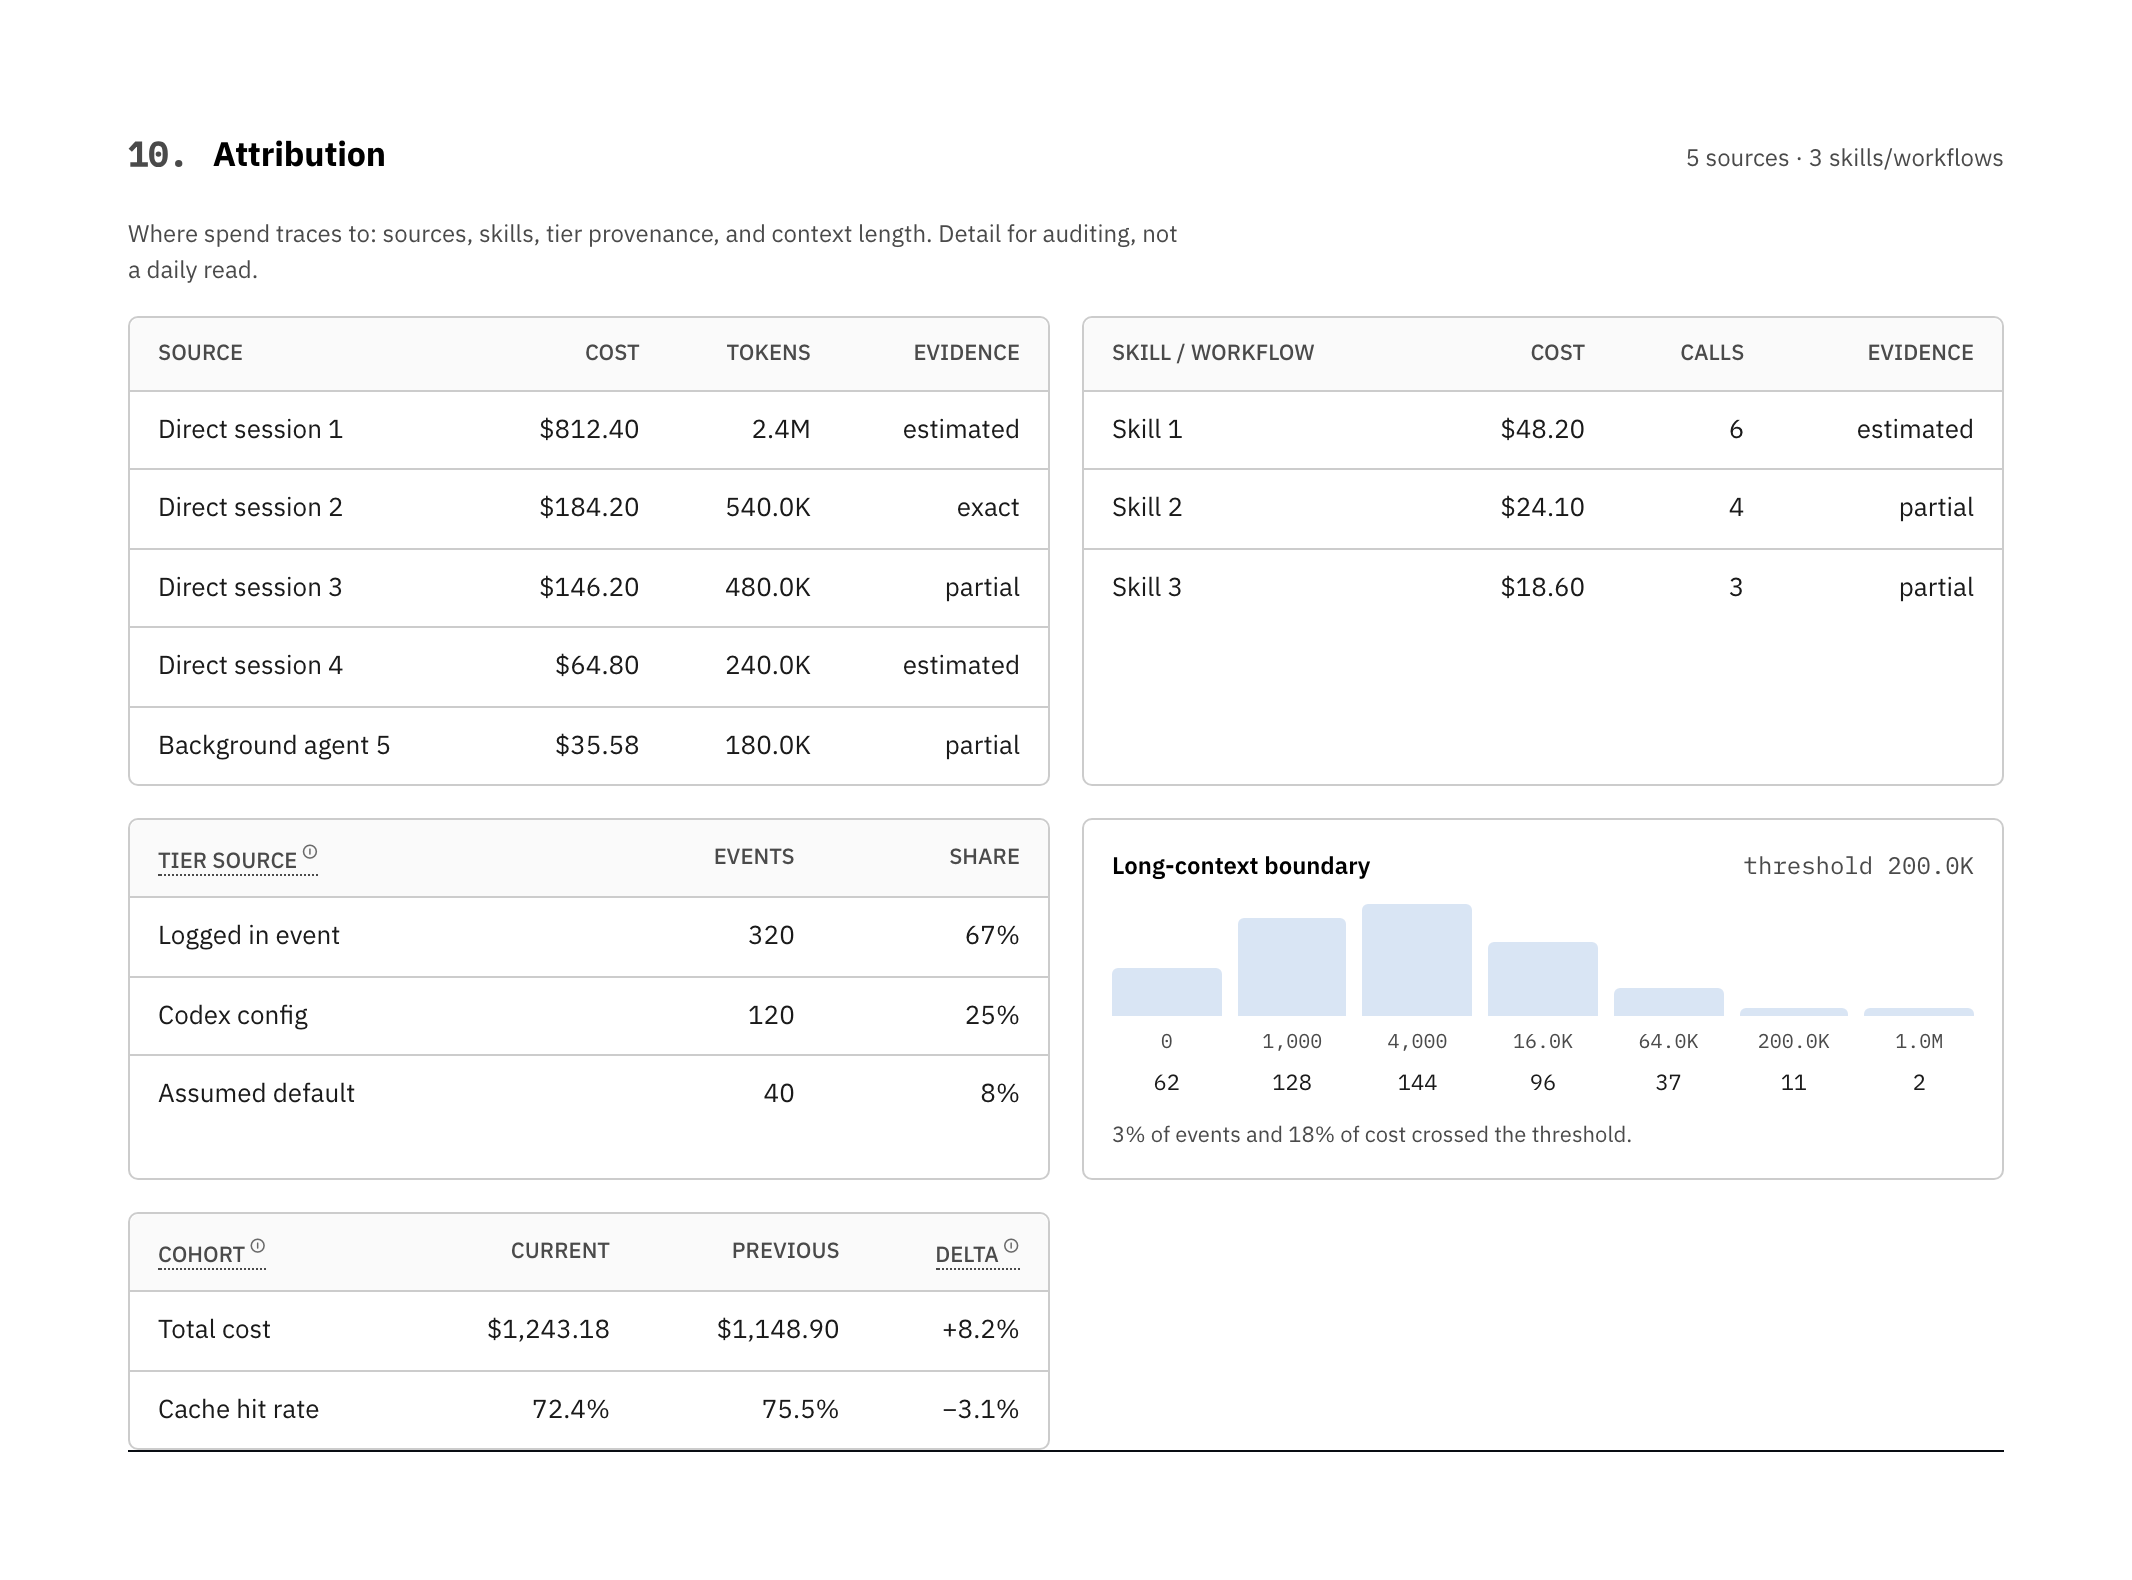
How it's different
| Caliper | Hosted proxies (Helicone, Langfuse, …) | |
|---|---|---|
| Where data lives | Local disk | Their servers |
| Sits on the request path | No | Yes — proxy or SDK |
| Login required | No | Yes |
| Reads existing AI-tool logs | Yes — Codex, Claude Code, Cursor, Aider | No — needs you to route through them |
| Per-PR / per-project cost | Yes — local git attribution | If you instrument it |
| Works with WiFi off | Yes | No |
If you need a request-path proxy, use one of those. If you want to know what last month cost without sending prompts to a third party, use Caliper.
What you get
| Surface | Command | Purpose |
|---|---|---|
| Browser dashboard | caliper dashboard |
What your spend produced, cost over time, models, projects, sessions, then any real flags (anomalies, budgets, avoidable spend) and the evidence behind every number. |
| PR receipt | caliper pr 42 |
Cost of events that recorded the PR's commit SHAs (it states how much of window spend that covers). |
| Overview | caliper overview |
Rolling 7 / 30 / 90 day spend. |
| Project rollup | caliper project |
Spend by repository or folder. |
| Model rollup | caliper models |
Spend by model and vendor. |
| Evidence report | caliper evidence |
How trustworthy each dimension is. |
| Advisor | caliper advise --strict |
Ranked, dollar-anchored fixes. |
| Doctor | caliper doctor |
Local setup + data coverage. |
| Budgets | caliper budgets check |
CI-friendly warning / breach exits. |
| TUI | caliper tui |
Interactive terminal workspace. |
PR receipt
caliper pr 42
Caliper · PR #42
128 events  432,118 tokens  $4.82   ·   7 commits

  Vendor        Model                 Events   Tokens (in/out)    Cached   $
  openai-codex  gpt-5.4 standard          74   210,000 /  31,000    61%   $2.10
  claude-code   claude-sonnet-4.6         31    88,000 /  12,000    48%   $1.12
  cursor        composer                  23    72,118 /  19,000    22%   $1.60
Missing git attribution is surfaced as partial evidence instead of being silently treated as exact.
What the dollar figures mean
Caliper is precise about what its numbers are, because the framing changes with how you pay:
- Metered API usage (API keys, usage-based billing). The cost total is your actual bill, and avoidable-spend findings are real money you would stop spending.
- Flat-rate subscription (a fixed monthly plan). The cost total is the API-equivalent value of your usage, what the same work would cost on the meter. It's not an invoice, and a flat plan has nothing to refund. Avoidable spend here means wasted tokens, slower loops, and rate-limit pressure, not cash back. Caliper labels this everywhere it shows the number.
Pricing math is identical in both modes. Only the label changes, and Caliper never pretends a flat-plan total is a bill.
Trust model
| Boundary | Default |
|---|---|
| Login | none |
| Upload | none |
| Telemetry | none |
| Daemon | none |
| Request proxy | none |
| Network calls during usage analysis | none |
| Pricing refresh | explicit --allow-network |
| GitHub PR lookup | explicit --allow-network |
| Prompt output | redacted |
| Absolute paths | redacted in machine-readable output |
| Parse cache | local SQLite only; may contain local paths/session metadata |
The privacy invariant is enforced in CI. The generated HTML contains zero
external resources, zero <script src>, zero fetch/XMLHttpRequest/import().
Interactive dashboards use one inline UI script and one JSON data block. Pass
--no-interactive for script-free HTML.
The parse cache is not telemetry and is never uploaded. It stores parsed usage
events, source file fingerprints, and enough local metadata to avoid reparsing
unchanged logs. Disable it per run with --no-parse-cache.
You can verify it on the file Caliper wrote (default location shown):
grep -E "://|<link|<script src|fetch\(|XMLHttpRequest|import\(" ~/Downloads/caliper-dashboard-*.html
# no matches
Accuracy
Caliper does not pretend every local log is perfect. It reports what the evidence supports.
- Costs use
Decimal. - Cached input, cache creation, output, and reasoning tokens are tracked separately when vendors expose them.
- Long-context multipliers are applied per model.
- Codex Fast mode is priced with sourced model-family multipliers and kept separate from standard-tier usage in dashboard spend drivers.
- Unknown pricing is surfaced as a warning, not silently guessed.
- Anomaly detection uses robust σ (MAD × 1.4826, IQR / 1.349) with a $1 absolute floor — no more "354,210σ" on a sparse Tuesday. Beyond raw spikes, an efficiency-regression detector flags sessions that cost more per 1M tokens than their project/model peers, so the section surfaces waste you can act on, not just busy days.
- Tool-mix shares disclose any unrecognized-tool remainder instead of quietly normalizing it away, and per-day token sparklines plot tokens, not event counts.
- Evidence is graded
exact,estimated,partial, orunsupported. Each KPI exposes its formula inline.
caliper evidence
caliper doctor
caliper rates show
Budgets in CI
# .caliper.toml
[budgets]
daily_cost_usd = 25
weekly_cost_usd = 100
monthly_cost_usd = 500
caliper budgets check
| Exit | Meaning |
|---|---|
0 |
ok |
1 |
warning threshold crossed |
2 |
breach threshold crossed |
Supported sources
| Source | What Caliper reads |
|---|---|
| OpenAI Codex CLI | Local session logs, state DB, model + token fields. |
| Claude Code | Project JSONL logs, tool-use, cache token fields. |
| Cursor | Local token-bearing records where available. |
| Aider | Local chat history + usage records. |
Files that are transcript-only or missing token counts are surfaced by
caliper doctor so coverage stays explicit.
Install
Requires Python 3.11+.
# Recommended.
uv tool install caliper-ai
uv tool upgrade caliper-ai
The PyPI package is caliper-ai; the command is caliper.
Other install paths (pipx, venv + pip, uvx)
# pipx
pipx install caliper-ai
pipx upgrade caliper-ai

# venv + pip
python -m venv .venv && source .venv/bin/activate
python -m pip install caliper-ai

# uvx one-off (use --from to avoid name-collision resolution)
uvx --isolated --from caliper-ai caliper dashboard --demo --open
If uv can't see a just-published version (stale PyPI index or resolver
cache):
UV_NO_CACHE=1 uv tool install --force caliper-ai
FAQ
Will Caliper save me money? Not on a flat plan. There's nothing to save. It gives you visibility: what your usage is worth at API rates, where it goes, and where it's avoidable. On metered API usage, the avoidable-spend findings are real money.
What does the cost number mean on a subscription? It's the API-equivalent
value of your usage, not a bill. Caliper labels it that way everywhere it shows
the number. Run caliper evidence for the full breakdown.
Does it measure whether AI is actually making me productive? It measures the honest, local half of that: cost per commit, how much spend linked to a commit at all, and the ratio of editing to diagnosing. It does not judge whether the code was good, and it never claims a commit equals value. Those are signals to read, not a score to trust blindly.
Does it work with Cursor today? Yes, when Cursor's local data includes
token-bearing records. Some Cursor files are transcript-only. caliper doctor
reports which.
How accurate are the costs? As accurate as your local logs and rate card
allow. Run caliper evidence to see which dimensions are exact, estimated,
partial, or unsupported.
Does Caliper upload prompts? No. Default usage analysis is local-only and redacts prompt-like fields from normal output. CI tests the privacy invariant on every commit.
Is there a hosted version? No. There is no hosted version on the roadmap. Caliper is intentionally a tool you run, not a service you log into.
Development
uv sync --all-extras --dev
uv run ruff check . && uv run ruff format --check .
uv run pytest
See CONTRIBUTING.md for rate-card updates, new vendor parsers, schema changes, and release hygiene.
Who built this
Rajdeep Mondal. I had a four-figure AI coding bill, a strong hunch about which work caused it, and no offline way to prove it. Then I moved heavy work onto a flat plan and realized I now had the opposite problem: no idea what I was actually getting. Caliper answers both questions from the logs already on your disk, without sending anything anywhere.
License
MIT. See LICENSE.
Release history Release notifications | RSS feed


Download files
Download the file for your platform. If you're not sure which to choose, learn more about installing packages.
Source Distribution
Built Distribution
Filter files by name, interpreter, ABI, and platform.
If you're not sure about the file name format, learn more about wheel file names.
Copy a direct link to the current filters
File details
Details for the file caliper_ai-0.0.79.tar.gz.
File metadata
- Download URL: caliper_ai-0.0.79.tar.gz
- Upload date:
- Size: 512.0 kB
- Tags: Source
- Uploaded using Trusted Publishing? No
- Uploaded via: twine/6.1.0 CPython/3.13.13
File hashes
| Algorithm | Hash digest | |
|---|---|---|
| SHA256 |
f42198c39246b731bdc38c9be382819abb301334185d8c15140f25ffd39e927d
|
|
| MD5 |
7e936ecdb495a9d465729c067c1cd160
|
|
| BLAKE2b-256 |
222c2f46c3941c17be85fbe415df371d8016210970270180108cbe8ddb83bb7d
|
File details
Details for the file caliper_ai-0.0.79-py3-none-any.whl.
File metadata
- Download URL: caliper_ai-0.0.79-py3-none-any.whl
- Upload date:
- Size: 520.8 kB
- Tags: Python 3
- Uploaded using Trusted Publishing? No
- Uploaded via: twine/6.1.0 CPython/3.13.13
File hashes
| Algorithm | Hash digest | |
|---|---|---|
| SHA256 |
d0799fa2f634bd1dbee73fa4fc6409bf57f01890785d981ddb5ba6c9433f8b95
|
|
| MD5 |
350f21123fa30559350236eda2f95081
|
|
| BLAKE2b-256 |
417b0af349a5b1b7ae724cbcfa54caee9d8c1d707fc88d6bbceba502caf8482e
|






