
callsight
Exact per-call timing for the C/C++ code you choose — and zero cost for the code you don't.




Documentation · Getting started · Configuration · Analysis · Architecture · Reference
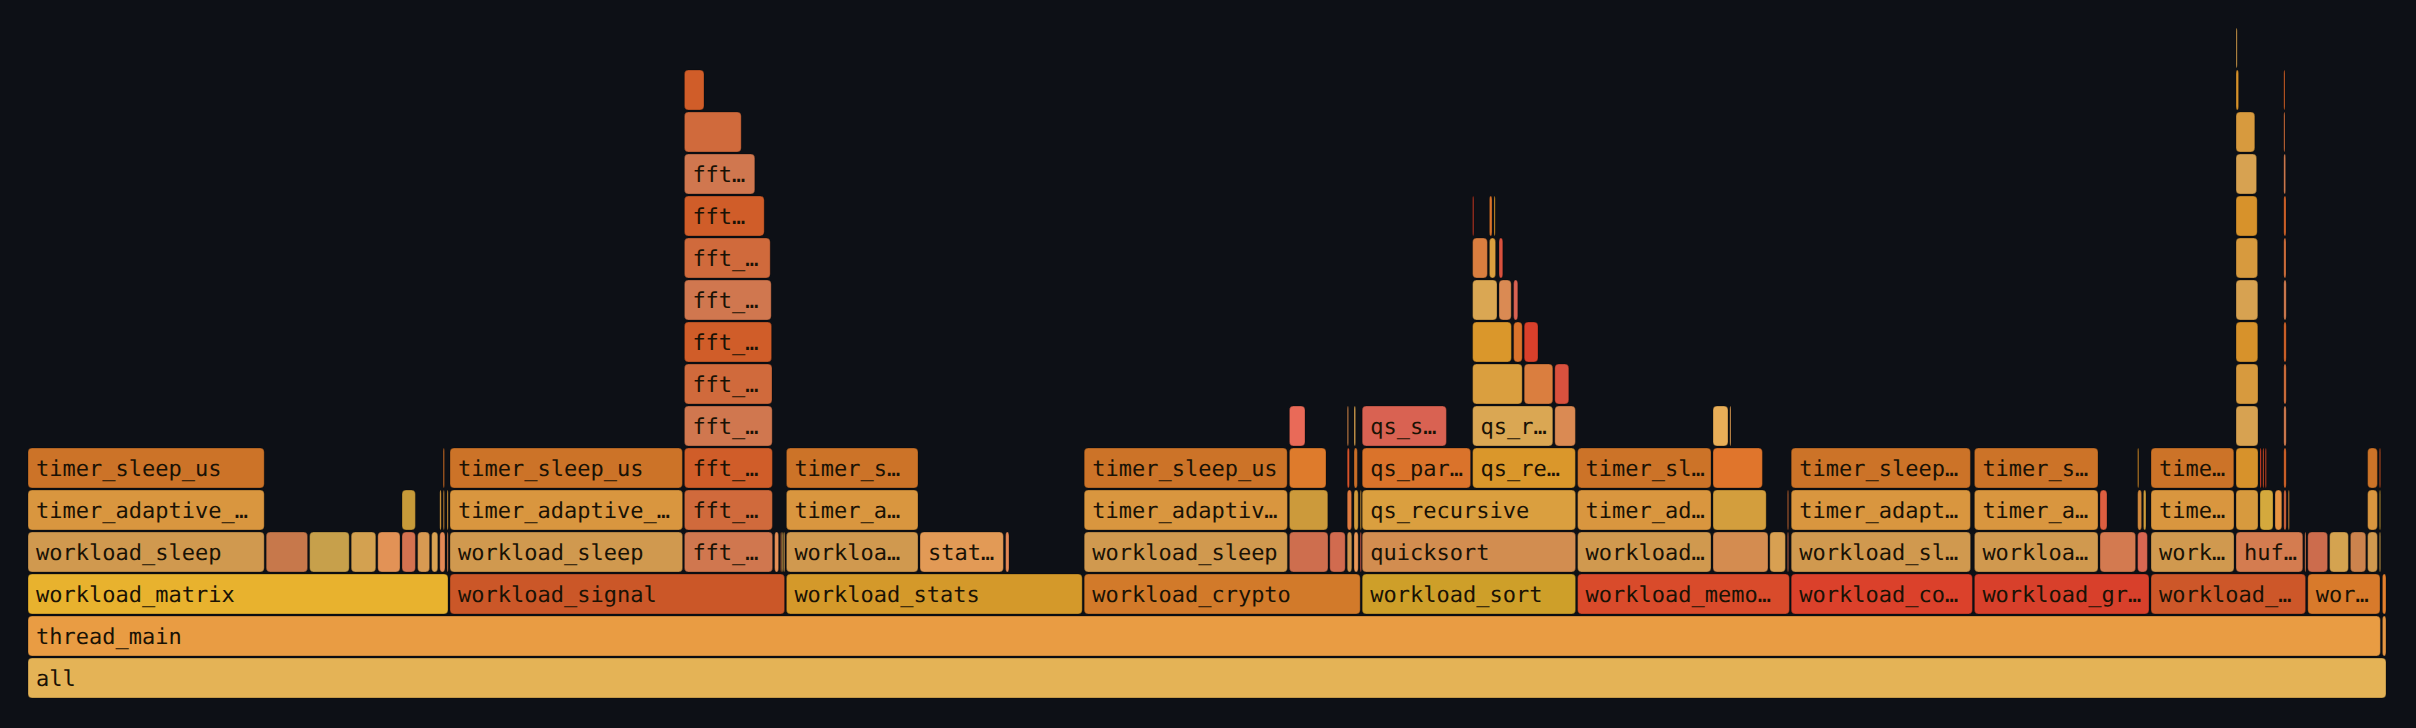
1,000,000 events across 26 threads, exported with callsight analyze --format folded.
Profiling a large C/C++ codebase usually means a bad trade: sample it and miss the rare-but-slow path, or instrument everything and drown in millions of events per second.
callsight moves that decision to compile time. One trace.config next to
your code says which files, folders, or call subtrees get entry/exit hooks.
Selected code is traced exactly — every call counted and timed. Everything else
emits no hook at all: no call, no flag check, no branch. Not a filter that
runs fast — an instruction that was never generated.
Adopting it changes no line of your source: one config file, one include in your build, and a separate instrumented profile beside your normal build.
Quick start
uv tool install callsight              # 1. install (Python stdlib only)

cd /path/to/your/project
callsight init .                       # 2. adopt — prints your build wiring

make instrument                        # 3. build the instrumented profile
TRACE_ENABLE=1 TRACE_MAX=1000000 ./bin/yourapp.instr

callsight analyze traces/ --exe ./bin/yourapp.instr --top 20   # 4. read it
callsight init copies a dependency-free C runtime and the Make or CMake
wiring into callsight/, writes a starter trace.config, and prints the exact
snippet to paste. Your normal make still produces a binary with zero hooks in
it. Full walkthrough: Getting started.
What you get
events=1000000 threads=26 functions=139 span=48.7ms unmatched_exits=0 unclosed_enters=136

== TOP BY SELF TIME ==
     calls      incl_ms      self_ms       max_ms  function (first location)
       272      529.382      529.382        9.983  timer_sleep_us (src/utils/timer.c:38)
    127048       52.470       52.470        6.643  qs_swap (src/sort/quicksort.c:5)
     57284      366.418       35.370        5.738  fft_recursive (src/signal/fft.c:63)
    104870       33.523       33.523       10.017  stats_running_push (src/stats/statistics.c:84)
      3195       60.699       30.238       18.485  qs_partition (src/sort/quicksort.c:23)
Calls, inclusive, self and max time per function, matched per thread, with
symbols — static functions included — resolved through addr2line.
unmatched_exits=0 means the trace is clean.
Two more output modes, for when a table isn't the right shape:
callsight analyze traces/ --exe ./app --format folded > out.folded
flamegraph.pl out.folded > out.svg          # or open out.folded in speedscope.app

callsight analyze traces/ --exe ./app --format json --top 0 | jq '.rows[0]'
Traces are streamed rather than loaded, so a multi-million-event run costs a few MB of analyzer memory instead of gigabytes. More on reading the numbers: Analysis.
Choosing what to trace
Event volume is the whole game. trace.config is where you win it:
include src/network/          # only this subsystem
exclude src/network/crc.c     # except the chatty helper
exclude-func log_printf       # and this one, by name

include-func handle_request   # or: one entry point + everything it calls
include-func resolves your call graph statically from the sources, so naming
one entry point instruments exactly its subtree and nothing else. Check any
selection before you build:
callsight scan . --config trace.config          # 35 sources: 34 instrumented, 1 excluded
callsight select src/ --function handle_request # 31 functions across 6 files
The practical loop: run wide once, sort the report by calls, exclude the
chatty leaf helpers, rebuild. That typically cuts event volume 10–100× while
the structural picture gets clearer. Every directive and pattern rule:
Configuration.
How it works
callsight flagsturnstrace.configplus your source list into-finstrument-functionsand the matching compile-time exclude lists. Your build integration calls it on every build, so the selection is never stale.- The compiler emits
__cyg_profile_func_enter/exitcalls at the boundaries of selected functions. Excluded code emits nothing. - The runtime (
trace.c, itself compiled without the flag) appends 32-byte events to a per-thread buffer — no locks, no malloc, no I/O on the hot path — flushing totrace.<pid>.<tid>.binwhen full or at exit. It stays inert unlessTRACE_ENABLE=1. callsight analyzestreams those files, matches enter/exit per thread, resolves symbols, and prints, exports, or serves the result.
Internals, the event record, and a survey of every GCC/Clang instrumentation mechanism: Architecture.
Web UI
uv tool install 'callsight[ui]'
callsight ui                           # http://127.0.0.1:8321
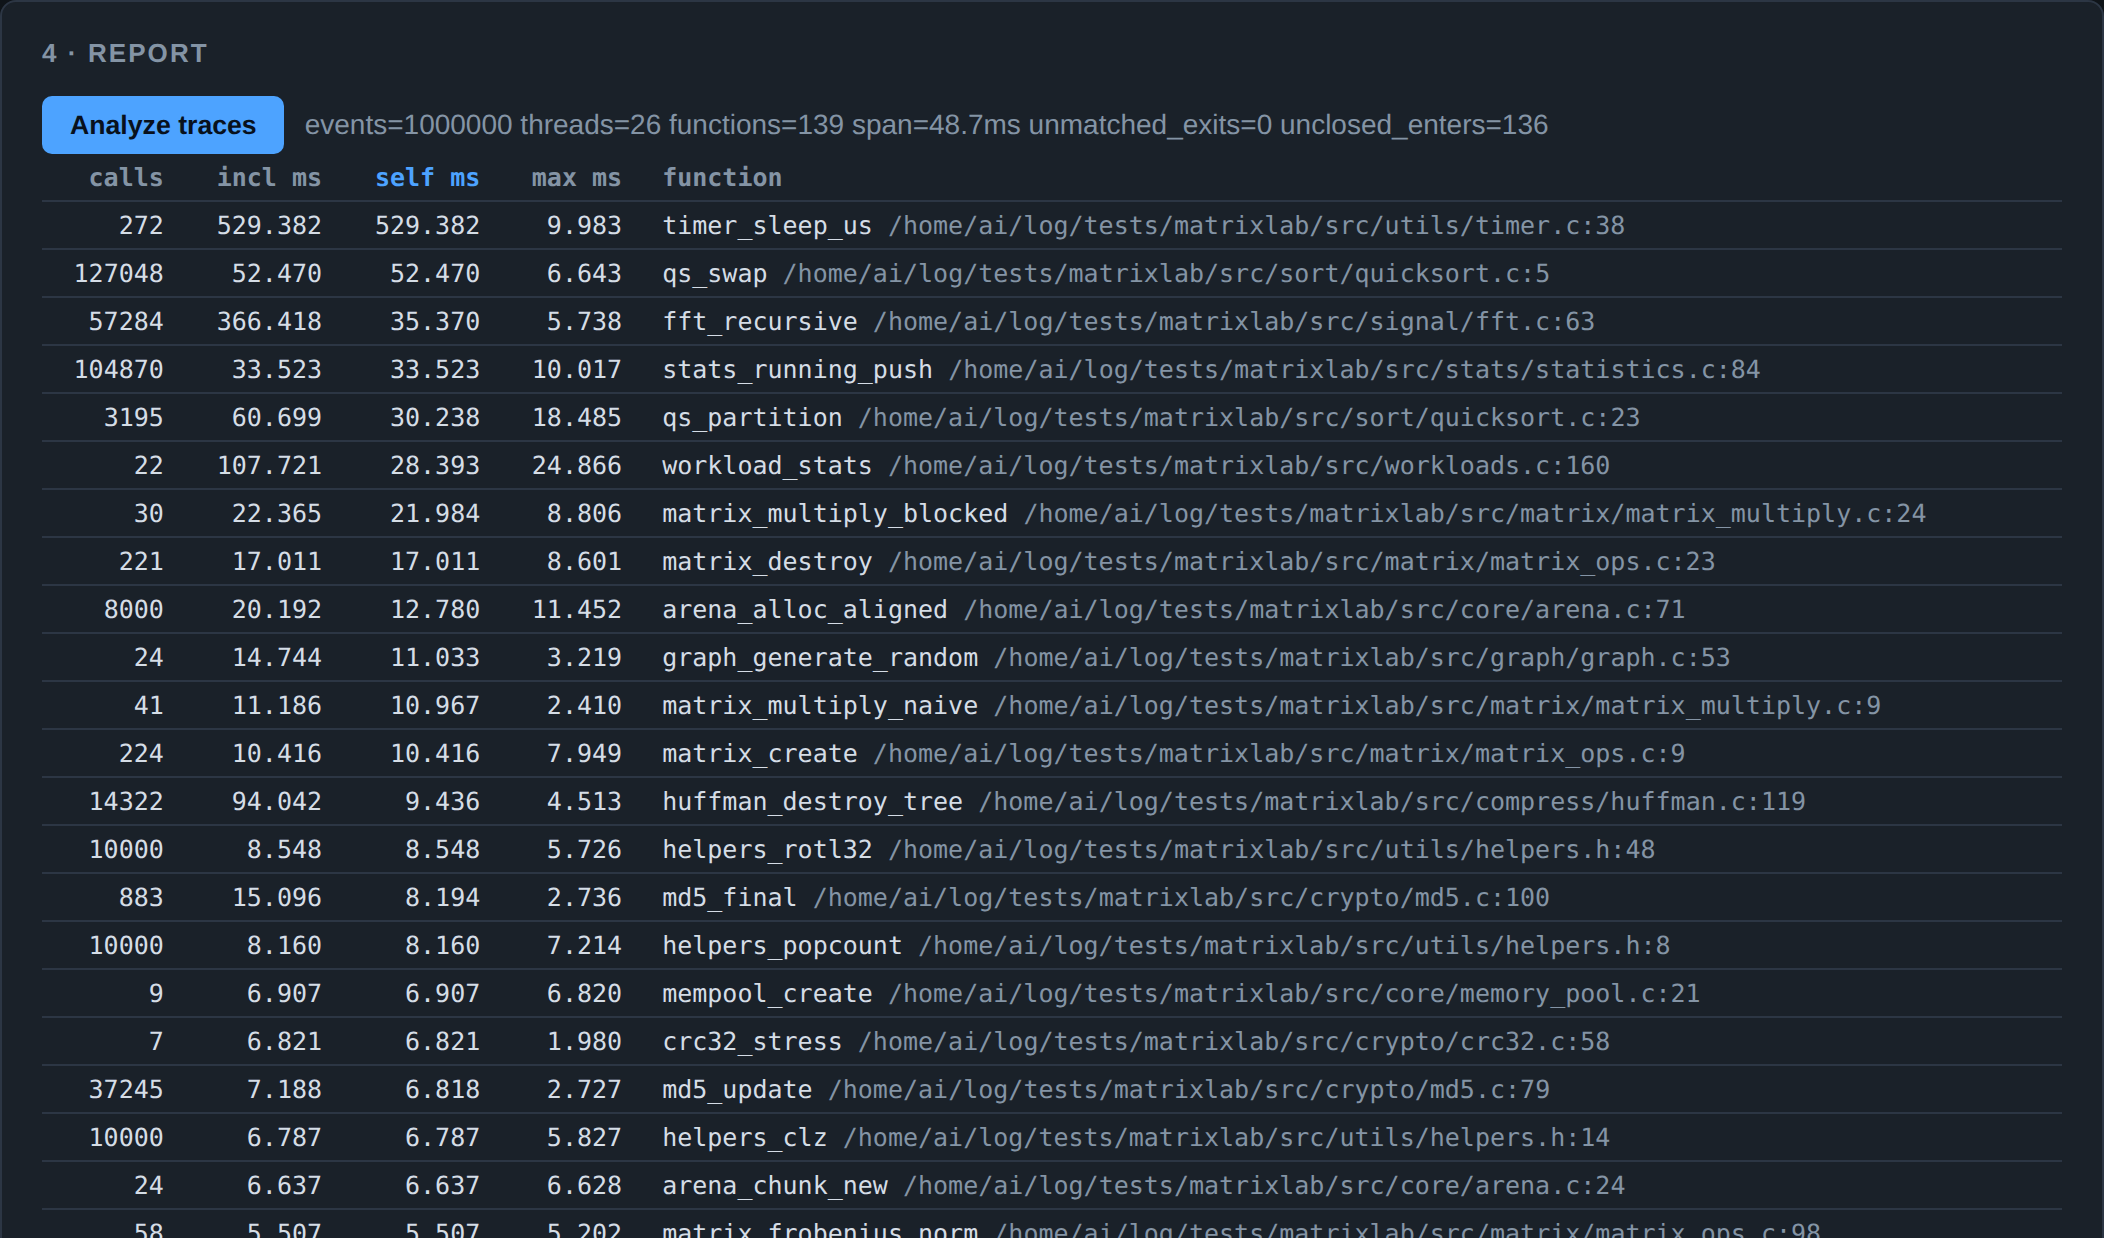
The whole loop in a browser: browse to a project, edit trace.config with a
live selection preview, build, run with tracing on, and read a sortable hotspot
table. A second tab builds the config by clicking — it enumerates every source
file and function (via ctags, auto-downloaded when the system has none, with a
regex fallback) into searchable checkbox panes. No root; binds to localhost.
More.
Remote streaming
On a constrained device you can't accumulate trace files. Streaming mode keeps nothing on the device: the runtime flushes into a POSIX shared-memory ring, and a tiny static C client ships it ZSTD-compressed over raw TCP.
callsight serve                        # analysis host; needs callsight[stream]

callsight init --stream /path/to/project           # adds trace_stream.c + zstd.c
cc -O2 -o callsight/trace_stream callsight/trace_stream.c callsight/zstd.c
./callsight/trace_stream /callsight0 <server-ip> 9001 &
TRACE_ENABLE=1 TRACE_SHM=/callsight0 ./yourapp.instr
The traced process does no disk or network I/O — only a shared-memory memcpy per batch. If the ring fills faster than the client drains it, events are dropped and counted, never blocking your workload, and the server reports the count. The server writes standard trace files, so analysis is unchanged. More.
How it compares
| tool | granularity | selection | needs |
|---|---|---|---|
| callsight | every entry/exit, exact timing | compile time, from one config file — excluded code emits no hook at all | rebuild with GCC |
| uftrace | same mechanism, richer live TUI and replay | mostly runtime filters (-F/-N), so filtered functions still pay for the hook |
rebuild (-pg / -finstrument-functions) |
perf record |
sampled, statistical | none needed | no rebuild; often root or perf_event_paranoid |
gprof (-pg) |
sampled + call counts | none | rebuild; single-threaded accounting |
| Clang XRay | entry/exit with runtime patching | per-function attributes and lists | rebuild, Clang only |
Reach for perf first when you want a cheap statistical profile of a whole
system. Reach for callsight when you need exact per-call timing for a chosen
subsystem — every call counted, nothing sampled — and you want the functions you
didn't choose to cost exactly nothing.
Requirements
- Linux. The runtime uses
SYS_gettid,pthread_getname_npand POSIX shared memory. - GCC for selective instrumentation. Clang implements
-finstrument-functionsbut not the exclude lists it builds on (LLVM #15627), so under Clang only an unfiltered "instrument everything" config compiles. callsight detects the toolchain and tells you before the build starts instead of failing one file at a time. - binutils (
addr2line) for symbol resolution, and Python 3.9+ with uv. The core is stdlib-only; the web UI and the streaming server are optional extras.
CLI
| command | purpose |
|---|---|
callsight init <dir> [--build make|cmake] [--stream] |
adopt into a project |
callsight scan <dir> [--config c] |
preview what a config selects |
callsight select <dir> --function F [--depth N] |
show a call subtree; emit config lines |
callsight analyze [traces/] [--exe bin] [--top N] [--format text|json|folded] |
hotspot report, JSON, or collapsed stacks |
callsight flags --config c -- srcs... |
print compiler flags (build integrations use this) |
callsight ui [--host H] [--port P] |
web UI (needs callsight[ui]) |
callsight serve [--host H] [--port P] [--out dir] |
TCP server for remote streams (needs callsight[stream]) |
callsight provision [--force] |
download the bundled static ctags |
Every flag: Reference.
Known limitations
- Inlined functions emit no hooks — there is no call boundary to hook.
- ~30–60 ns per event. This is a profiling build, not a production one.
- A crashed or killed process loses each thread's buffered tail. Clean exits flush everything.
- The compiler's exclude matching is substring-based, so unusually overlapping directory or symbol names can over-match. callsight guards its auto-generated function excludes against this and warns.
- Link with
-no-pieso recorded addresses match link addresses. Both build integrations do;analyzewarns when most addresses fail to resolve. - Static call-graph resolution does not follow function pointers, macro-generated calls, or C++ dynamic dispatch.
Project
- Docs: https://harshithsunku.github.io/callsight/
- Status & roadmap: STATUS.md
- Conventions, build and smoke-test commands: AGENTS.md
- Try it without adopting anything:
tests/matrixlab/is a multi-threaded C11 workload that doubles as the end-to-end fixture — the traces and flame graph in these docs come from it.
Issues and pull requests welcome. MIT licensed.
1 maintainer

Download files
Download the file for your platform. If you're not sure which to choose, learn more about installing packages.
Source Distribution
Built Distribution
Filter files by name, interpreter, ABI, and platform.
If you're not sure about the file name format, learn more about wheel file names.
Copy a direct link to the current filters
File details
Details for the file callsight-0.3.1.tar.gz.
File metadata
- Download URL: callsight-0.3.1.tar.gz
- Upload date:
- Size: 6.5 MB
- Tags: Source
- Uploaded using Trusted Publishing? Yes
- Uploaded via:
twine/7.0.0 CPython/3.13.14
File hashes
| Algorithm | Hash digest | |
|---|---|---|
| SHA256 |
b4bb48842f2db21bc85649730c4e8b19ec21dafd8c4307fc6270000a78b7cbce
|
|
| MD5 |
e8893a672b9186f97caf2d72cb362d94
|
|
| BLAKE2b-256 |
06e91048888564b8bba2912ee5c3df95436d7b22bafc1d20adf2541a6e3a81eb
|
Provenance
The following attestation bundles were made for callsight-0.3.1.tar.gz:
Publisher:
release.yml on harshithsunku/callsight
-
Statement:
-
Statement type:
https://in-toto.io/Statement/v1 -
Predicate type:
https://docs.pypi.org/attestations/publish/v1 -
Subject name:
callsight-0.3.1.tar.gz -
Subject digest:
b4bb48842f2db21bc85649730c4e8b19ec21dafd8c4307fc6270000a78b7cbce - Sigstore transparency entry: 2490122412
- Sigstore integration time:
-
Permalink:
harshithsunku/callsight@761cc59afa8025b174bfd623a68cc3c09dabeba6 -
Branch / Tag:
refs/tags/v0.3.1 - Owner: https://github.com/harshithsunku
-
Access:
public
-
Token Issuer:
https://token.actions.githubusercontent.com -
Runner Environment:
github-hosted -
Publication workflow:
release.yml@761cc59afa8025b174bfd623a68cc3c09dabeba6 -
Trigger Event:
push
-
Statement type:
File details
Details for the file callsight-0.3.1-py3-none-any.whl.
File metadata
- Download URL: callsight-0.3.1-py3-none-any.whl
- Upload date:
- Size: 585.0 kB
- Tags: Python 3
- Uploaded using Trusted Publishing? Yes
- Uploaded via:
twine/7.0.0 CPython/3.13.14
File hashes
| Algorithm | Hash digest | |
|---|---|---|
| SHA256 |
5fa39a42f8742716bf09f004963af675dc7ad4bf7476791c0b3346fc2fb094c3
|
|
| MD5 |
f4bb462c954689e4c0fd34421a58523d
|
|
| BLAKE2b-256 |
cf59bb10ffba8bf4c6a6e2766acba2a88808b99e5020421889fa731d92b37f1d
|
Provenance
The following attestation bundles were made for callsight-0.3.1-py3-none-any.whl:
Publisher:
release.yml on harshithsunku/callsight
-
Statement:
-
Statement type:
https://in-toto.io/Statement/v1 -
Predicate type:
https://docs.pypi.org/attestations/publish/v1 -
Subject name:
callsight-0.3.1-py3-none-any.whl -
Subject digest:
5fa39a42f8742716bf09f004963af675dc7ad4bf7476791c0b3346fc2fb094c3 - Sigstore transparency entry: 2490122420
- Sigstore integration time:
-
Permalink:
harshithsunku/callsight@761cc59afa8025b174bfd623a68cc3c09dabeba6 -
Branch / Tag:
refs/tags/v0.3.1 - Owner: https://github.com/harshithsunku
-
Access:
public
-
Token Issuer:
https://token.actions.githubusercontent.com -
Runner Environment:
github-hosted -
Publication workflow:
release.yml@761cc59afa8025b174bfd623a68cc3c09dabeba6 -
Trigger Event:
push
-
Statement type:







