
Capex Atlas






Source-linked models of hyperscaler capital deployment, built from SEC filings.
Alphabet spent $91.4 billion on property and equipment in fiscal 2025, against $21.1 billion of depreciation. Whether that spending earns its cost of capital depends on utilization, pricing, asset life, and how long a data centre takes to fill. No hyperscaler discloses any of them.
So Capex Atlas does not estimate the return. It computes what would have to be true for a stated claim to hold, and marks every figure by how much evidence stands behind it.
Status: v0.2.0. Alphabet, Microsoft and Meta, end to end: ingestion, reconciliation, metrics, a capital-vintage engine, analysis bundles, a CLI and a Streamlit lab. Segment figures are unavailable from the SEC endpoint used; see Limits.
Not advice. This is educational software. It is not investment, legal, tax or accounting advice, carries no warranty of accuracy or completeness, and its authors accept no liability for any loss arising from its use. It publishes no ratings, price targets or recommendations. Verify every figure against the filings it cites. Read DISCLAIMER.md before relying on anything here.
Quickstart
The repository ships a worked analysis, so the first useful command needs no network and no credentials.
git clone https://github.com/jman4162/capex-atlas && cd capex-atlas
uv sync --group dev
uv run capex-atlas audit examples/googl-2025fy
GOOGL 2025FY: 14 values checked, 0 errors, 0 warnings
That is the acceptance test. It walks every published figure and exits non-zero if any one of them lacks a calculation node, a resolvable source, or a registry-backed assumption. Point it at a tampered bundle and it fails.
Open the same analysis in the lab:
uv run capex-atlas app
Or build a fresh one from SEC:
export CAPEX_ATLAS_SEC_USER_AGENT="you (you@example.com)"   # SEC asks who is calling
uv run capex-atlas analyze GOOGL --through 2025FY --facts used -o build/googl-2025fy
uv run capex-atlas verify build/googl-2025fy      # rebuild from source and confirm it reproduces
The question it is built to answer
Management says servers pay back in under three years. What would have to be true?
$ capex-atlas app        # Vintage simulator -> Run scenario

○ net present value        1,195.86 USD
○ internal rate of return  0.140958
○ payback period           3.444072 years

What must be true for a three-year payback?
  No utilization between 0.05 and 1 reaches payback_years of 3. On these
  assumptions the claim cannot hold anywhere in the plausible range.

What the answer rests on, most sensitive first:
  revenue_yield     moves NPV by  5,036
  operating_margin  moves NPV by  4,295
  lead_time_years   moves NPV by  2,551
The refusal is the useful answer. Utilization is capped at 100%, and even there the ramp keeps
payback above three years, so the ramp is the binding constraint and no amount of demand fixes it.
The ○ marks say every one of those figures is a what-if.
What the analysis looks like
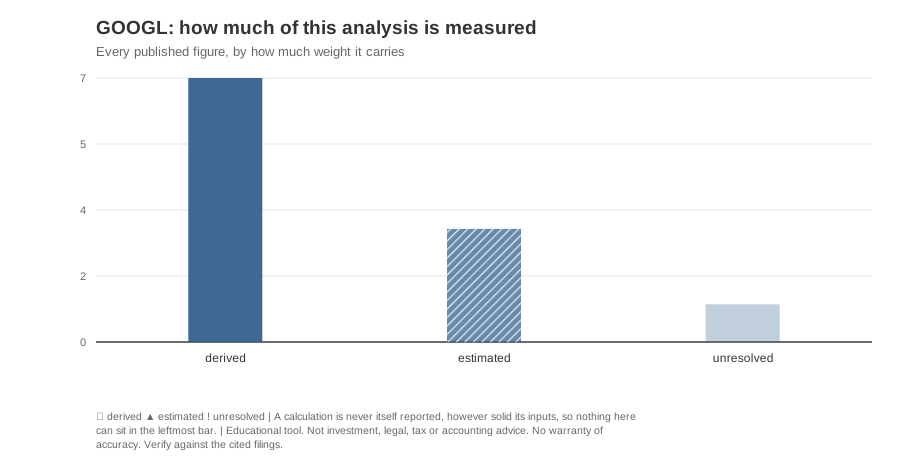 |
Every published figure, sorted by how much weight it carries. Seven are derived from reported facts alone, three depend on a tax rate nobody discloses, and one cannot be computed at all. A reader can see the shape of the evidence before reading a single number. |
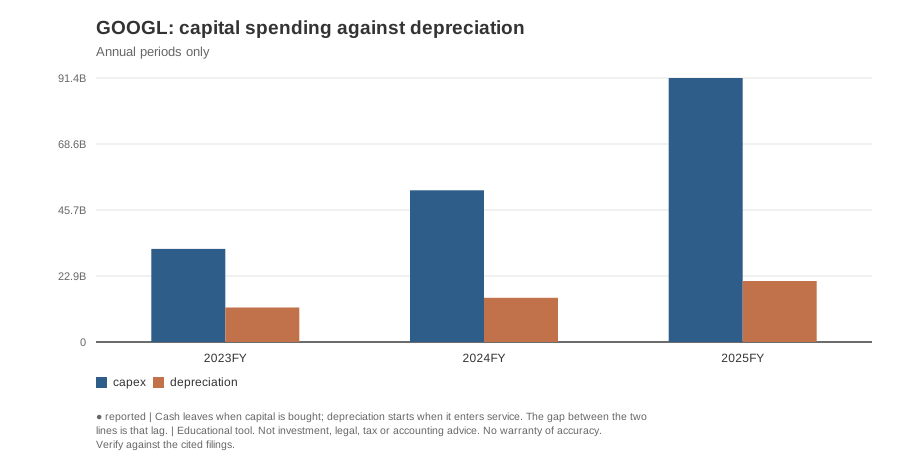 |
Cash leaves when capital is bought; depreciation starts when it enters service. The widening gap is that lag, and it is why a build-out crushes free cash flow years before it touches reported profit. |
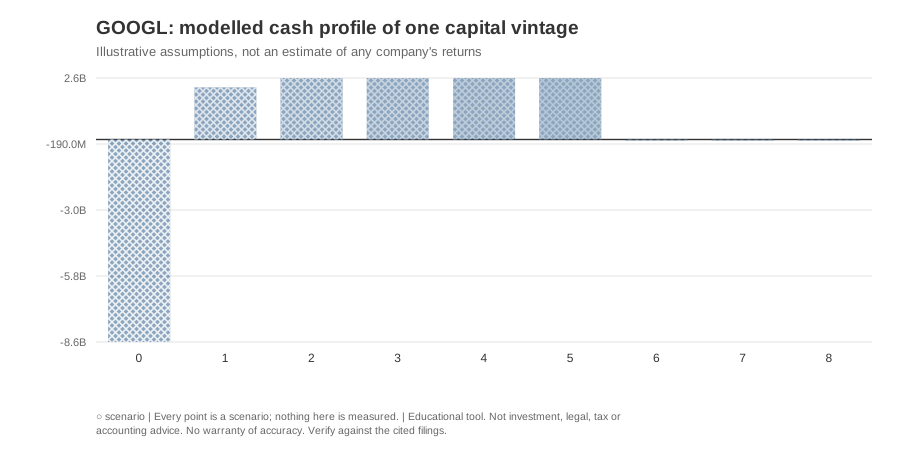 |
One vintage of capital followed through its life: committed in year zero, earning as utilization ramps, retired at end of life. Hatched and faded because every point is a scenario. |
Figures are generated from the committed example by scripts/generate_readme_figures.py, and CI
fails if they drift from the code that produced them.
The two mechanisms
Most of the package is ordinary data engineering. Two things carry the design.
Evidence status propagates automatically. Every value is reported, derived, estimated,
scenario or unresolved, and every calculation degrades to its weakest input:
reported_fcf(cfo, capex)  # both reported          -> ◆ derived
roic(nopat_at_statutory_rate, capital)  # a rate nobody discloses -> ▲ estimated
payback(capex, utilization_ramp)  # a ramp you chose        -> ○ scenario
A calculation is never itself reported, however solid its inputs. Anything touching an undetermined input comes out undetermined rather than silently collapsing to zero. When Alphabet does not tag disposal proceeds, standardized free cash flow returns a dash rather than a number that looks right. You cannot render a figure without also knowing how much weight it carries.
Assumptions carry citations or they do not exist. No model parameter may be a literal in a function body. Each is a registry entry with a declared basis:
| basis | requires | confers |
|---|---|---|
filing_disclosure |
an accession and a quotable passage | ● reported |
derived_from_facts |
no fixed value; computed at runtime | ◆ derived |
published_third_party |
a citable URL | ▲ estimated |
user_input |
nothing; any stored value is illustrative | ○ scenario |
There is deliberately no judgement basis. An unsourced prior can only enter as user_input, which
marks every downstream number as a what-if. A CI check walks the AST of the modelling layer and
fails the build on any uncited constant.
A disclosed range is not a disclosed value. Alphabet says servers run six years; Microsoft says two to six. Both carry a range entry and a point entry, and the basis records which of them the filing actually supports.
Coverage
| fiscal year ends | capex intensity | capex ÷ depreciation | ROIC (operating) | |
|---|---|---|---|---|
| Alphabet | 31 December | 22.7% | 4.33× | 20.7% |
| Microsoft | 30 June | 34.9% | 3.38× | 20.8% |
| Meta | 31 December | 34.7% | 3.87× | 20.3% |
Fiscal 2025 for Alphabet and Meta, fiscal 2026 for Microsoft. ▲ estimated: the returns use a statutory tax rate, because no filer discloses its marginal cash rate on incremental capital.
The three are deliberately unlike each other, and the table shows why headline comparison is a trap. Microsoft's fiscal year ends in June, so its 2026Q2 and Alphabet's cover different months. Meta sells no cloud capacity at all, so no segment exists to divide its data-centre spending into, and capex intensity there is not the measure it is at the other two. Those differences are why the package models fiscal calendars and concept vocabularies per filer instead of assuming one shape fits all.
Oracle later. Amazon and AWS are out of scope, stated up front rather than left as a gap for readers to interpret: the author works at AWS, and publishing models of an employer's capital returns is a conflict better avoided than managed. DISCLOSURE.md gives the full reasoning, including what the exclusion costs.
What it is, and what it is not
It is a financial compiler: filings in, a normalized intermediate representation, then metrics, scenarios and charts that all keep a link back to the source. The artifact it produces is an analysis bundle: a frozen, auditable file, so a conclusion written against it stays reproducible and, when it changes, the diff says why.
It is not a stock screener or a ratio library. Existing tools already compute broad sets of ratios; this one is narrower and more opinionated, and models the questions the AI build-out raises: capital vintages, servers versus buildings, capacity lead times, depreciation lag.
It is not an AI equity analyst. Python calculates; the agent layer, when it lands, will discover, classify and explain, and will never compute or overwrite a financial fact.
Limits
Public accounts cannot identify a clean causal return on AI investment, so the honest output is conditional: under these disclosed facts and these explicit assumptions, the implied return range is X to Y percent, and the sensitivity that dominates is utilization.
- No segment figures. The SEC Company Facts endpoint flattens away XBRL dimensions, so Google Cloud revenue and operating income cannot be read from it even though Alphabet reports them. Reaching them needs the filing's XBRL instance. The adapter says so rather than returning an empty list that would read as "this company has no segments".
- No single maintenance-capex number, no single "correct" ROIC, and no forced AI/non-AI capex split. Where practice disagrees, the package offers named alternatives; where attribution is not disclosed, "unallocated" stays unallocated.
- No ratings, price targets or recommendations, ever.
METHODOLOGY.md states every definition offered and why more than one is offered.
Install
pip install capex-atlas           # library and CLI
pip install "capex-atlas[app]"    # + the Streamlit lab and a worked example
The app extra ships the lab and a worked analysis, so capex-atlas app works with no checkout.
From source:
uv sync --group dev
Development
uv run ruff check . && uv run ruff format --check .
uv run mypy src/
uv run lint-imports             # layer boundaries
uv run pytest
./scripts/slopcheck.sh          # prose: slopscore + slopless
lint-imports enforces the layering that would otherwise require splitting this into separate
distributions: schemas depend on nothing internal, the calculation layer performs no I/O, and nothing
in src/ imports the app.
Contributing
See CONTRIBUTING.md. It documents the two rules that are easier to break than the code: the AST scan that fails the build on any uncited constant in the modelling layer, and the cross-company symmetry check that stops one filer getting analytical treatment its peers lack.
Status
v0.2.0 — first release on PyPI. Alphabet, Microsoft and Meta. Evidence-status propagation, the citation-enforced assumption registry, SEC ingestion, reconciliation identities, three named free-cash-flow definitions and several named returns, the capital-vintage engine with its what-must-be-true solver, analysis bundles with audit and diff, a Streamlit lab, and OpenTelemetry behind an optional extra with an enforced metadata-only attribute policy.
Full history in CHANGELOG.md.
Citing
See CITATION.cff, which GitHub's Cite this repository button renders as BibTeX or APA.
Licensing
Code is Apache-2.0. Original documentation and diagrams are CC BY 4.0 (LICENSE-docs). Source
documents retain their own terms; the package bundles no proprietary market data, consensus estimates
or paywalled transcripts.
Disclosure
The author works at Amazon Web Services. Capex Atlas is a personal project, built on personal time and equipment, using only public filings and disclosures, with no confidential or non-public information. It is not affiliated with, endorsed by, or speaking for any company it analyzes. Amazon and AWS are excluded from coverage entirely.
Model parameters are citation-enforced and treatment across companies is symmetric by test rather than by assurance. DISCLOSURE.md covers how that is checked and why it is built this way.
1 maintainer

Download files
Download the file for your platform. If you're not sure which to choose, learn more about installing packages.
Source Distribution
Built Distribution
Filter files by name, interpreter, ABI, and platform.
If you're not sure about the file name format, learn more about wheel file names.
Copy a direct link to the current filters
File details
Details for the file capex_atlas-0.2.0.tar.gz.
File metadata
- Download URL: capex_atlas-0.2.0.tar.gz
- Upload date:
- Size: 340.2 kB
- Tags: Source
- Uploaded using Trusted Publishing? Yes
- Uploaded via: twine/7.0.0 CPython/3.13.14
File hashes
| Algorithm | Hash digest | |
|---|---|---|
| SHA256 |
258954382594c37beacdf7f96bc5040c7e46f922abf0ba1b769cc532d918294c
|
|
| MD5 |
34e8c9e94d76db2fedf3eca054d20617
|
|
| BLAKE2b-256 |
056c7c29469e464a783961d77e26db53c47c21588456de3843f3741f3ee691a3
|
File details
Details for the file capex_atlas-0.2.0-py3-none-any.whl.
File metadata
- Download URL: capex_atlas-0.2.0-py3-none-any.whl
- Upload date:
- Size: 135.2 kB
- Tags: Python 3
- Uploaded using Trusted Publishing? Yes
- Uploaded via: twine/7.0.0 CPython/3.13.14
File hashes
| Algorithm | Hash digest | |
|---|---|---|
| SHA256 |
6b05f278564425626261f2eec683deb98ab9bc7afa468500f0483b124b9cae1e
|
|
| MD5 |
687d9c1c2d7b08e2aa546c38a51ca00e
|
|
| BLAKE2b-256 |
7652be0dcfc31440c3b3bcecf16620548e82fd47d19d20516cafd2add4ad288c
|







