
cast
Build live, notebook-backed presentations from Python functions.




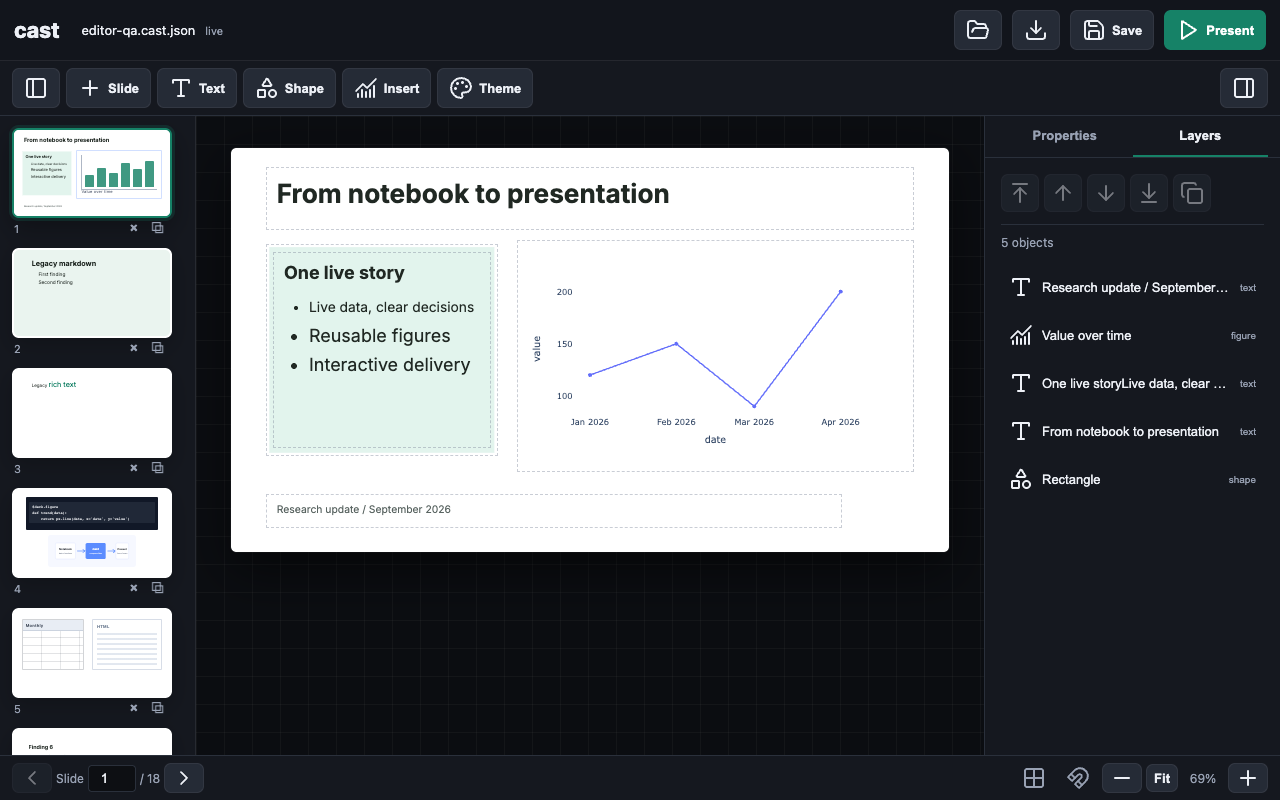
The cast editor — a Plotly figure, a scrollable data table, a vector image, and rich text arranged on the canvas, with the selected block's controls in the inspector. Every asset comes from a decorated notebook function.
Project note: This repo is vibe coded, and the frontend in particular — the in-browser canvas editor and everything it renders — was built by iteration rather than by a dedicated frontend engineer. It is experimental and fast-moving, so expect rough edges alongside the parts that work well.
What it does
The usual path from analysis to slides means exporting a chart, pasting it into a deck, and repeating the whole process whenever the data changes. cast removes that step. You decorate the functions you have already written, and they become building blocks on a live web canvas. You arrange those blocks, add text, images, and shapes, and present — and when the underlying data changes, the slides update without a reload.
import cast, polars as pl, plotly.express as px

deck = cast.Cast("sales.cast.json")  # opens this workspace, or creates it
deck.serve()                          # live editor in a background thread

@deck.data                         # returns a polars LazyFrame -> a data source
def sales():
    return pl.scan_parquet("sales.parquet")

@deck.figure                       # a factory: takes one table, returns a Plotly figure
def trend(tbl):
    df = tbl.select(["month", "revenue"]).collect()
    return px.line(df, x="month", y="revenue", markers=True)

# Build the deck in the browser; no registration call is needed.
That is the entire program. Open the printed URL, add the trend figure with
the sales table, and it appears on a slide.
Install
pip install cast-func
cast requires Python 3.9 or newer. The runtime dependencies — fastapi,
uvicorn, polars, plotly, numpy, pandas, pyarrow, and notebook —
are installed automatically. The package is imported as cast:
import cast
The decorators
Everything on a slide begins as a decorated function in the notebook. Create a
workspace with deck = cast.Cast("talk.cast.json"), then use its decorators.
Registration happens when the function is defined, and each decorated function
still returns its original value, so existing notebook code is unaffected. Every
decorator supports both the bare form (@deck.data) and the parameterized form
(@deck.data(name=..., title=...)). The same decorators are importable at module
level (cast.data, cast.figure, cast.html, cast.image); deck.data and
cast.data are interchangeable.
| Decorator | The function returns | Registered as |
|---|---|---|
@deck.data |
a polars.LazyFrame |
a data source that feeds figures and table blocks |
@deck.figure |
(factory) a Plotly figure from a table | a chart that can be rebound to any table |
@deck.html |
an HTML string (or an object with _repr_html_) |
a sandboxed iframe block |
@deck.image |
a path, bytes, SVG, or data URI | an original-quality image asset |
@deck.data
@deck.data
def sales():
    return pl.scan_parquet("sales.parquet")

@deck.data(title="Q2 Forecast")
def forecast():
    return pl.scan_parquet("forecast.parquet")
The decorator registers the table immediately and resolves its LazyFrame
lazily when a figure or table block first needs it. Calling the function remains
optional; calling it again refreshes every slide that uses it, live, with no
reload or re-export. Data sources feed
both figures and table blocks. Table blocks render with sticky column headers,
horizontal and vertical scrolling, optional row numbers and stripes, and a
preview limit of up to 1,000 rows; the same scrollable table is preserved in
present mode and in exports.
@deck.figure
@deck.figure(title="Value over time")
def trend(tbl):
    df = tbl.select(["date", "value"]).collect()
    return px.line(df, x="date", y="value", markers=True)
@deck.figure registers a factory at decoration time, not a rendered chart —
you do not pass a table in the notebook. In the browser you add the figure to
the inventory and choose which table feeds it, and you can add the same factory
again with a different table. Each instance has its own table dropdown; picking a
table re-runs the figure function on the server against that data. If the chosen
table is incompatible, the block shows the error inline and invites another
choice rather than crashing.
@deck.html
@deck.html(title="Callout")
def callout():
    return "<h2>Custom HTML</h2><button onclick=\"this.textContent='clicked'\">Click</button>"
@deck.html registers a custom HTML object at decoration time. Add it from the
HTML dropdown to insert the returned markup into a sandboxed iframe block. This
is useful for small widgets, controls, styled notes, or visualization snippets
that are not Plotly figures. Objects exposing _repr_html_() are also accepted.
@deck.image
from pathlib import Path

@deck.image(title="Study design", alt="Diagram of the study workflow")
def study_design():
    return Path("figures/study-design.svg")  # PNG, JPEG, bytes, SVG, and data URIs also work
@deck.image registers publication-quality image assets at decoration time. The
function may return a PNG/JPEG/SVG file path, raw image bytes, SVG markup, a data
URI, or a notebook object with a PNG, JPEG, or SVG rich representation;
Matplotlib figures and Pillow images are accepted through their standard save
methods. The live app serves the original bytes without resizing or
recompression, so SVG remains vector and raster images keep their full
resolution. The inspector provides contain/cover/stretch behavior, a source
aspect-ratio action, smooth/crisp/pixel rendering, transparency, alt text,
corner radius, and opacity.
Composing the deck
Once assets are registered, the browser is a free-form canvas:
- Figures, tables, HTML, images, text, and shapes (rectangle, ellipse, triangle, line) can be placed anywhere on a 16:9 canvas.
- Blocks can be dragged, resized from any corner, rotated, and stacked in z-order; arrow keys nudge the selection and the Delete key removes it.
- The inspector's Arrange controls align a block to the canvas (left/center/right, top/middle/bottom), duplicate it, or send it back in the stack.
- Slides are managed from the rail on the left: add, reorder, delete, or duplicate a slide.
- Text boxes use slide-native rich text rather than Markdown. Editing happens on the same element used for presentation, so typography, wrapping, and spacing do not change between design and present modes; font, size, color, weight, alignment, and line height are set in the inspector, and double-clicking a text block edits it in place. The text style menu also includes a polished code treatment with monospace defaults, code-safe whitespace, and an editor-like frame that is preserved in present mode and frozen exports.
- A theme sets accent, background, foreground, and font once for the whole deck.
- Edits stream over Server-Sent Events, so multiple tabs and changing data stay in sync.
- Present mode is full-screen with arrow-key navigation, and figures remain interactive.
The editor is served by the small FastAPI application that deck.serve() starts
in a background thread. serve() is idempotent, so calling it more than once
does not start a second server.
Save, reopen, and export
deck = cast.Cast("talk.cast.json")    # load it, or create an empty workspace
deck.save()                           # atomically update talk.cast.json
deck.save(as_="talk-copy.cast.json") # write a copy; talk.cast.json stays active
deck.load()                           # reload the active workspace from disk
deck.freeze("talk.html")              # self-contained HTML, no server required
Cast(path) makes that JSON file the workspace source of truth. If the path
already exists it is validated and loaded; if it does not exist, cast creates a
new empty presentation there immediately. The editor's Save button performs
the same atomic update as deck.save(), so saving does not depend on a browser
download. Python reserves the word as, so Save As is spelled as_.
save and load round-trip an editable deck as human-readable JSON. The
document preserves slide order, text, geometry, styles, rotations, theme,
manually uploaded images, and references to decorated assets. It deliberately
does not serialize Python functions or data frames; rerun the notebook cells that
define those assets before reopening the deck. The editor's Open action can
load another JSON document into the current workspace; press Save to commit
it to the file originally passed to Cast.
freeze produces the shareable output: figures are pre-rendered to Plotly JSON,
images are embedded, and tables, text, and shapes are inlined into a single HTML
file with client-side slide navigation and still-interactive charts. It needs no
running server.
How it fits together
   NOTEBOOK  ->  decorate functions  ->  ASSET LIBRARY  ->  compose on the CANVAS  ->  present / freeze
  (your data)    @data @figure           (tables, figures,   (arrange, style, theme)    (live or portable)
                 @html @image             html, images)
The notebook is the source of truth for data and logic; the bound .cast.json
workspace is the source of truth for layout. cast keeps the two in sync.
Run the example
python examples/demo.py
Then open http://127.0.0.1:8000. Add the trend figure with the monthly
table, add it again with daily, try the deliberately incompatible wide table
to see the inline error, and add the HTML callout and the vector workflow image.
The full source is in examples/demo.py.
API reference
| Call | Description |
|---|---|
cast.Cast(path) |
Open an existing .cast.json workspace or create a new one. |
deck.serve(port=8000, host="127.0.0.1", open=False) |
Start the editor in a background thread and return the URL; open=True embeds an IFrame in a notebook. Idempotent. |
@deck.data / @deck.data(name=, title=) |
Register a LazyFrame-returning function as a data source. |
@deck.figure / @deck.figure(name=, title=) |
Register a table -> Plotly figure factory. |
@deck.html / @deck.html(name=, title=) |
Register an HTML-returning factory for iframe blocks. |
@deck.image / @deck.image(name=, title=, alt=) |
Register an original-quality image asset. |
deck.save() / deck.save(as_=path) |
Update the active workspace or atomically write a separate copy. |
deck.load() |
Reload the active workspace (registered assets remain available). |
deck.freeze(path) |
Export a self-contained, portable HTML file. |
Notes and limitations
- The frontend is vibe coded and still settling; some interactions are rough.
- The page is built at import time. If you edit
cast/templates.py, restart the kernel or process to see the change — a browser refresh alone will not reload it. saveandloadstore references to decorated assets, not the Python behind them. Rerun the notebook cells that define the assets before callingload.
License
MIT. See LICENSE.
1 maintainer

Download files
Download the file for your platform. If you're not sure which to choose, learn more about installing packages.
Source Distribution
Built Distribution
Filter files by name, interpreter, ABI, and platform.
If you're not sure about the file name format, learn more about wheel file names.
Copy a direct link to the current filters
File details
Details for the file cast_func-0.3.1.tar.gz.
File metadata
- Download URL: cast_func-0.3.1.tar.gz
- Upload date:
- Size: 60.2 kB
- Tags: Source
- Uploaded using Trusted Publishing? No
- Uploaded via:
poetry/2.1.4 CPython/3.13.7 Darwin/24.5.0
File hashes
| Algorithm | Hash digest | |
|---|---|---|
| SHA256 |
74602d28450d0717bdc1de88312c758c927532a5eff833505205ed080e314231
|
|
| MD5 |
16e55a8bf200321044e2c1cd8f0abd96
|
|
| BLAKE2b-256 |
c9f2d95ace6f2008b0d2e99096aa45cec6172e68bc40f1e7d08a4b9a35e4e9eb
|
File details
Details for the file cast_func-0.3.1-py3-none-any.whl.
File metadata
- Download URL: cast_func-0.3.1-py3-none-any.whl
- Upload date:
- Size: 59.3 kB
- Tags: Python 3
- Uploaded using Trusted Publishing? No
- Uploaded via:
poetry/2.1.4 CPython/3.13.7 Darwin/24.5.0
File hashes
| Algorithm | Hash digest | |
|---|---|---|
| SHA256 |
996b04e82fb7db3b8cf400fbad6442dd04f77b810e7ce4aebee98418f00705a9
|
|
| MD5 |
34cb544490a78afbfec4eb2f4b3b5144
|
|
| BLAKE2b-256 |
827c8485b0593f612a426d5061ce7d519e9d80c409584319bebd7c5d811617f8
|














