CaTabRa-lib is a library with useful data-science-related functions and classes built atop scikit-learn

Project description
CaTabRa-lib
About • Quickstart • Documentation • References • Contact • Acknowledgments


About
CaTabRa-lib is a Python library with a couple of useful functions implemented on top of scikit-learn and other data-science libraries.
Highlights:
-
Thoroughly evaluate the performance of a machine learning model using a wide range of regression and classification metrics:
catabra.metricsAll classification metrics are applicable not only to binary, but also to multiclass and multilabel classification problems through micro, macro, weighted and samples averaging. Suitable decision thresholds can be determined automatically via a fixed set of thresholding strategies.
-
Obtain confidence intervals of performance metrics and other statistics using a seamlessly integrated and flexible bootstrapping mechanism:
catabra_lib.bootstrapping.Bootstrap -
Create appealing visualizations of the most frequently used data science assets (confusion matrix, ROC/PR curve, etc.) with one single command:
catabra_lib.plottingBoth Matplotlib and interactive plotly plots are supported.
-
Preprocess data by applying smart, fully scikit-learn-compatible preprocessing transformations:
catabra_lib.preprocessing
If you are interested in CaTabRa-lib, you might be interested in CaTabRa, too: CaTabRa is a full-fledged tabular data analysis framework that enables you to calculate statistics, generate appealing visualizations and train machine learning models with a single command. In fact, CaTabRa strongly depends on CaTabRa-lib.
Quickstart
CaTabRa-lib has minimal requirements (Python >= 3.6, scikit-learn >= 0.23) and can be easily installed using pip:
pip install catabra-lib
Once installed, CaTabRa-lib can be readily used.
Use-Case: Compute Detailed Classification Metrics
import numpy as np
from catabra_lib import metrics

y_true = np.array([0, 0, 1, 1, 0, 1, 0, 1, 1, 0, 0, 0] * 10)
y_score = np.array([0.1, 0.6, 0.8, 0.7, 0.9, 0.5, 0.4, 0.4, 0.5, 0.0, 0.2, 0.3] * 10)
Get plain ROC-AUC:
metrics.roc_auc(y_true, y_score)
0.7571428571428571
Employ bootstrapping to compute the 95% confidence interval:
metrics.bootstrapped(metrics.roc_auc, agg="ci.95")(y_true, y_score)
[0.6701300085251491, 0.8390148790494458]
Get sensitivity (= recall) at the (0,1) threshold:
metrics.thresholded(metrics.sensitivity, threshold="zero_one")(y_true, y_score)
0.8
Compute the 95% CI again, using 100 boostrapping repetitions. Construct the desired metric using fancy syntax:
metrics.get("sensitivity @ zero_one (ci.95:100)")(y_true, y_score)
[0.7189903846153847, 0.9543269230769222]
Use-Case: Plot Confusion Matrix and ROC-Curve
import numpy as np
from catabra_lib import metrics
from catabra_lib.plotting import mpl_backend    # Matplotlib backend

y_true = np.array([0, 0, 1, 1, 0, 1, 0, 1, 1, 0, 0, 0] * 10)
y_score = np.array([0.1, 0.6, 0.8, 0.7, 0.9, 0.5, 0.4, 0.4, 0.5, 0.0, 0.2, 0.3] * 10)
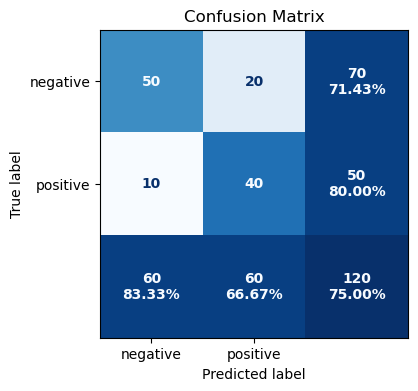
Plot the confusion matrix at the 0.5 decision threshold:
mpl_backend.confusion_matrix(
    metrics.thresholded(metrics.confusion_matrix, 0.5)(y_true, y_score),
    class_names=["negative", "positive"]
)
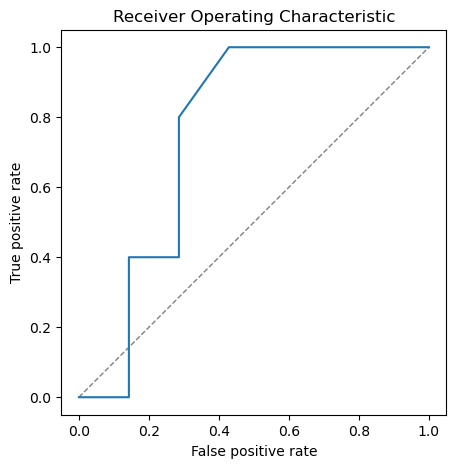
Plot the ROC curve:
mpl_backend.roc_pr_curve(y_true, y_score, from_predictions=True, roc=True)
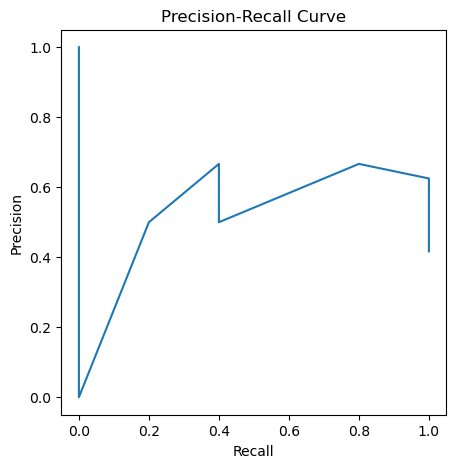
... and also the precision-recall curve:
mpl_backend.roc_pr_curve(y_true, y_score, from_predictions=True, roc=False)
Note: Matplotlib and plotly are optional dependencies, which are not installed by default.
Use-Case: Preprocess pandas DataFrames
import pandas as pd
from catabra_lib import preprocessing
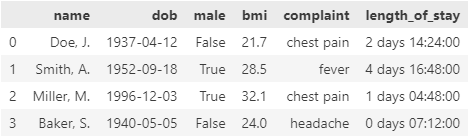
df = pd.DataFrame(
data=dict(
name=["Doe, J.", "Smith, A.", "Miller, M.", "Baker, S."],
dob=pd.to_datetime(["1937-04-12", "1952-09-18", "1996-12-03", "1940-05-05"]),
male=[False, True, True, False],
bmi=[21.7, 28.5, 32.1, 24.0],
complaint=pd.Categorical(["chest pain", "fever", "chest pain", "headache"]),
length_of_stay=pd.to_timedelta([2.6, 4.7, 1.2, 0.3], unit="d")
)
)
df
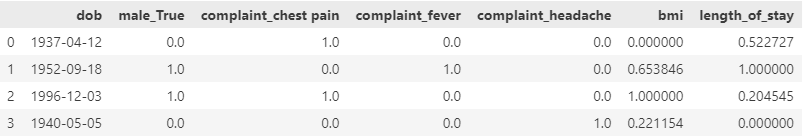
Min-max-scale numerical and timedelta columns, one-hot-encode categorical and boolean columns, pass datetime columns through, and drop all other columns:
preprocessing.DTypeTransformer(
    num=preprocessing.MinMaxScaler(),
    cat=preprocessing.OneHotEncoder(drop="if_binary"),
    bool="cat",
    timedelta="num",
    datetime="passthrough",
    default="drop",
    timedelta_resolution="h"
).fit_transform(df)
Note: pandas is an optional dependency, which is not installed by default. If you are working with pandas DataFrames a lot, you might want to check out CaTabRa-pandas.
Documentation
The CaTabRa documentation on ReadTheDocs covers many aspects of CaTabRa-lib as well, in particular metrics and plotting.
References
If you use CaTabRa-lib in your research, we would appreciate citing the following conference paper:
-
A. Maletzky, S. Kaltenleithner, P. Moser and M. Giretzlehner. CaTabRa: Efficient Analysis and Predictive Modeling of Tabular Data. In: I. Maglogiannis, L. Iliadis, J. MacIntyre and M. Dominguez (eds), Artificial Intelligence Applications and Innovations (AIAI 2023). IFIP Advances in Information and Communication Technology, vol 676, pp 57-68, 2023. DOI:10.1007/978-3-031-34107-6_5
@inproceedings{CaTabRa2023,
  author = {Maletzky, Alexander and Kaltenleithner, Sophie and Moser, Philipp and Giretzlehner, Michael},
  editor = {Maglogiannis, Ilias and Iliadis, Lazaros and MacIntyre, John and Dominguez, Manuel},
  title = {{CaTabRa}: Efficient Analysis and Predictive Modeling of Tabular Data},
  booktitle = {Artificial Intelligence Applications and Innovations},
  year = {2023},
  publisher = {Springer Nature Switzerland},
  address = {Cham},
  pages = {57--68},
  isbn = {978-3-031-34107-6},
  doi = {10.1007/978-3-031-34107-6_5}
}
Contact
If you have any inquiries, please open a GitHub issue.
Acknowledgments
This project is financed by research subsidies granted by the government of Upper Austria. RISC Software GmbH is Member of UAR (Upper Austrian Research) Innovation Network.
Release history Release notifications | RSS feed


Download files
Download the file for your platform. If you're not sure which to choose, learn more about installing packages.
Source Distribution
Built Distribution
Filter files by name, interpreter, ABI, and platform.
If you're not sure about the file name format, learn more about wheel file names.
Copy a direct link to the current filters
File details
Details for the file catabra_lib-0.0.3.tar.gz.
File metadata
- Download URL: catabra_lib-0.0.3.tar.gz
- Upload date:
- Size: 71.7 kB
- Tags: Source
- Uploaded using Trusted Publishing? No
- Uploaded via: poetry/1.7.1 CPython/3.11.5 Windows/10
File hashes
| Algorithm | Hash digest | |
|---|---|---|
| SHA256 |
c869d5574c9f3fbb46926348ae37d8b0980e273faee47380c12b2e31e93538ef
|
|
| MD5 |
ea8bd11692bb872813189ae51e0a05ce
|
|
| BLAKE2b-256 |
7428a999570de974589ac5fe11f7ae515a6998163d0315656212ab4ba2a292b1
|
File details
Details for the file catabra_lib-0.0.3-py3-none-any.whl.
File metadata
- Download URL: catabra_lib-0.0.3-py3-none-any.whl
- Upload date:
- Size: 75.8 kB
- Tags: Python 3
- Uploaded using Trusted Publishing? No
- Uploaded via: poetry/1.7.1 CPython/3.11.5 Windows/10
File hashes
| Algorithm | Hash digest | |
|---|---|---|
| SHA256 |
a4dedd33ed0cb7abcf956252b58a2b9ad1a4c73fe8cd1a07d35926fa78de48ee
|
|
| MD5 |
4283192de97e9f7d12a968c108ec92a8
|
|
| BLAKE2b-256 |
b59de73ff3611c1514496ac2d15c4d06aa7e259aca2500c7a60296f3b737e205
|


