Chaotic logic simulator in Python.

Project description
chaogate
Simulations of the 3-MOSFET system known as a
choagateusingpyspice.
This library corresponds to a selection of the code used in "Chaogate Parameter Optimization using Bayesian Optimization and Genetic Algorithm", “AI for Hardware Security", ISQED’21, 4/7/2020.
Install
pip install chaogate
How to use
import chaogate
from chaogate import *
Ensure you change the global_path to the folder containing the as described in the core page.
By default, they point to:
global_path
'C:\\Anaconda3\\Lib\\site-packages\\PySpice\\Examples\\libraries\\chaogate'
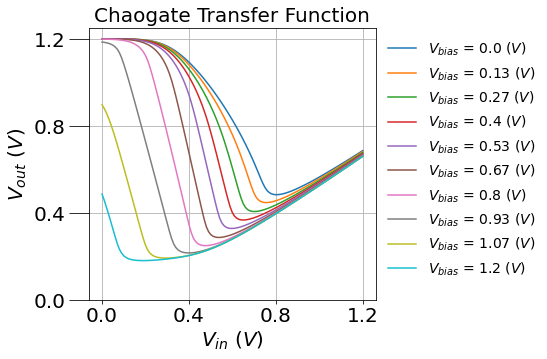
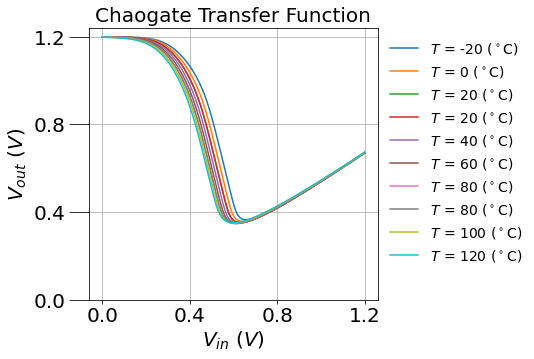
We can instantiate a chaogate with the chaogate function, though this is automatically called by all the other functions which need it in this library. Most functions, such as sweep, grid, and bifurcate, accept kwargs as an argument, which refers to all the possible keyword arguments of the choagate netlist. For exmaple,
s1,s2=sweep(Vbias=(0,1.2,0.01),TEMP=(-20,120,20))
plot_sweep(s1,ncurves=10)
plot_sweep(s2,ncurves=10)
sweep : Elapsed time: 0.3116 seconds
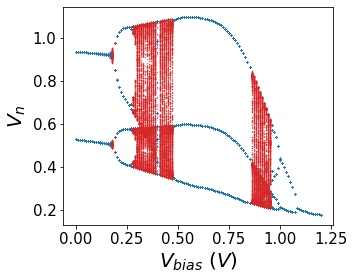
Once we sweep, we calculate the relevant chaotic properties using iterate.
This is packaged into an automatic process, along with calculating the lyapunov exponent, with the bifurcate function.
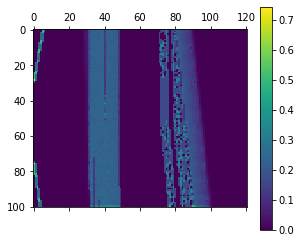
We can calculate these quantities over entire regions of parameter space with functions like grid, then estimate the computational stability with boolean_divergence:
g=bifurcate(Vbias=(0,1.2,0.01),Vdd=(1.15,1.25,0.001),as_grid=True)
grid : Elapsed time: 29.5447 seconds
iterate_map : Elapsed time: 5.9907 seconds
plot_bifurcate(itr=g.iterate.sel(Vdd=1.2),lya=g.lyapunov.sel(Vdd=1.2))
grad = boolean_gradient(g.iterate)
div = boolean_divergence(grad)
plt.matshow(div)
plt.colorbar()
<matplotlib.colorbar.Colorbar at 0x255f89bae88>
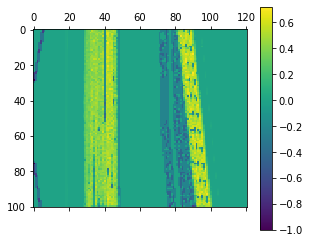
We can quickly compare the difference between the desired chaotic properties (positive $\lambda$), and the undesirable properties (the boolean divergence) by taking a linear combination such as:
normalized_lyapunov = (g.lyapunov.data>0)*g.lyapunov.data/np.max(g.lyapunov.data)
normalized_divergence = div/np.max(div)
optimizer = normalized_lyapunov - normalized_divergence
plt.matshow(optimizer)
plt.colorbar()
<matplotlib.colorbar.Colorbar at 0x255f4b6be48>
With an appropriate optimizatier we can then begin to assess the appropriate chaogate design
sidis.refresh()
Release history Release notifications | RSS feed

Download files
Download the file for your platform. If you're not sure which to choose, learn more about installing packages.
Source Distribution
Built Distribution
Filter files by name, interpreter, ABI, and platform.
If you're not sure about the file name format, learn more about wheel file names.
Copy a direct link to the current filters
File details
Details for the file chaogate-0.0.1.tar.gz.
File metadata
- Download URL: chaogate-0.0.1.tar.gz
- Upload date:
- Size: 18.6 kB
- Tags: Source
- Uploaded using Trusted Publishing? No
- Uploaded via: twine/3.2.0 pkginfo/1.5.0.1 requests/2.25.1 setuptools/54.2.0 requests-toolbelt/0.9.1 tqdm/4.36.1 CPython/3.7.4
File hashes
| Algorithm | Hash digest | |
|---|---|---|
| SHA256 |
ffd4537d7e914199ea87280de16e98db98ba378f7a8310236c0f8312b2cf1f85
|
|
| MD5 |
48e7ba4bd6da42d3d02d34ad89d04e5c
|
|
| BLAKE2b-256 |
73a9292db2b935d8ccce083560272082b3e5fbac8140d948e494757e0c19863f
|
File details
Details for the file chaogate-0.0.1-py3-none-any.whl.
File metadata
- Download URL: chaogate-0.0.1-py3-none-any.whl
- Upload date:
- Size: 15.9 kB
- Tags: Python 3
- Uploaded using Trusted Publishing? No
- Uploaded via: twine/3.2.0 pkginfo/1.5.0.1 requests/2.25.1 setuptools/54.2.0 requests-toolbelt/0.9.1 tqdm/4.36.1 CPython/3.7.4
File hashes
| Algorithm | Hash digest | |
|---|---|---|
| SHA256 |
558706e69d4a355e24a5c78b5bfe608ff1510e3035885c81754a31b8c355dce3
|
|
| MD5 |
04659b5ed84b5d73ba84df143ad9920e
|
|
| BLAKE2b-256 |
17ebcf58eb79ceadbc5b44a3c51897643639cc2459f6c1c037212a7a074c778e
|


