
chap-analytics



CHAP is a protocol for work that people and agents do together under review. A coordinator, the CHAP server, keeps an audit log of every request it handled: each entry is a JSON-RPC envelope, hash-linked to the one before it where the coordinator chains its log. That log records what people decided about agent work: what an agent produced, what a person changed, why, under which rule, and when. Every override carries the patch and the reviewer's reason. Every decision carries who made it and when, against the time the review opened. Every question an agent asked, every handoff between people, every vote and every escalation is an envelope in the same log.
This package reads that log back and answers the questions a team running agents under review has to answer: how often the work is changed and whether that is falling, which corrections keep recurring, whether the agent's reported confidence means anything, how long review takes and where it waits, when an agent has earned a lighter mode of oversight (CHAP tasks run in shadow, trial or production mode), whether reviewers agree with each other, who decides on whose work, and whether every outcome that went out had a person on its path.
Each answer comes as a table with its interval and sample size, a chart, and a paragraph that states the number and the decision it supports. All of it assembles into one self-contained HTML report that recomputes as the reader filters.
Install
pip install chap-analytics
Python 3.10 or later; pandas and numpy are the dependencies. The extras:
pip install 'chap-analytics[coordinator]'   # read a live coordinator in-process; generate the sample chains
pip install 'chap-analytics[viz]'           # Altair objects; SVG and PNG without Node
pip install 'chap-analytics[graph]'         # hand the graph to networkx
pip install 'chap-analytics[notebook]'      # regenerate the walkthrough notebook with its outputs
Charts render in Jupyter with the base install. Saving a chart as SVG uses
vl-convert where it is installed and otherwise the Vega runtime the package
ships, under Node. The report needs nothing beyond the base install.
Quick start
from chap_analytics import from_sqlite, frames, briefs, charts, report

chain = from_sqlite("./chap.db", workspace="wsp_support")   # or from_url, from_json, from_coordinator
f = frames(chain)

# Every decision in the table below, answered in a sentence.
for b in briefs.everything(f):
    print(b.headline)
    print("  ", b.decision)

# The same answers as charts. In a notebook, the last line draws it.
c = charts.everything(f)
c["rate_over_time"]

# One file, opens from disk, filters and recomputes in the browser.
report.write(f, "support.html")
Without a chain of your own, the package ships two:
from chap_analytics.sample import support_desk, synthetic

f = frames(support_desk())                       # a week at a support desk, driven against a real coordinator
f = frames(synthetic(seed=1, tasks=400,          # a workspace generated from stated rates, for checking statistics
                     override_rate=0.15, quorum_share=0.25, drift=(300, 0.4)))
Both need chap-coordinator, which the coordinator extra installs.
What the chain makes decidable
The package is organised around the decisions a team makes about its
agents. Each row is one question, the statistic that answers it, and the
chart that shows it. briefs.everything states every row that has a number
in words; charts.everything draws every row that has a chart; the report
carries all of them. A "substantive correction" below is an override that
reversed the agent's decision, or a rejection.
| Decision | Question | Statistic | Chart |
|---|---|---|---|
| Revise the prompt, or revise the policy | How often do reviewers change the agent's output, and do they refine it or reverse it? | Override, rejection and approval rates with Wilson intervals; refining share from intent_preserved |
Rate over time with its interval band; refine and reverse split by task kind |
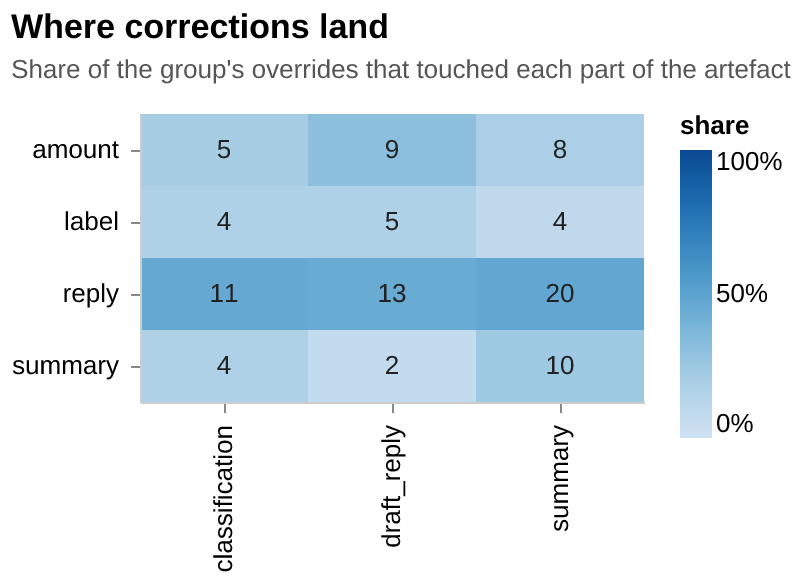
| Which part of the prompt to fix | Where do the corrections land in the artefact? | Patch path frequency by task kind | Heatmap of top_path (the first segment of the corrected path) against kind, with the rationales behind each cell one click away |
| Retune the routing thresholds | Does the agent's reported confidence track its outcomes? | Reliability curve, expected calibration error, Brier score | Reliability diagram with per-bin counts |
| Promote an agent from trial to production | Is the substantive correction rate below the bar, given how many tasks have been seen? | Beta posterior probability that the true rate is under the threshold; Wald's sequential test | Posterior density against the threshold; the sequential test between its bounds |
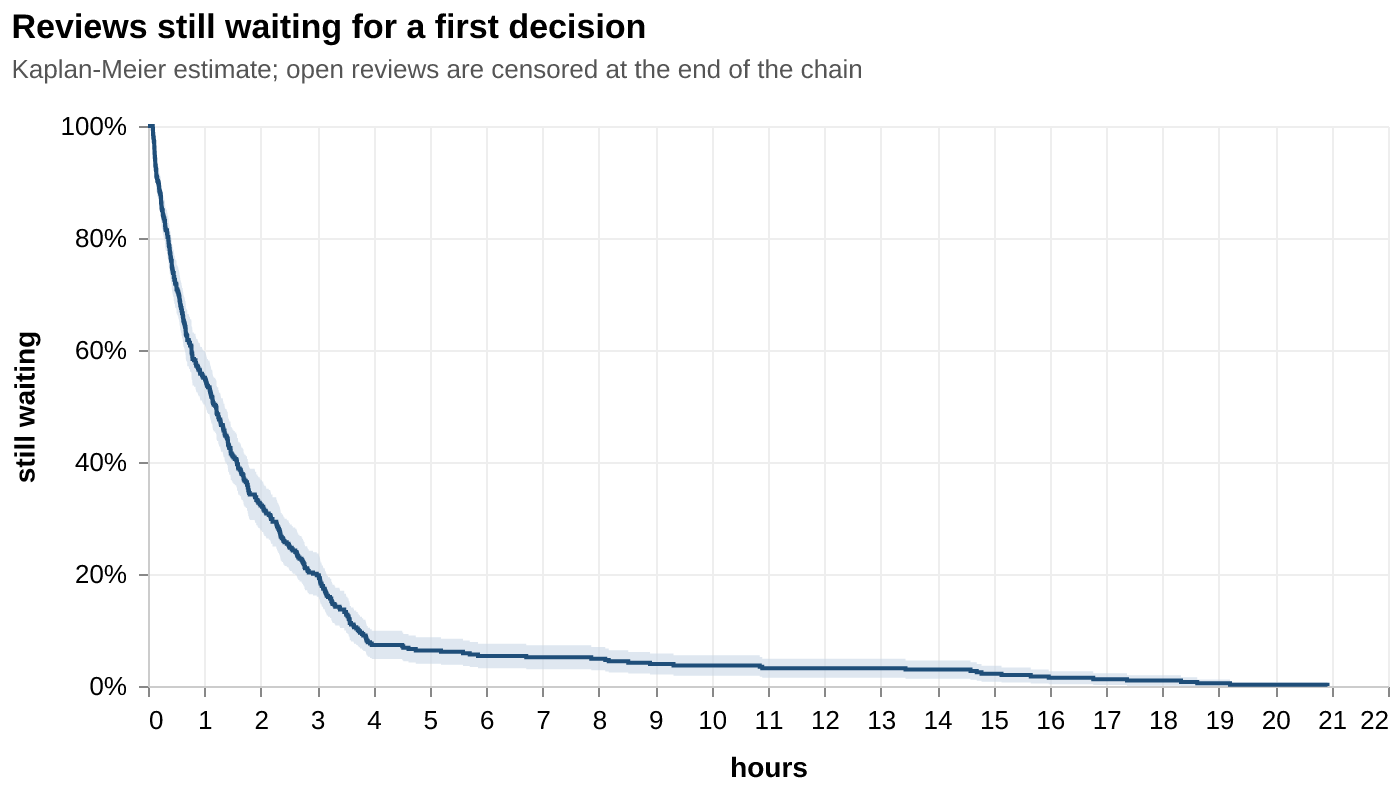
| Add reviewers, or reroute | Where do decisions wait, and for whom? | Time to decision as a Kaplan-Meier curve with open reviews censored; latency by reviewer; the open queue | Survival curve; median and 90th percentile per reviewer |
| Rewrite an ambiguous policy | Do reviewers agree with each other on the same artefact? | Fleiss' kappa across multi-reviewer passes; pairwise Cohen's kappa; abstentions by category | Agreement matrix |
| Clarify the task inputs | How often do agents have to ask, and does anyone answer in time? | Whispers (an agent's deadline-bound question to a person) per task, the share that lapsed unanswered, response time | Lapse rate by asker |
| Cover the shift | Are handoffs accepted, and how fast? | Acceptance rate, response time, declines by recipient | Acceptance by recipient |
| Trust the record | Is the chain verifiable end to end? | Hash-linked, signed and transparency-log-submitted fractions | Coverage over time |
| Notice a change early | Has the correction rate moved since the last prompt or model change? | Bernoulli CUSUM with a stated false-alarm rate | Control chart with the alarms marked |
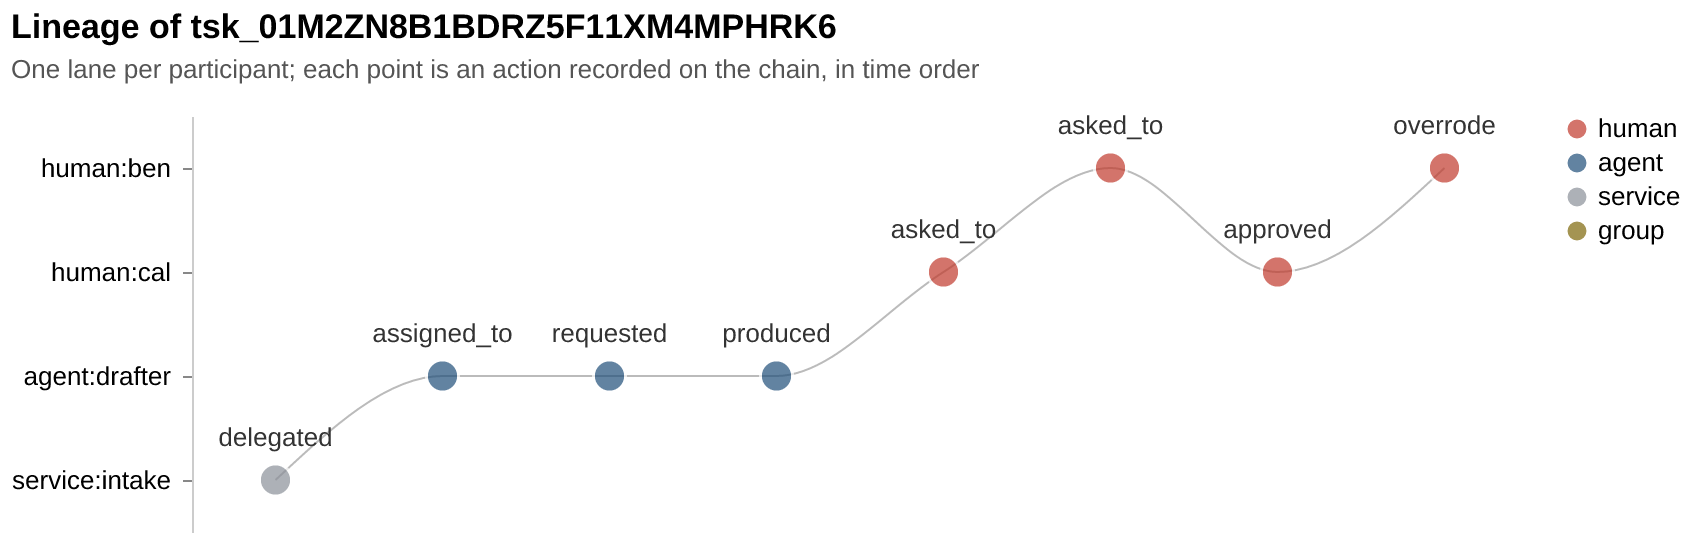
| Trace one outcome to its origin | What led to this action, and who was involved at each step? | The lineage of one task: draft, review, decisions, override, supersession, in order | A swimlane, one lane per participant |
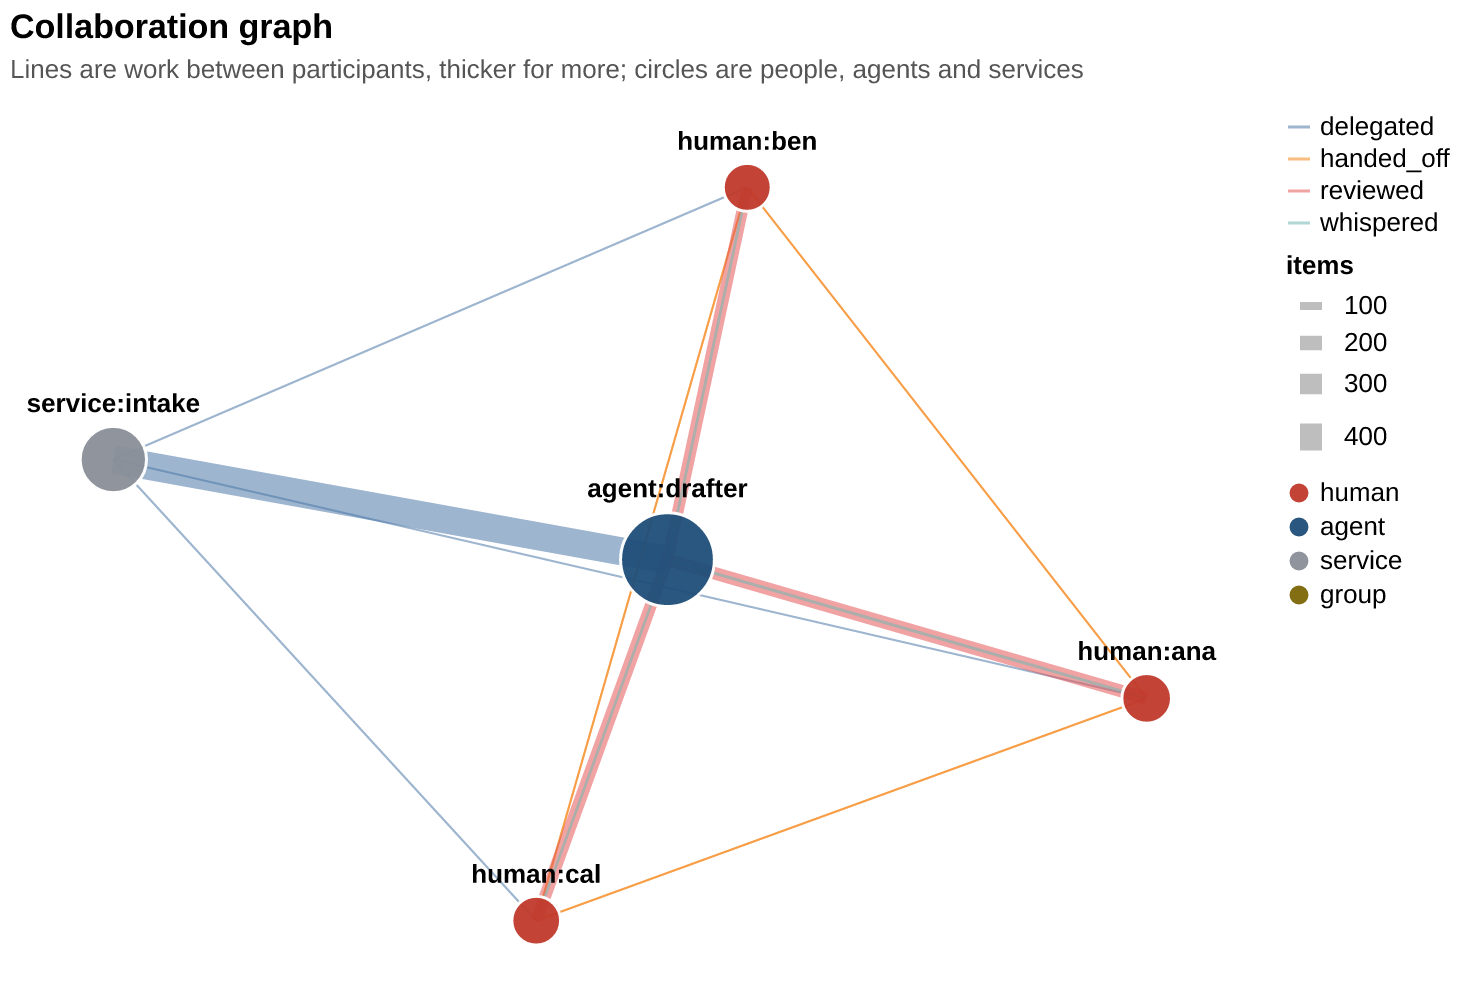
| Find the bottleneck | Who does most of the reviewing, and does one reviewer decide most of one agent's work? | Betweenness on the collaboration graph; each agent's top reviewer share and Herfindahl index | Collaboration graph, edges weighted by work |
| Confirm there is a person in the loop | Which outcomes that went out had a person on their path? | Share of shipped outcomes with a human decision on the task or a predecessor, or a person doing the work; coverage(f).attrs["uncovered"] names the rest |
The lineage view for any uncovered outcome |
| Separate duties | Does the same actor draft and approve, or propose and accept? | Same-actor pairs across roles, one row per finding in duties(f) |
The collaboration graph, where a self-review shows as a reviewer deciding on their own work |
Every rate carries its sample size and its interval, and every estimate
with a minimum carries a sufficient flag that says whether there is
enough data to read it. A function that lacks the data to answer says so.
The pictures
Every chart is a Vega-Lite specification built from a frame: a plain
dictionary, rendered in a notebook, in the report, or saved as SVG or PNG
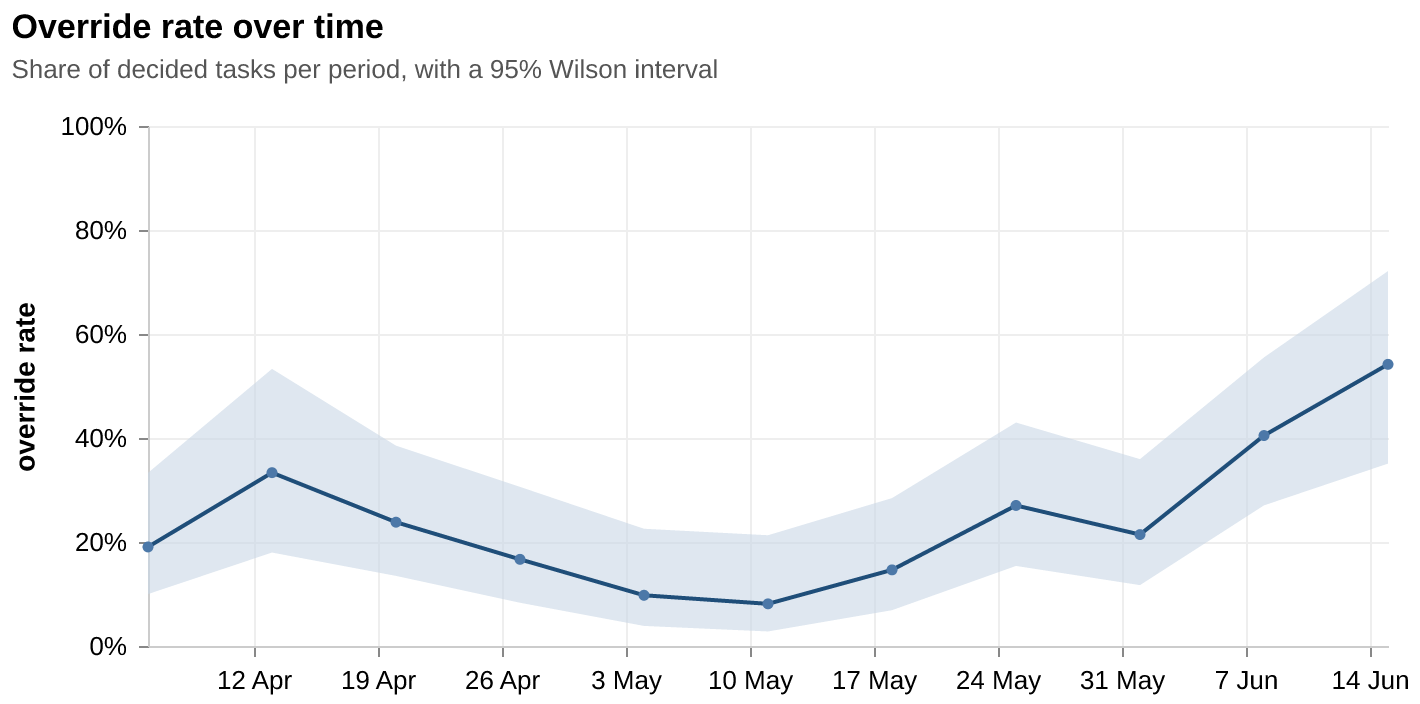
for a paper. The pictures below come from a generated quarter with a story
in it: a correction rate near 15% for most of the period, quorum reviews on
a quarter of the tasks, one reviewer stricter than the others, and a drift
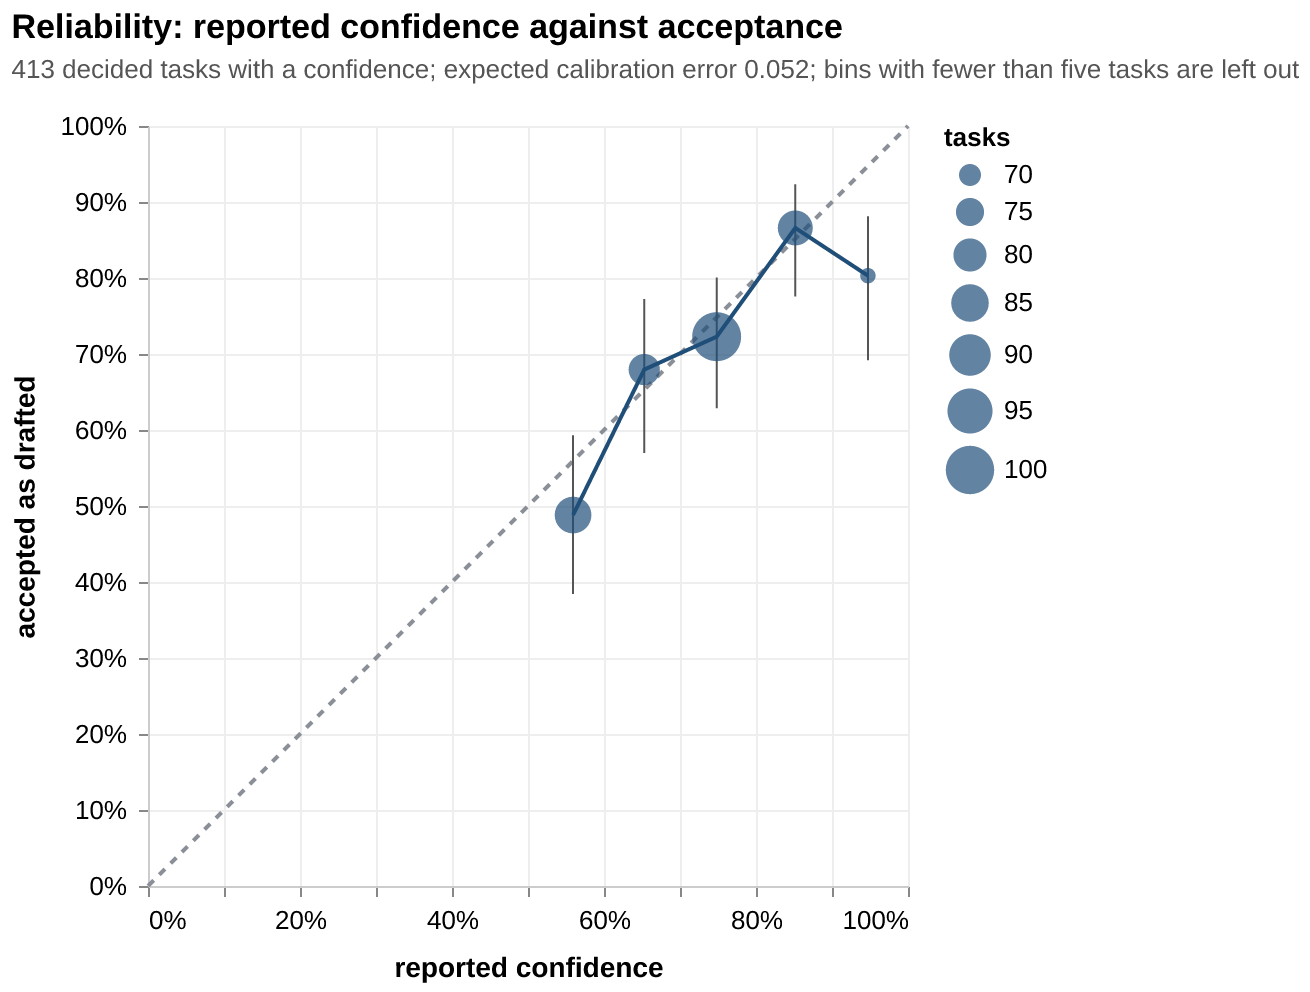
upwards late on. The reliability diagram comes from a second generated
workspace whose agent reports a confidence that tracks its outcomes.
docs/build_images.py
is the script that makes them.
 |
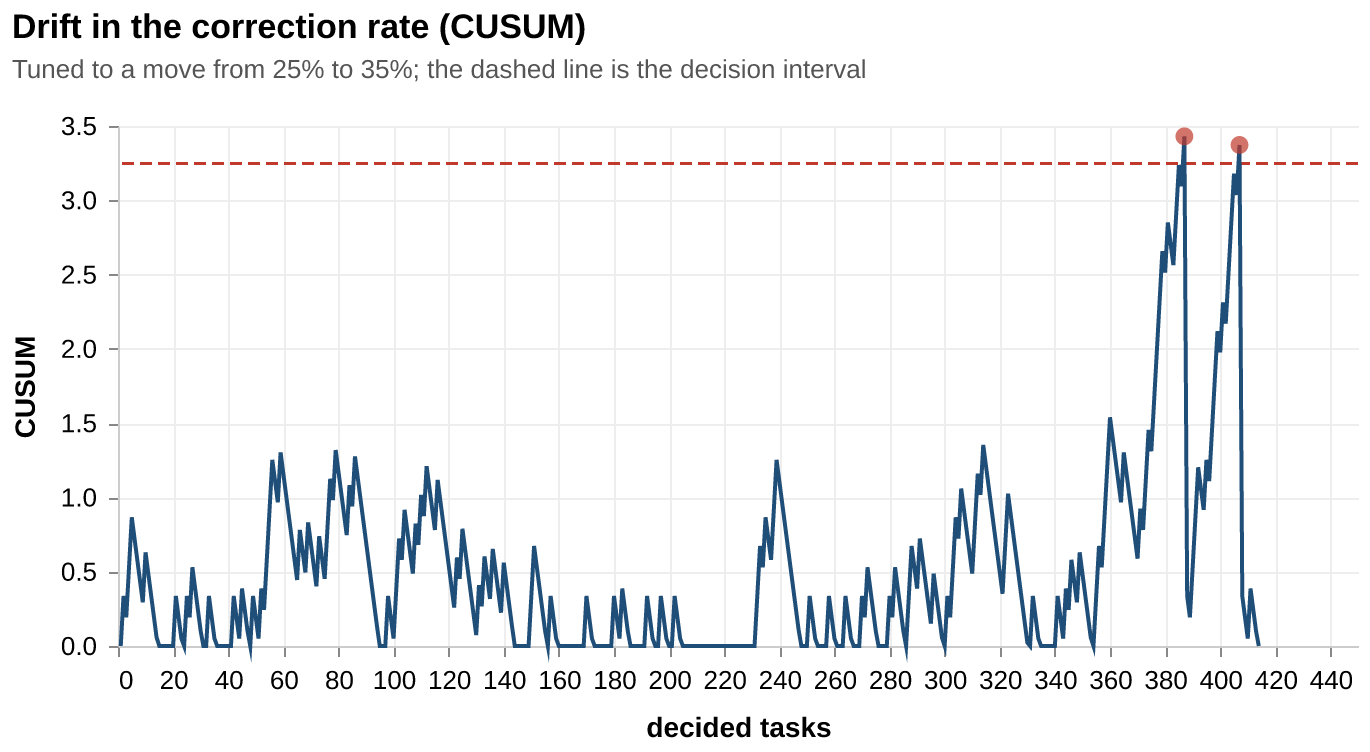 |
| The rate per week with its 95% interval. The rise in June is visible here; the chart on the right says when it became more than noise. | The CUSUM, tuned to the shift it should catch and the false-alarm rate it should keep, with the alarms marked. |
 |
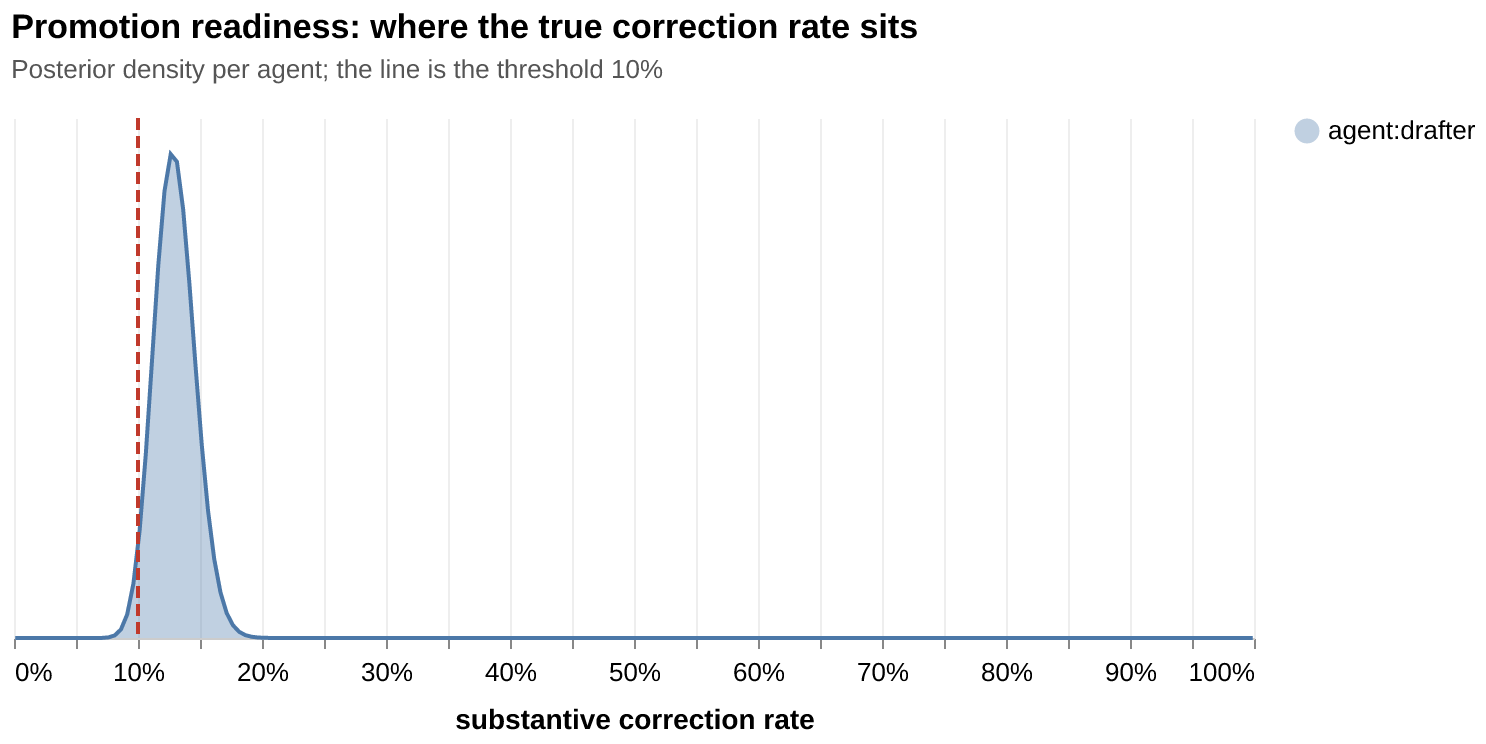 |
| Reported confidence against the share of work accepted as drafted. An agent whose confidence tracks its outcomes sits on the diagonal, and routing thresholds can be read off the curve. | The posterior for the substantive correction rate against the promotion threshold. The area to the left of the line is the chance the agent is already under it. |
 |
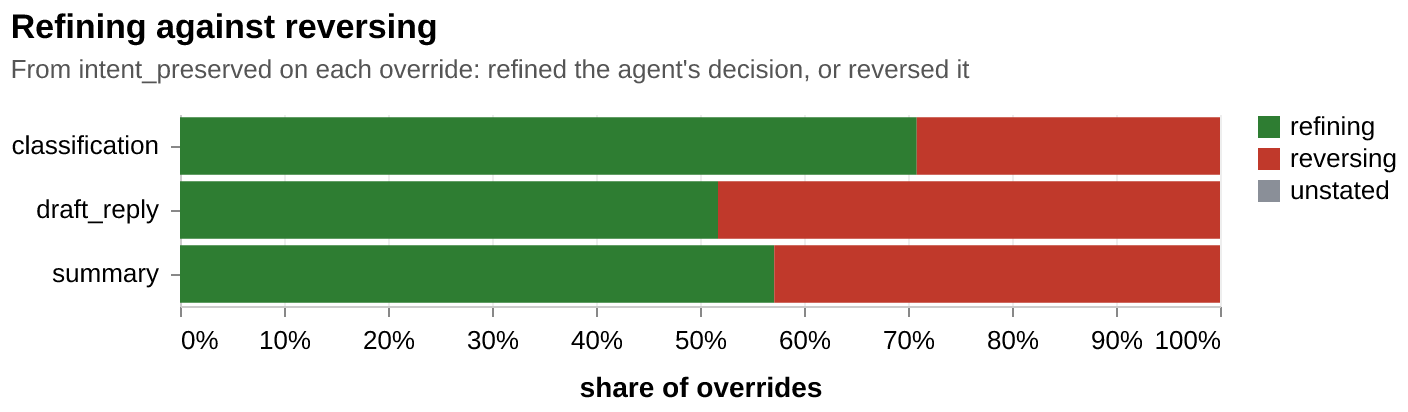 |
| Which part of the artefact reviewers touch, by task kind. In the report, a click on a cell lists the rationales behind it. | Whether corrections kept the agent's decision and improved the wording, or reversed it. The two call for different fixes. |
 |
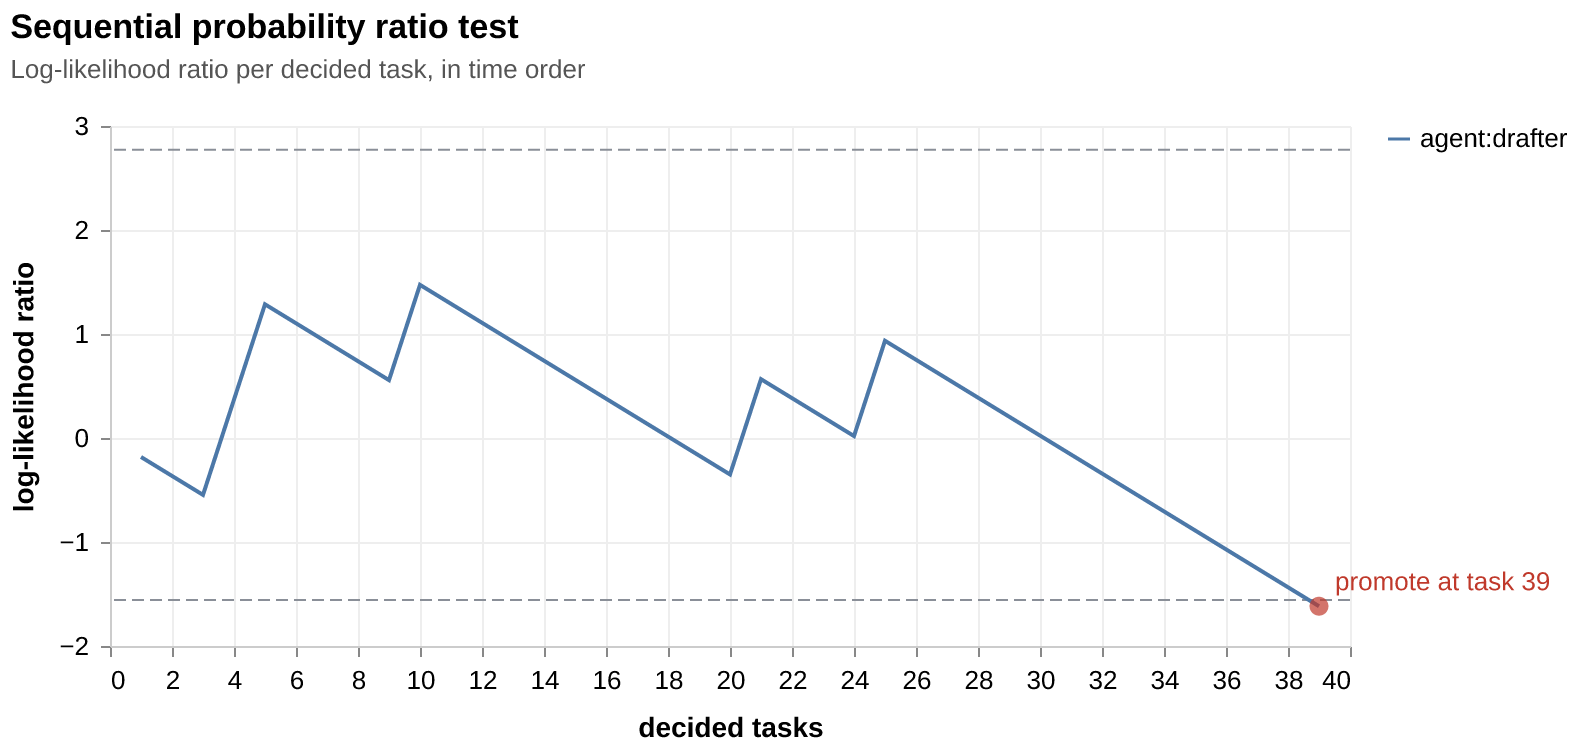 |
| The share of reviews still waiting after each hour, with open reviews censored rather than dropped. | Wald's sequential probability ratio test on the same rate: it stops at the first crossing and says which way. |
The chain as a graph
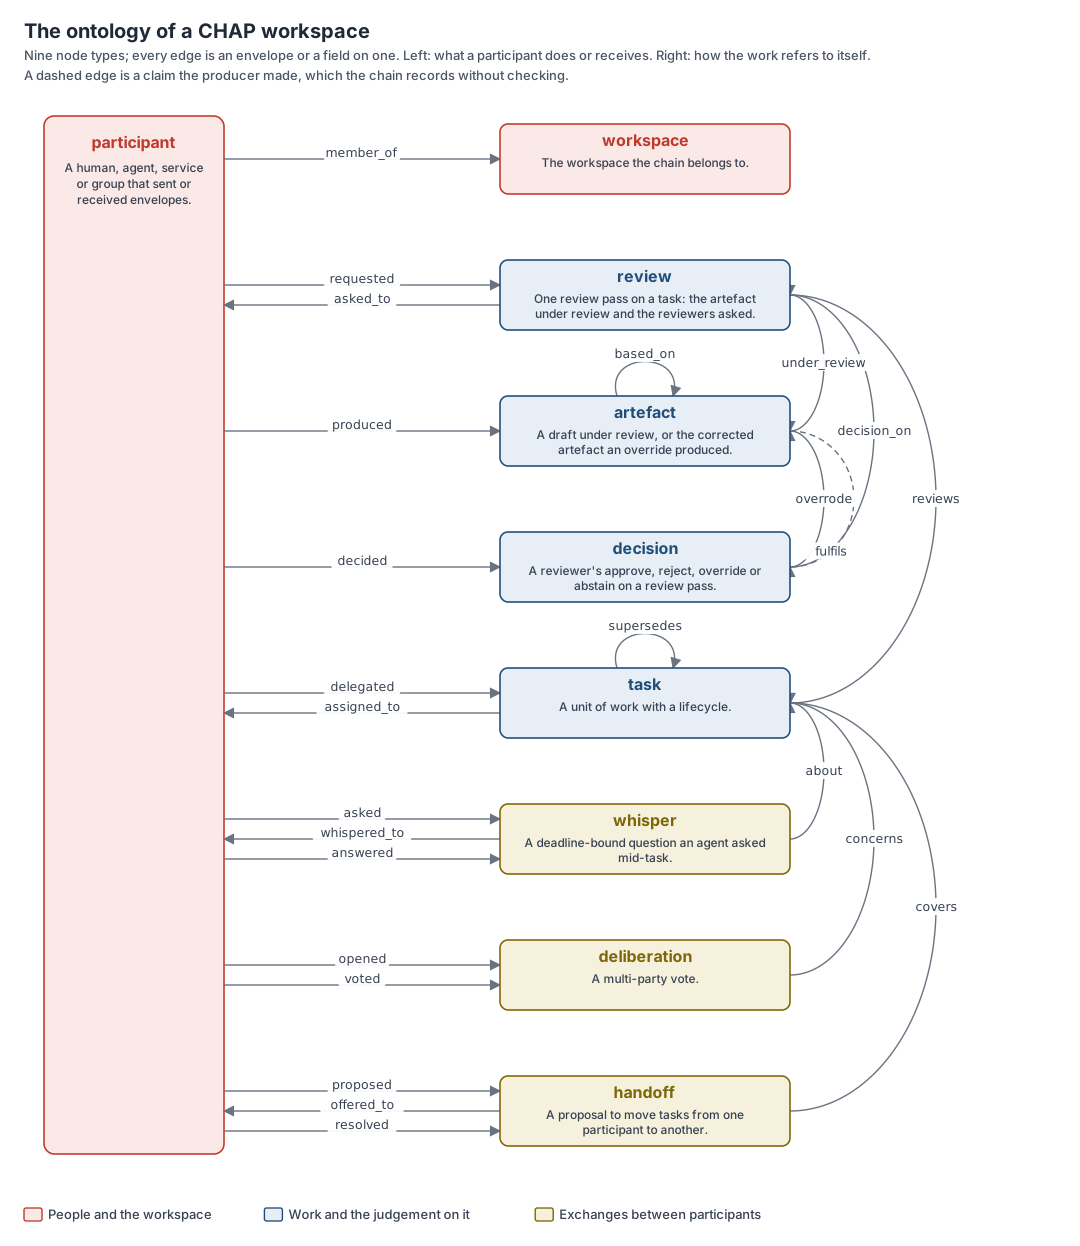
The same chain is also a graph. The workspace, its participants, tasks,
review passes, artefacts, decisions, whispers, deliberations and handoffs
are nodes. Who delegated, who was assigned, who was asked to review, who
decided, what an override was based on, which task superseded which, who
handed work to whom, who asked and who answered, who voted: those are the
edges. Every edge is an envelope or a field on one. The vocabulary is fixed
in graph.NODE_TYPES and graph.EDGE_TYPES, the diagram below is drawn
from those two tables, and the node-link export carries them under
ontology.
Two views come out of the graph. The lineage of one task is everything that led to it, in time order, with a lane per participant: the picture to start from when someone asks what happened. The collaboration graph is the people and agents of a workspace with the work that passed between them, where load, concentration and separation of duties can be seen at a glance.
 |
 |
from chap_analytics import graph

g = graph.build(f)                       # the whole chain
task_id = f.tasks["task_id"].iloc[-1]
graph.lineage_table(f, task_id)          # one task's history, in order
graph.collaboration(f)                   # who worked with whom, weighted
graph.centrality(f)                      # betweenness per participant
graph.concentration(f)                   # each agent's top reviewer and Herfindahl index
graph.coverage(f)                        # shipped outcomes with a person on the path
graph.duties(f)                          # same-actor pairs that should be separate
graph.to_node_link(g)                    # also to_graphml(g) and to_networkx(g)
graph.ontology_svg()                     # the diagram above
The report
report.write(f, "workspace.html") produces one HTML file with the Vega
runtime, the data and the page inside it, so it opens from a file share
with no network. The front page carries a headline card for every decision
that has a number: the figure, its interval, the sample size and one line
on what it means for that workspace. Below it, one section per decision
with the charts and the brief.
The filter bar applies to everything on the page: date range, task kind, agent, reviewer, mode and tag. Every chart and every headline recomputes in the browser from the embedded rows, using a JavaScript mirror of the library's statistics that the test suite checks against the Python numbers. Brushing the time axis re-scopes the page. A click on a cell of the correction heatmap lists the overrides behind it with their rationales. The open queue is a list. A selector opens the lineage of any task.
Artefact content stays out of the file. Rationales are included by default
and can be left out with rationales=False.
Watching a live workspace
from chap_analytics import watch

w = watch.Watcher("http://localhost:8080/chap", "wsp_support",
                  report_path="support.html",
                  on_alarm=lambda a: print(a.headline))
w.run(interval_s=300)
On each poll the watcher calls audit.read, the protocol method that
returns the log, from a sequence cursor, then re-projects, runs the drift
chart and regenerates the report. When the CUSUM crosses its decision
interval it calls on_alarm once with the metric, the task and time it
moved at, and the changed tasks among the twenty decided before it. The
source can be an HTTP endpoint, an in-process Coordinator, or any callable
that returns entries from a sequence number.
Exports
from chap_analytics import export

cases = export.evaluation_cases(f)               # one row per corrected task
export.to_jsonl(cases, "cases.jsonl")            # input, agent output, corrected output, rationale, tags
export.prompt_revision_candidates(f, top=10)     # the correction clusters most worth addressing, with examples
export.routing_calibration(f, target_acceptance=0.9)  # the confidence threshold that reaches the target, if any
The task input is available where the chain was read with state (a SQLite
file or an in-process coordinator); from audit.read alone it is null. The
agent's output and the corrected output come from the envelopes themselves.
Models
from chap_analytics import models

m = models.reviewer_severity(f)
m.attrs["fitted"], m.attrs.get("reason")
A reviewer who changes half of what they see may be strict, or may be seeing weak work. With several reviewers deciding on several agents the two can be separated: one number per agent for quality and one per reviewer for severity, fitted as a Rasch-style logistic model in numpy, each with an approximate standard error and the count it rests on. Below its minimum the function declines to fit and says which minimum it fell short of.
What each statistic needs
A new adopter has a dozen decisions in month one, and kappa, drift
detection and calibration curves need far more. So every estimate carries
its uncertainty: rates carry Wilson intervals, the promotion question is
answered with a posterior rather than a point, the survival curve carries
Greenwood bands, and each estimate with a minimum carries a sufficient
flag with the minimum it was judged against. The briefs read that flag and
say so where it is false.
docs/methods.md
states each method, what it assumes, and the minimum it asks for.
The tables
Underneath the statistics are documented tables, projected from the chain by replaying the envelope stream.
| Table | Grain |
|---|---|
events |
one row per accepted audit log entry |
tasks |
one row per task |
decisions |
one row per approve, reject, override or abstain |
overrides |
one row per correction, with its diff summarised |
patch_ops |
one row per RFC 6902 (JSON Patch) operation within an override |
participants |
one row per participant per workspace |
deliberations |
one row per group decision |
votes |
one row per vote |
whispers |
one row per deadline-bound question |
handoffs |
one row per proposed handoff |
routing |
one row per routing decision |
refusals |
one row per refused call the coordinator recorded |
Every column is declared in
schema.py
with its dtype and its provenance, and describe() returns the whole
contract as text. A column the source lacked a value for is present and
null, so code downstream sees missingness rather than a KeyError.
f.to_csv(directory) writes them all.
from chap_analytics import from_sqlite, from_url, from_json, from_coordinator

from_sqlite("./chap.db", workspace="wsp_support")     # the full snapshot
from_url("http://localhost:8080/chap", "wsp_support") # envelopes, via audit.read
from_json("export.json")                              # an audit.read result, a bare entry list, or a snapshot
from_coordinator(coord, workspace="wsp_support")      # a live coordinator, in-process
A SQLite file or a live coordinator carries the workspace snapshot and the
audit log beside it. audit.read, which is what an MCP client can call,
returns the audit log alone. The tables are replayed from the envelope
stream, so most of what is worth analysing is available from either source:
the artefact under review arrives on review.request and the patch on
decide.override, so the before and the after of every correction come
from the envelopes themselves. Three things come from the snapshot alone:
deliberation and routing outcomes, which the server computes; the assignee
a task.route chose, which assignee_certain flags; and the certainty of
which server-minted id belongs to which creation, which id_certain flags.
The projection does the work that otherwise gets done in every notebook. It
parses confidence from its decimal-string wire form. It censors open
work, so lifetime_s is null while a task is unsettled and settled says
which rows are censored. It knows when a decision settled a review under
each review rule (any_one_approves, all_approve, quorum:N). It keeps
review passes apart, so a task sent back for revision is measured from each
pass's own opening and outcome reads from the decision that settled the
last pass. It reconstructs the corrected artefact from the patch with the
coordinator's own RFC 6902 semantics. It counts the tasks the server mints
on escalation and supersession, with what they inherit from the original.
And it says how sure it is: id_certain and assignee_certain mark the
rows where the chain admits more than one reading, so the population to
draw conclusions from is a filter away.
Redaction
Artefacts hold whatever the agent was working on: customer messages, contracts, source code. A redactor sees every one of them before anything reaches a table, and what the tables lack the charts, briefs, report and exports lack too.
from chap_analytics import from_sqlite, redact_artefacts, frames

f = frames(from_sqlite("./chap.db", redact=redact_artefacts))
What goes: task inputs and outputs, the artefact under review and the
corrected one, the values a patch writes, free-text whisper answers, lapse
defaults, the inputs of a successor an escalation or supersession mints,
and the copies a snapshot holds. What stays, because it is the analysis:
counts, rates, latencies, tags, policy references, patch paths and
operations, which option a whisper answer chose, and the words participants
wrote about the work. A reviewer's rationale, a decline reason, a handoff
summary and a deliberation question are the people's account of what they
did. A whisper question is the agent's own words to a person; a deployment
that needs it removed strips the question field before loading.
Sample data
sample.support_desk() generates a week at a support desk against a real
coordinator: an agent drafts replies to tickets and three people review
them, approving most, correcting some and sending a few back. One declares
a conflict of interest, work changes hands at a shift change, the agent
asks two questions and gets one answer, a policy exception goes to a vote,
and one ticket is escalated to legal.
sample.synthetic() generates a workspace from stated rates: the override
and rejection rates, the refining share, how many tasks go to two reviewers
and how often the second agrees, the latency range, how many are left open,
whisper and lapse rates, handoffs, a drift point, reviewer strictness and
agent quality, and how the agent's confidence relates to its outcomes. The
test suite checks every statistic against the truth that generated it.
The walkthrough notebook
follows the sample week from the envelopes to the tables and on to every
decision in the table, with the charts drawn inline, and
examples/support_desk.py
prints the same analyses from the command line.
Tests
pip install -e ".[dev]"
pytest
The fixtures drive a real coordinator, so the suite fails when the protocol
moves. Statistics are checked against generated chains whose truth is
known. Every chart is compiled and rendered by the Vega-Lite runtime the
package ships. The report is checked to be self-contained, and its
JavaScript is run under Node on the embedded tables and compared with the
Python numbers. The notebook is executed. A differential suite reads random
workspaces both ways and checks the tables against what the coordinator
holds. The chart and report checks need node on the path and are skipped
without it.
Documentation
docs/methods.md: every statistic, what it assumes, what it needs, how to read it.docs/graph.md: the ontology, the two views, the graph statistics and the exports.docs/report.md: what is in the report and how it is built.ANALYTICS_ROADMAP.md: the plan this package follows.CHANGELOG.md.
Licence
Apache 2.0. The report embeds Vega, Vega-Lite and vega-embed, which are
BSD-3-Clause; their licences ship in chap_analytics/_vendor.
1 maintainer

Metadata
1 maintainer
Release files for chap-analytics 0.2.1
For a detailed explanation of source distributions (sdists) and built distributions (wheels), please see the package formats documentation.
Source distribution (sdist)
| File | Size | Uploaded | |
|---|---|---|---|
| chap_analytics-0.2.1.tar.gz | 560.0 kB | Details |
Built distribution (wheel)
| File | Interpreter | ABI | Platform | Reset |
|---|---|---|---|---|
| chap_analytics-0.2.1-py3-none-any.whl | Python 3 | none | any | Details |
Total release size: 986.2 kB
Release files / chap_analytics-0.2.1.tar.gz
| Download URL | chap_analytics-0.2.1.tar.gz |
|---|---|
| Size | 560.0 kB |
| Tags | Source |
|
SHA-256 checksum How to use checksums |
02b2d7edb28bb8a1655777c1883e3c41398f980792d856d2d876fdb919446b88
|
|
BLAKE2b-256 checksum How to use checksums |
9decfe1cff40e24204f1d4184869b6be4d21b7d8e3ed60dfe9b2c6599b356897
|
| Upload date | |
|
Uploaded using Trusted Publishing? What is trusted publishing? |
No |
| Uploaded via |
twine/7.0.0 CPython/3.11.15
|
Release files / chap_analytics-0.2.1-py3-none-any.whl
| Download URL | chap_analytics-0.2.1-py3-none-any.whl |
|---|---|
| Size | 426.2 kB |
| Tags | Python 3 |
|
SHA-256 checksum How to use checksums |
035b5f290d0f347d3a69343e531eb673923e2033c9fd2daed4f1bbf8b1163e1e
|
|
BLAKE2b-256 checksum How to use checksums |
8fca2a50f7d8f0043dc578fdcf1cd9470de6017fe6e4fd84b0cd037949fd4e41
|
| Upload date | |
|
Uploaded using Trusted Publishing? What is trusted publishing? |
No |
| Uploaded via |
twine/7.0.0 CPython/3.11.15
|














