
Chartwright
A dashboard compiler for Apache Superset. The chartwright command line builds
a dashboard from a small deterministic file, updates it from that file later,
and decompiles an existing dashboard back into one. Every dataset, column, and
metric is checked against your own Superset first. An AI can write the file for
you, or revise it, from a request in plain words.
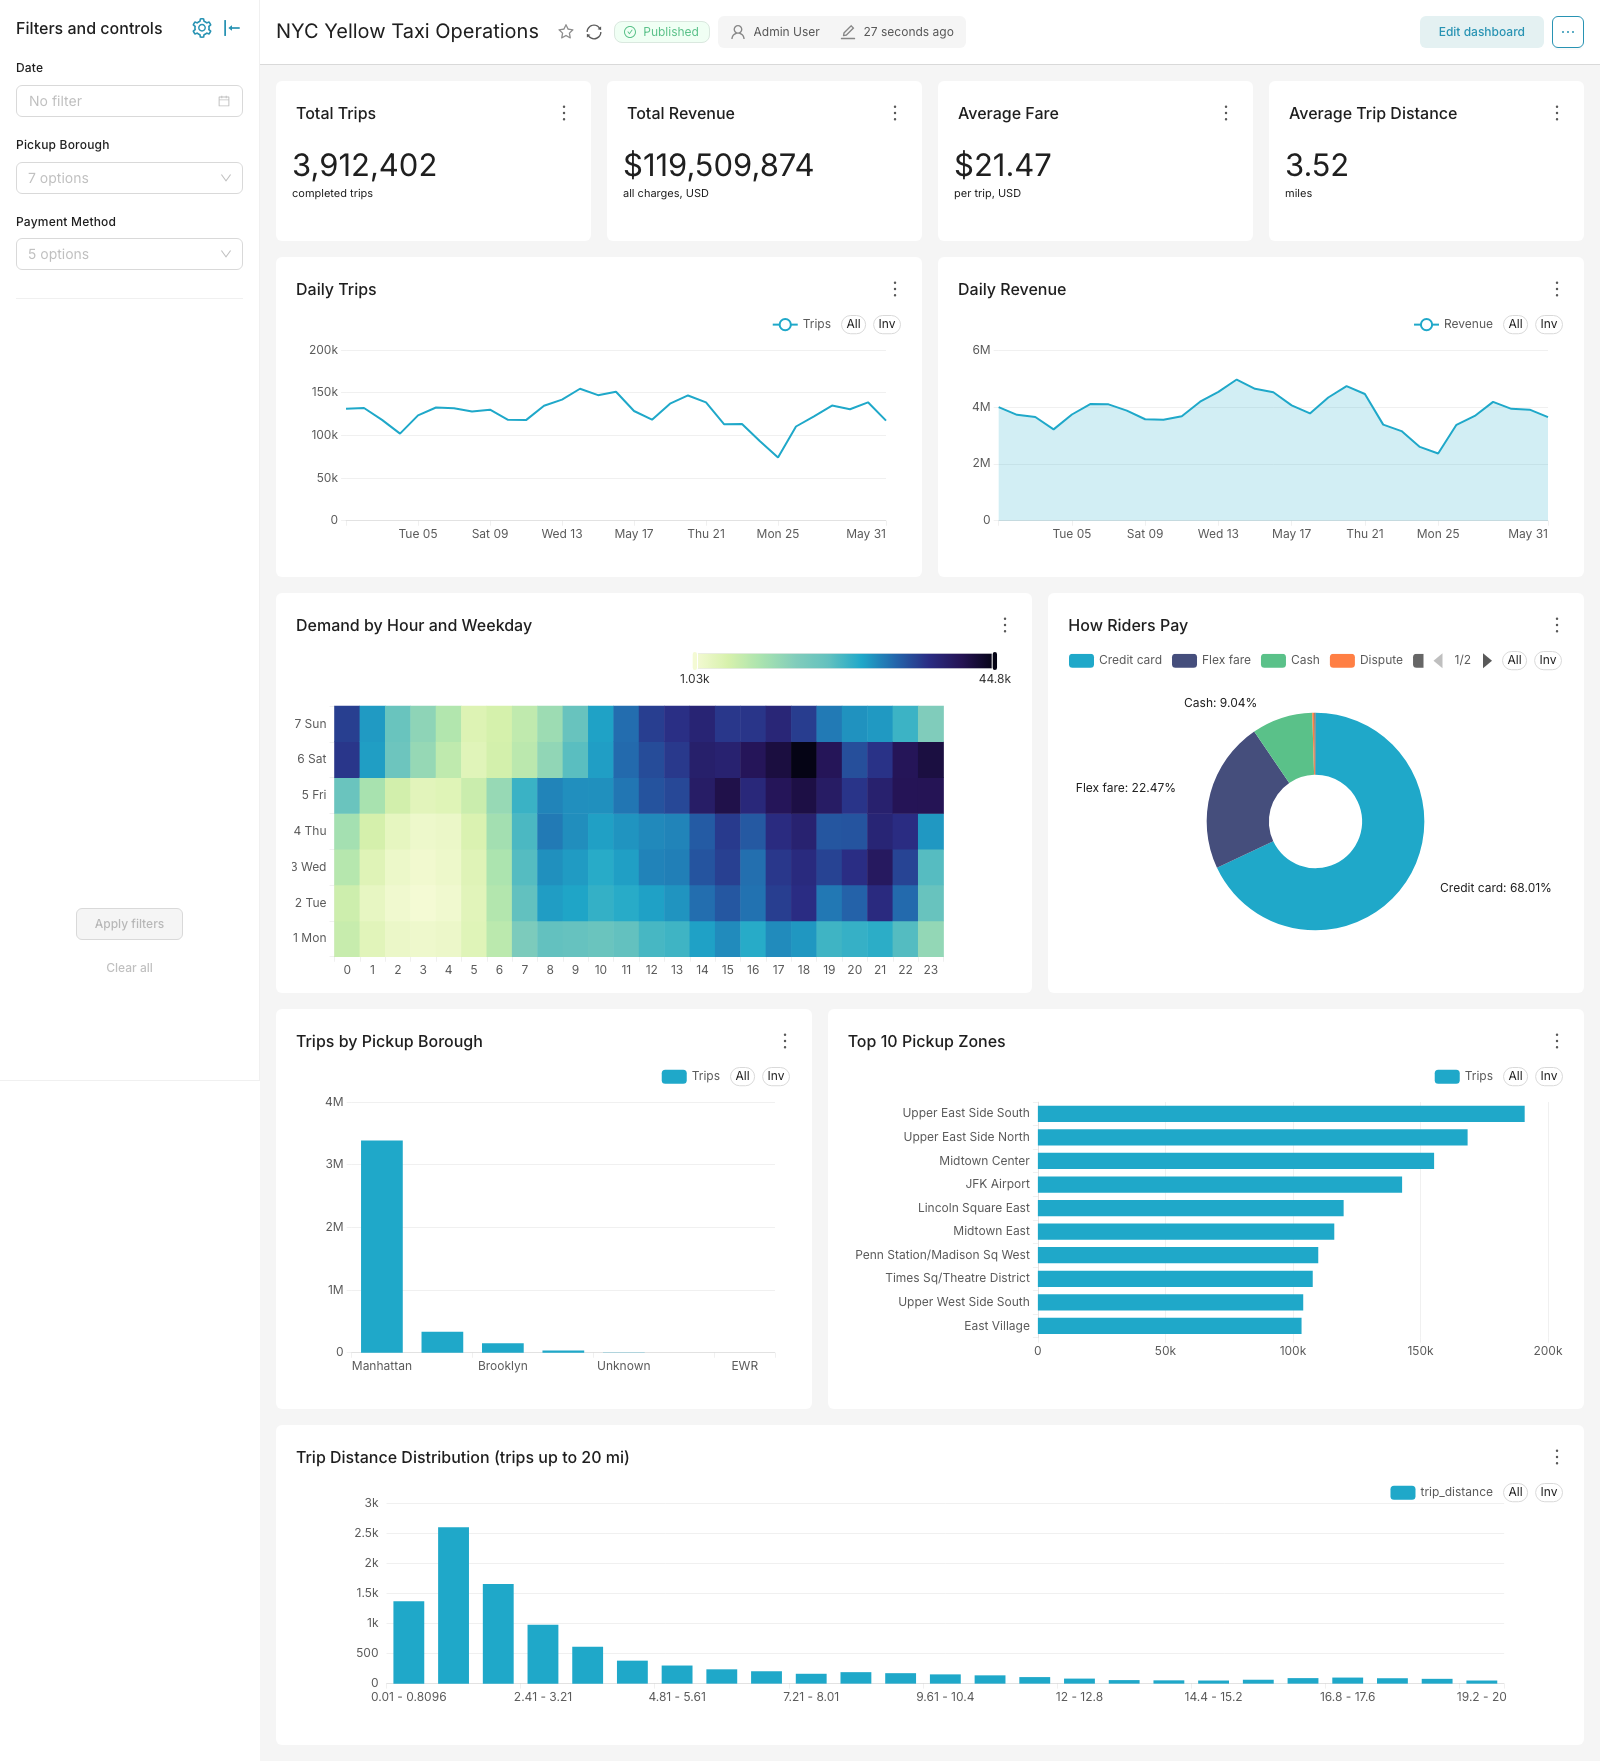
3.9 million yellow-taxi trips (NYC TLC trip records, May 2026), 11 verified
charts, three filters, one chartwright apply. An AI wrote
the spec from a one-paragraph request:
the request and rebuild steps.
A dashboard that lives in a file gets the workflow code already has: review it
in a pull request, rebuild it identically, and bring it back after a bad
change. chartwright plan diffs the file against the live dashboard and exits
non-zero when they differ, so drift fails a CI check. chartwright decompile
covers the other direction, and lists anything it could not carry over.
Write the file yourself, or describe the dashboard you want and have an AI
write it. The same checks run either way. After the build, each chart's query
runs once (an error fails the build, an empty chart is named), and
chartwright advise reviews the layout for readability.
What a spec looks like
The file is called a spec:
{
  "spec_version": "1",
  "dashboard": {"title": "Sales Overview", "slug": "sales-overview"},
  "charts": [
    {
      "name": "Total Sales",
      "type": "big_number_total",
      "dataset": {"database": "examples", "table": "cleaned_sales_data"},
      "metric": "SUM(sales)"
    },
    {
      "name": "Sales Over Time",
      "type": "timeseries_line",
      "dataset": {"database": "examples", "table": "cleaned_sales_data"},
      "metrics": ["SUM(sales)"],
      "time_column": "order_date"
    }
  ],
  "layout": {"rows": [["Total Sales"], ["Sales Over Time"]]}
}
chartwright apply on this file signs in to your Superset, confirms the
cleaned_sales_data table and the sales and order_date columns exist,
builds a KPI card above a line chart, and finishes by running each chart's
query once. A misspelled column or a missing table is a clear error naming the
problem, with the closest real names suggested, before anything is created.
Creating dashboards with AI
The spec is typed, and every reference in it is checked before anything is created. Whatever a model proposes has to survive the same verification your own specs do.
- Claude Code skill: from a clone of this repo, run
python install-skill.py; the model writes the spec from your request, and the tool verifies and builds it. - MCP server:
chartwright-mcp(installed withpip install "chartwright[mcp]") exposes fourteen tools covering the whole lifecycle, usable from any MCP client. - Open contract:
chartwright schemaprints the spec's JSON Schema, so any LLM or tool can generate valid specs. - Guardrails: the AI proposes; the tool verifies, using your own Superset login. Verification reads names (datasets, columns, metrics), not rows.
Quick start
pip install chartwright
Python 3.11 or newer; three dependencies; Windows, macOS, and Linux.
Create ~/.config/chartwright/profiles.toml pointing at your Superset:
[prod]
base_url = "https://superset.your-company.com"
username = "your-username"
password_env = "CHARTWRIGHT_PROD_PASSWORD"
Point the example spec's dataset lines at a table your Superset already
knows, save it as sales_overview.json, then:
chartwright check sales_overview.json --profile prod   # read-only: verify every reference
chartwright apply sales_overview.json --profile prod   # build, import, verify
No Superset to point at? Clone this repo: sandbox/up.sh boots a disposable
Superset 6.1.0 with example data on localhost:8098 (Docker required;
sign-in is admin/admin), and tests/fixtures/kitchen_sink.json applies to it
as-is.
What you get
- Deterministic dashboards: the same spec always produces the identical dashboard. Diff it in git, review it in a PR.
- Verified at every step: every reference is checked before anything is written, and every chart's query runs once (an error fails the build, an empty chart is named); failures say what went wrong and where.
- Dashboards as code, in both directions:
chartwright decompileturns any live dashboard into a spec;chartwright planshows what differs between the spec and the live dashboard, ready as a CI gate;chartwright compilebuilds the import bundle offline, no server needed. - Recoverable by default: every apply backs up the previous state first, and an apply that fails while importing or updating charts restores it automatically. Dashboards Chartwright did not create are never overwritten; to bring a hand-built one under a spec, decompile it and build it at a new slug.
- What a spec can express: 17 chart types, metrics as you write them, per-chart filters, a native filter bar, tabs, markdown notes, a header and footer shown on every tab, and layouts you can draw as ASCII sketches.
- Environment promotion: specs name their data (connection, schema, table), so the same file applies to dev, staging, and production when they share connection names.
Every capability, with the CLI verb reference: docs/FEATURES.md.
The design brain
A spec can import perfectly and still produce a dashboard nobody can read: a pie squeezed into two columns, a KPI buried under three tables, a bar chart with forty category labels Superset silently drops. The design brain covers size and scroll budgets, chart-choice limits, and layout composition. It arrives as a brief the AI reads before authoring, and a critic that reviews the result:
chartwright brief --audience executive        # the guidance, before writing a spec
chartwright advise spec.json --fix            # the critique, with safe auto-repairs
chartwright redesign old-dash --profile prod  # audit + repair a live dashboard
You stay in charge of it: suppress any rule for one chart in the spec, tune
the thresholds per audience or per deployment in design.yaml, and feed the
heights you drag in the UI back into the recommendations with chartwright calibrate. Pass --design off and the output is byte-identical to a build
that never had it. The full rulebook and architecture:
docs/DESIGN-BRAIN.md.
Drawing layouts as text
The spec's sketch is the dashboard's shape, drawn with characters that you
and a model can both write: each letter is a chart, and repeating a sketch
line makes its charts taller.
KKKK LLLLLLLL
.... LLLLLLLL

L spans both lines, so it renders twice as tall as K; the dots keep the
space under K deliberately empty. Every rule, drawn and explained:
docs/LAYOUT-GUIDE.md.
Testing and evidence
Every pull request and every push to main runs the full offline suite on Linux and Windows, plus the full pipeline (apply, lifecycle soak, stale-tab adversary, fault injection) against real Superset 4.1.4, 5.0.0, and 6.1.0 containers. Chart options are checked against Superset's own source for every supported version, so a Superset change surfaces here before it reaches your dashboards.
Full evidence: docs/VERIFICATION.md.
docs/CONTRACTS.md records how Superset itself behaves: what its importer accepts, how dashboard settings are stored, what its chart plugins expect. Every behavior is cited to its source line at 4.1.4, 5.0.0, and 6.1.0. Release tags are immutable, so any line of it can be checked against a fresh checkout of that tag.
Documentation
- docs/FEATURES.md: every capability, with the CLI verb reference
- docs/LAYOUT-GUIDE.md: drawing layouts as text, every rule illustrated
- docs/DESIGN-BRAIN.md: the design rulebook, every rule and threshold, and how to tune or switch them off
- docs/VERIFICATION.md: what is tested, what it caught, and how to reproduce it
- docs/CONTRACTS.md: how Superset behaves on import, on dashboard storage, and in chart options, cited to its source line at each supported release
- docs/COMPARISON.md: what Chartwright, preset-cli, sup, and the Terraform provider each automate, so you can pick by the job
Apache Superset, Superset, and the Superset logo are trademarks of the Apache Software Foundation. No endorsement by the ASF is implied.
1 maintainer

Metadata
1 maintainer
Release files for chartwright 0.6.0
For a detailed explanation of source distributions (sdists) and built distributions (wheels), please see the package formats documentation.
Source distribution (sdist)
| File | Size | Uploaded | |
|---|---|---|---|
| chartwright-0.6.0.tar.gz | 574.6 kB | Details |
Built distribution (wheel)
| File | Interpreter | ABI | Platform | Reset |
|---|---|---|---|---|
| chartwright-0.6.0-py3-none-any.whl | Python 3 | none | any | Details |
Total release size: 933.2 kB
Release files / chartwright-0.6.0.tar.gz
| Download URL | chartwright-0.6.0.tar.gz |
|---|---|
| Size | 574.6 kB |
| Tags | Source |
|
SHA-256 checksum How to use checksums |
b58234e482987307902661b5c74463e0234f9afd6a26fbaed1780559c367bf20
|
|
BLAKE2b-256 checksum How to use checksums |
6ef8671d85481d26fc0175cf8342af2682844fd724d5ddc5f40c568a27eed4a8
|
| Upload date | |
|
Uploaded using Trusted Publishing? What is trusted publishing? |
Yes |
| Uploaded via |
twine/7.0.0 CPython/3.13.14
|
Provenance
Provenance describes where a file came from. On PyPI, provenance is shared via attestations, which provide a verifiable record of the build or publishing details. View details, limitations and caveats.


PyPI Publish Attestation
PyPI verified that this artifact, at this checksum, originated from the publisher listed below.
Signed by GitHub Actions, verified by PyPI on Oct 6, 2026.
Transparency logRelease files / chartwright-0.6.0-py3-none-any.whl
| Download URL | chartwright-0.6.0-py3-none-any.whl |
|---|---|
| Size | 358.7 kB |
| Tags | Python 3 |
|
SHA-256 checksum How to use checksums |
25fc9248b214a690fb8adee74f1558d7d808a60874253bf37edfebb6deabce37
|
|
BLAKE2b-256 checksum How to use checksums |
17112060baec099021756db2a597caef5c24f1ea8df9dec6ad2f2da76af0f3d4
|
| Upload date | |
|
Uploaded using Trusted Publishing? What is trusted publishing? |
Yes |
| Uploaded via |
twine/7.0.0 CPython/3.13.14
|
Provenance
Provenance describes where a file came from. On PyPI, provenance is shared via attestations, which provide a verifiable record of the build or publishing details. View details, limitations and caveats.
PyPI Publish Attestation
PyPI verified that this artifact, at this checksum, originated from the publisher listed below.
Signed by GitHub Actions, verified by PyPI on Oct 6, 2026.
Transparency log













