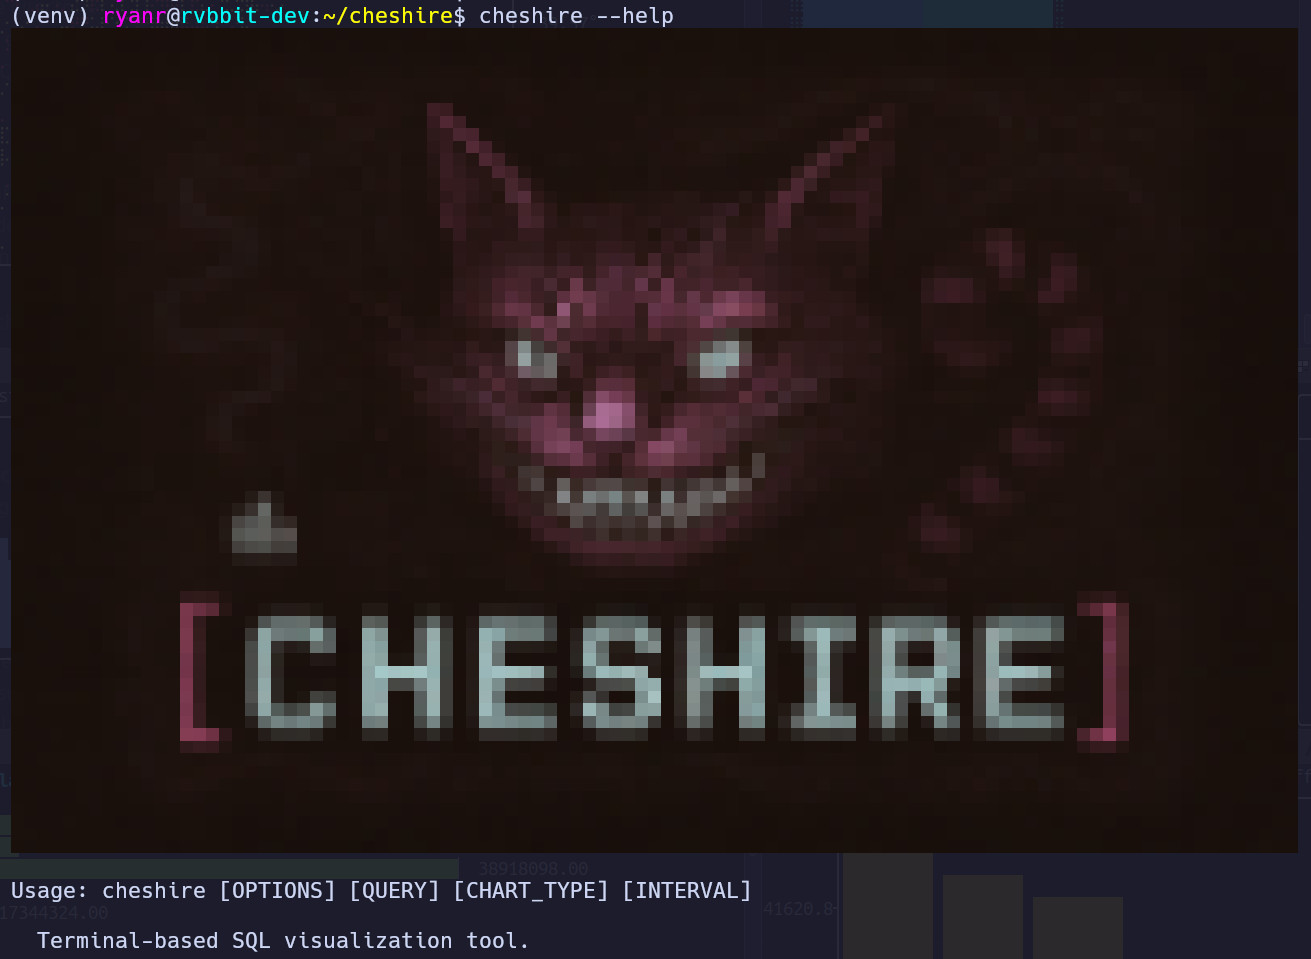
Terminal-based SQL visualization tool that transforms query results into beautiful ANSI charts

Project description
Cheshire
Simple terminal-based SQL visualization tool - turn SQL into ANSI charts, maps, tables, and more. Analyze your data and browse the results in a builder UI, and then copy and paste the command to use in your shell scripts, etc. Build an easy auto-refreshing dashboard out of TMUX panels, etc. Unhide your data from the terminal.
“Well! I've often seen a cat without a grin,' thought Alice 'but a grin without a cat! It's the most curious thing i ever saw in my life!”
Features
Multiple Data Sources
- DuckDB - Primary SQL engine with extensive format support
- SQLite - Direct database file queries
- PostgreSQL - Via DuckDB postgres_scanner extension
- MySQL - Via DuckDB mysql_scanner extension
- Clickhouse - Via clickhouse_driver
- osquery - System statistics as SQL (processes, network, hardware) **if installed
- CSV/TSV Files - Query delimited files directly with SQL
- Parquet Files - Analyze single files or entire directories
- JSON Input - Pipe JSON arrays directly and query with SQL
- Remote Databases - Connect to external SQL servers
- HTTP(s) DB Files - Web served Parquet, CSV, TSV
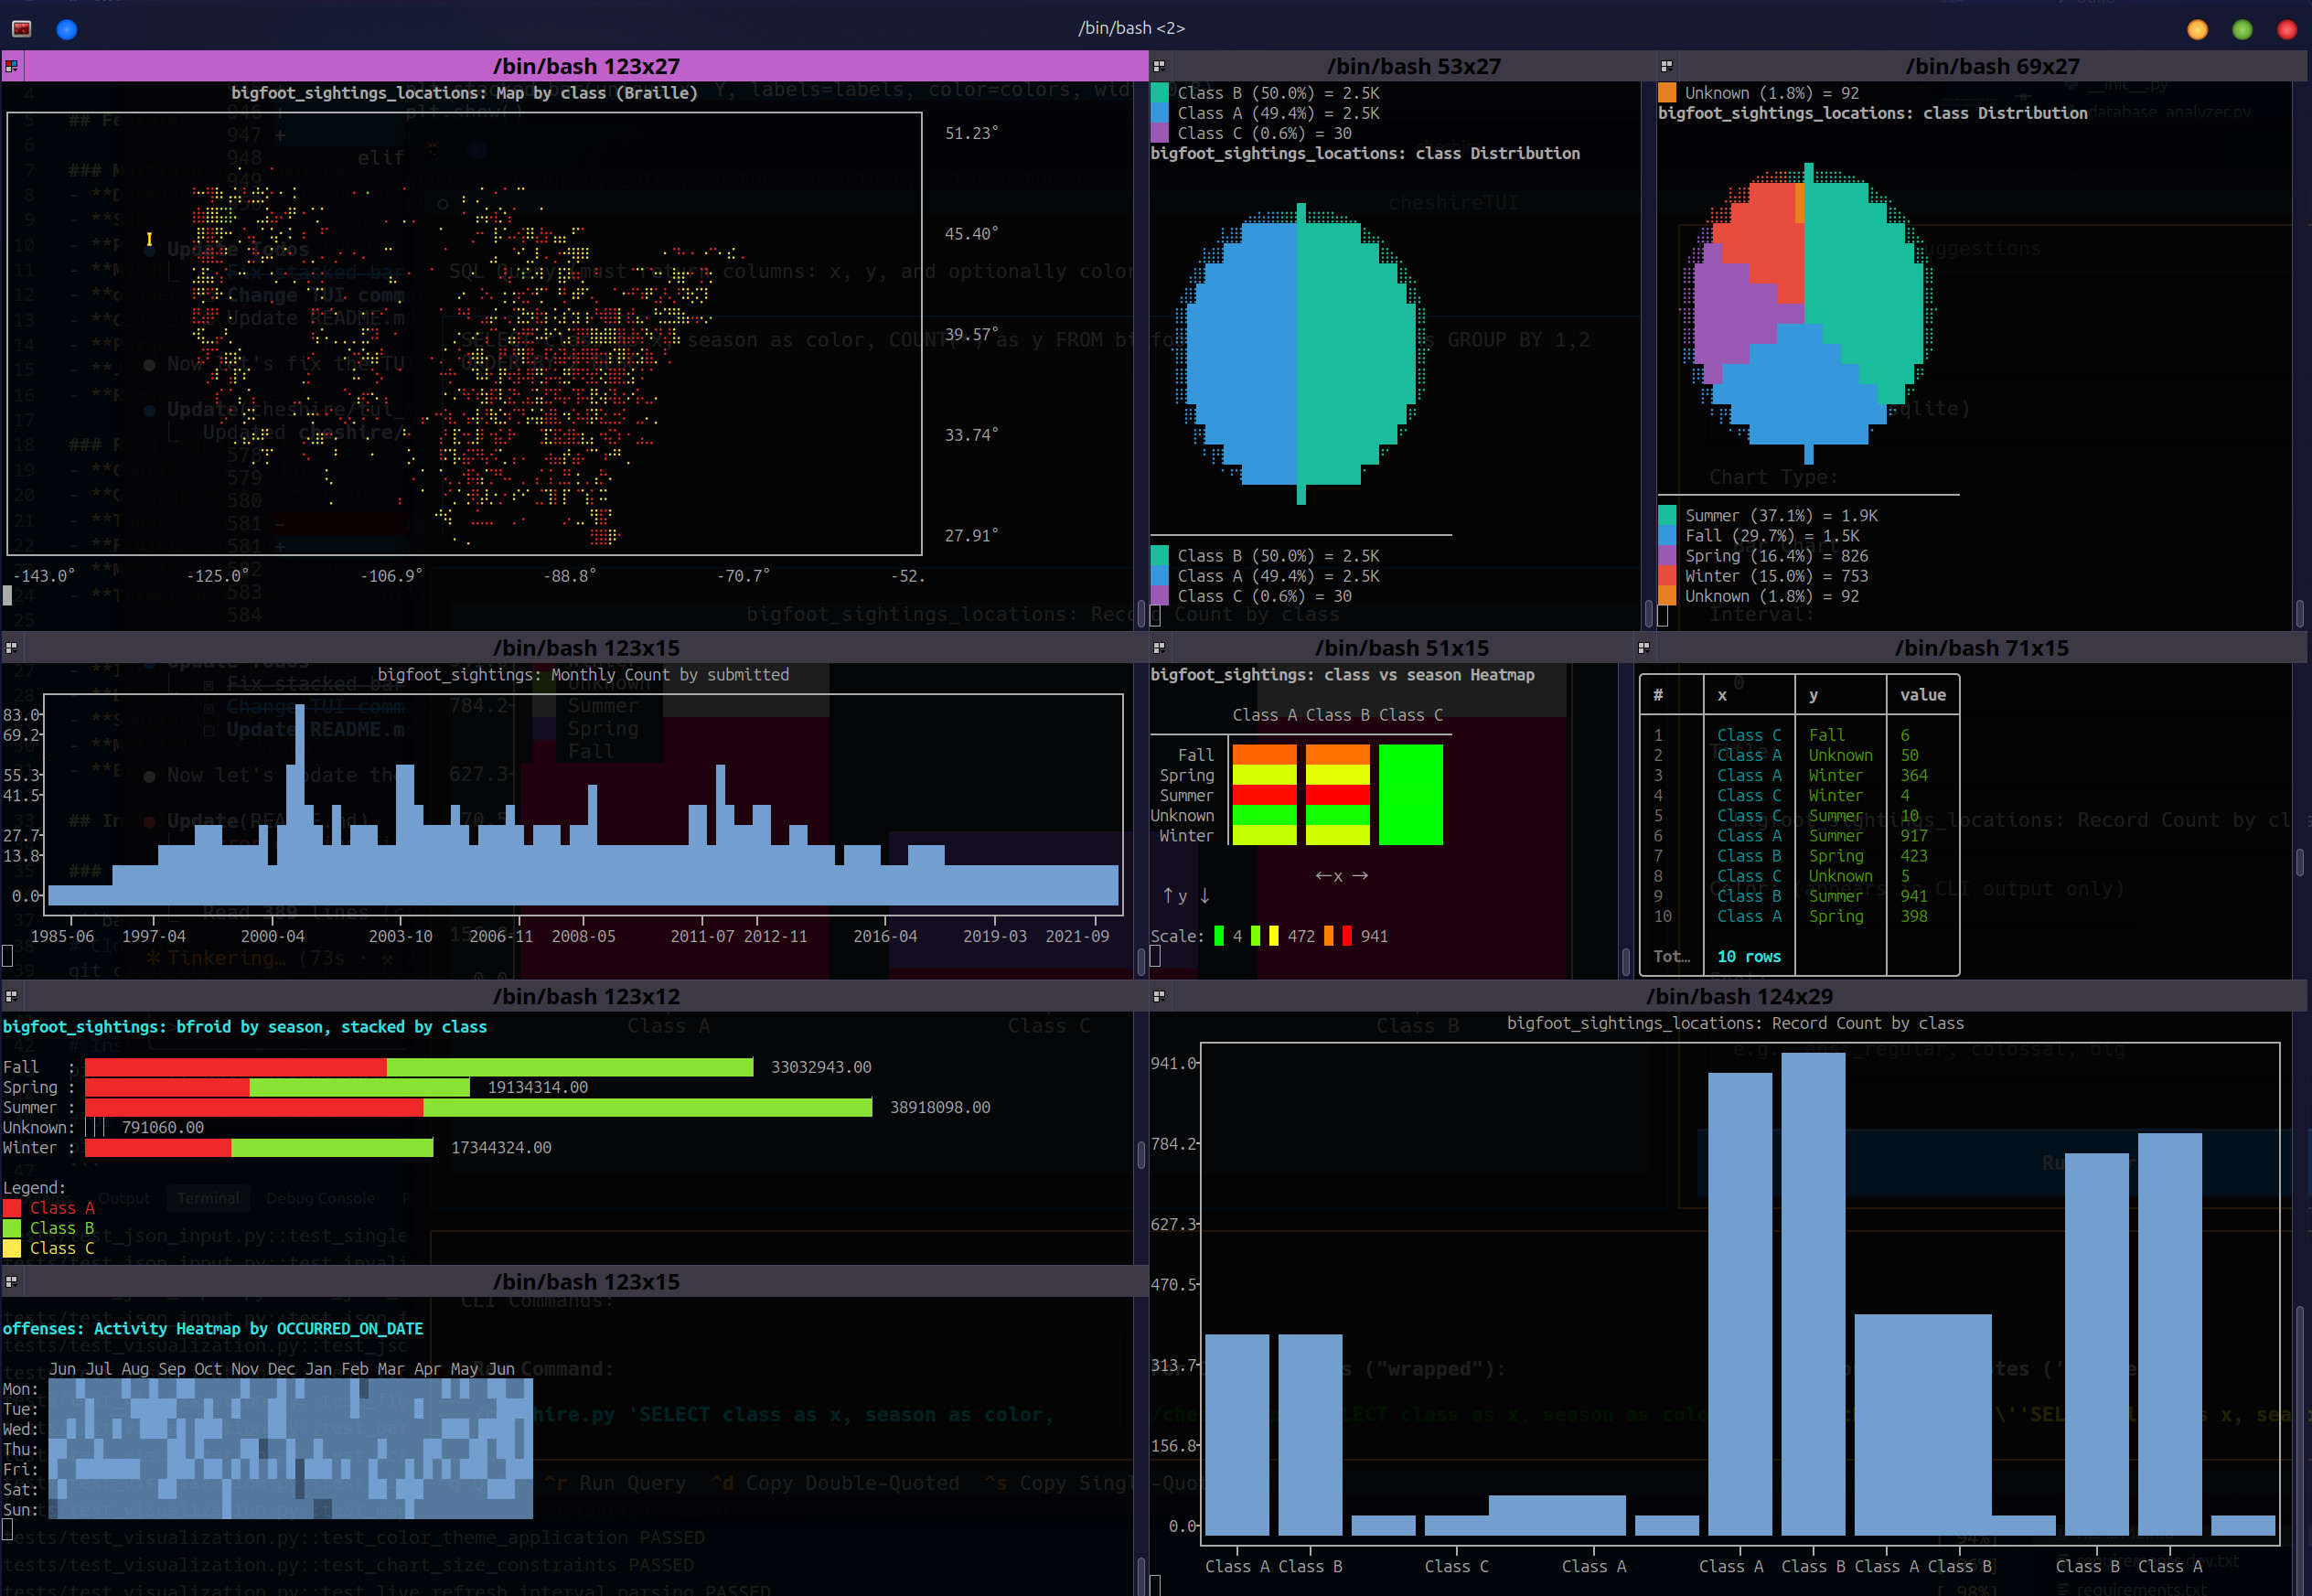
ANSI Visualizations
- Charts: Bar, line, scatter, histogram, pie, waffle, and more
- Geographic Maps: Point maps, heatmaps, density maps, cluster maps
- Tables: Rich formatted tables with colors and styling
- Figlet: Large ASCII art text for KPI callouts
- Matrix Heatmaps: 2D data visualization with color gradients
- Termgraph Charts: Alternative chart renderer with calendar heatmaps
Chart 'Suggestions'
- Sniff Database: Generate a number of basic charts of all kinds based on your data
- Browse and Modify: Look through the suggestions to use or adapt
Powerful Features
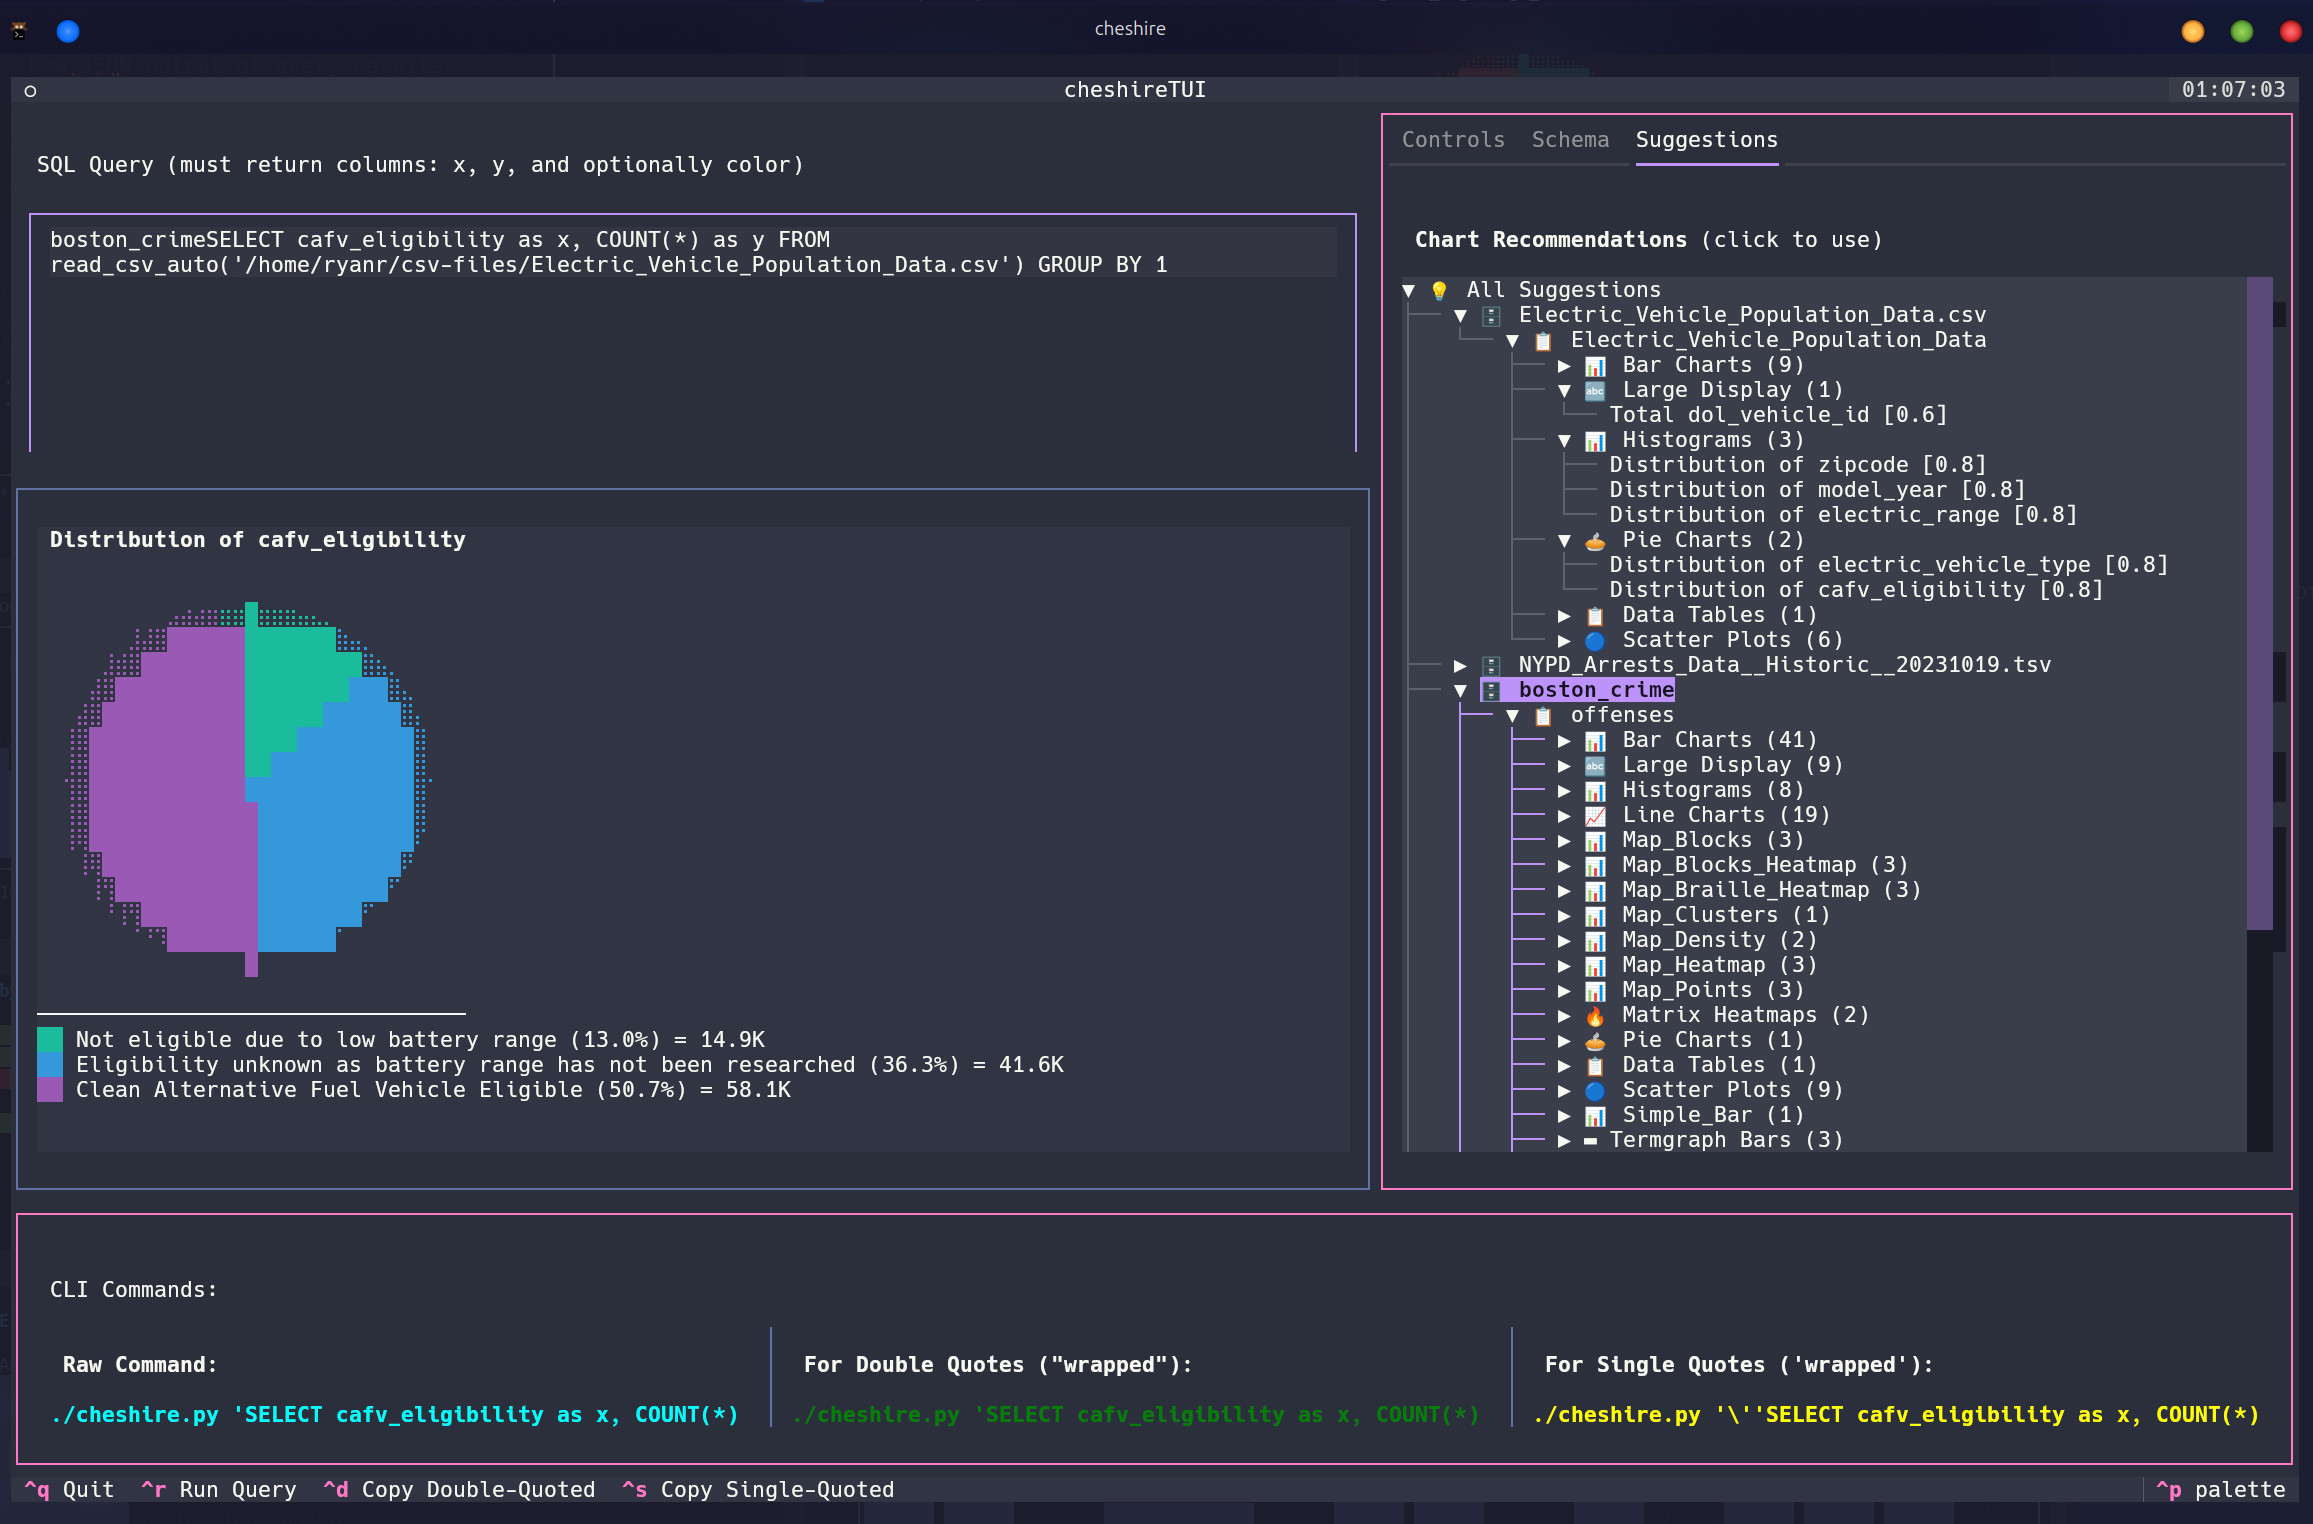
- Interactive TUI: Browse databases, preview queries, select charts
- Live Refresh: Auto-refresh charts at specified intervals
- Smart Analysis: Search your database and suggest appropriate charts
- Multiple Databases: Configure and switch between multiple data sources
- Export Support: Save visualizations or pipe to other tools
Installation
pip install cheshire-sql==0.1.2
Quick Start
Basic Usage
# Launch interactive TUI mode
cheshire

# Simple bar chart from SQLite
cheshire "SELECT product as x, SUM(sales) as y FROM sales GROUP BY product" bar --db sales.db

# Line chart with live refresh every 5 seconds
cheshire "SELECT time as x, cpu_usage as y FROM metrics ORDER BY time" line 5s --db metrics.db

# Geographic map from latitude/longitude data
cheshire "SELECT latitude as lat, longitude as lon FROM locations" map --db geo.db
Working with Files
# Query CSV files directly
cheshire "SELECT * FROM data WHERE sales > 1000" bar --csv sales.csv

# Analyze TSV file and generate suggestions for the TUI to browse
cheshire --sniff --tsv data.tsv

# Query Parquet files or folders
cheshire "SELECT category as x, AVG(price) as y FROM data GROUP BY category" bar --parquet /path/to/parquet/
Working with Remote Files (HTTP/HTTPS)
DuckDB can directly query files from HTTP/HTTPS URLs - perfect for demo data and shared datasets:
# Query remote Parquet file (most efficient format)
cheshire "SELECT int_col as x, COUNT(*) as y FROM data GROUP BY int_col ORDER BY int_col LIMIT 20" bar \
  --http "https://github.com/apache/parquet-testing/raw/master/data/alltypes_plain.parquet"

# Query remote CSV file
cheshire "SELECT species as x, COUNT(*) as y FROM data GROUP BY species" pie \
  --http "https://raw.githubusercontent.com/mwaskom/seaborn-data/master/iris.csv"

# Analyze remote dataset and generate chart suggestions
cheshire --sniff --http "https://raw.githubusercontent.com/mwaskom/seaborn-data/master/titanic.csv"

# NYC Taxi trip analysis
cheshire "SELECT payment_type as x, AVG(total_amount) as y FROM data GROUP BY payment_type" bar \
  --http "https://d37ci6vzurychx.cloudfront.net/trip-data/yellow_tripdata_2024-01.parquet" \
  --title "Average Fare by Payment Type"
Demo Datasets
Here are some publicly available datasets perfect for testing Cheshire:
Parquet Files (Recommended - Fast & Efficient)
- NYC Taxi Data:
https://d37ci6vzurychx.cloudfront.net/trip-data/yellow_tripdata_2024-01.parquet - Apache Test Data:
https://github.com/apache/parquet-testing/raw/master/data/alltypes_plain.parquet
CSV Files
- Iris Dataset:
https://raw.githubusercontent.com/mwaskom/seaborn-data/master/iris.csv - Titanic Dataset:
https://raw.githubusercontent.com/mwaskom/seaborn-data/master/titanic.csv - Flights Dataset:
https://raw.githubusercontent.com/mwaskom/seaborn-data/master/flights.csv - Tips Dataset:
https://raw.githubusercontent.com/mwaskom/seaborn-data/master/tips.csv
Example Queries for Demo Data
# Titanic survival analysis
cheshire "SELECT sex as x, AVG(survived)*100 as y FROM data GROUP BY sex" bar \
  --http "https://raw.githubusercontent.com/mwaskom/seaborn-data/master/titanic.csv" \
  --title "Titanic Survival Rate by Gender (%)"

# Iris species distribution
cheshire "SELECT species as x, AVG(petal_length) as y, species as color FROM data GROUP BY species" bar \
  --http "https://raw.githubusercontent.com/mwaskom/seaborn-data/master/iris.csv" \
  --title "Average Petal Length by Species"

# Monthly flight passengers over time
cheshire "SELECT year || '-' || month as x, passengers as y FROM data ORDER BY year, month" line \
  --http "https://raw.githubusercontent.com/mwaskom/seaborn-data/master/flights.csv" \
  --title "Monthly Flight Passengers"
Working with JSON Data
# Pipe JSON data directly into Cheshire
echo '[{"name": "Alice", "score": 90}, {"name": "Bob", "score": 85}]' | \
  cheshire "SELECT name as x, score as y FROM data" bar

# Read JSON from a file
cat sales.json | cheshire "SELECT product as x, SUM(amount) as y FROM data GROUP BY product" bar

# Use explicit --json-input flag
curl -s https://api.example.com/data | \
  cheshire "SELECT * FROM data WHERE value > 100" json --json-input

# Aggregate JSON data
echo '[
  {"category": "A", "value": 10},
  {"category": "B", "value": 20},
  {"category": "A", "value": 15}
]' | cheshire "SELECT category as x, SUM(value) as y FROM data GROUP BY category" pie

# Complex queries on JSON data
cat events.json | cheshire "
  SELECT
    DATE(timestamp) as x,
    COUNT(*) as y
  FROM data
  WHERE status = 'success'
  GROUP BY DATE(timestamp)
  ORDER BY x
" line
System Monitoring with osquery
# View running processes
cheshire "SELECT name as x, resident_size/1024/1024 as y FROM processes ORDER BY y DESC LIMIT 10" bar --database osquery

# Monitor CPU usage by process
cheshire "SELECT name as x, user_time + system_time as y FROM processes ORDER BY y DESC LIMIT 10" bar 5s --database osquery
Configuration
Create a cheshire.yaml file to configure databases and defaults:
databases:
  sales:
    type: duckdb
    path: /path/to/sales.db

  metrics:
    type: sqlite
    path: /path/to/metrics.db

  postgres_prod:
    type: postgres
    host: localhost
    port: 5432
    database: production
    user: readonly
    password: secret

  osquery:
    type: osquery  # Auto-detected if osqueryi is installed

default_database: sales

chart_defaults:
  theme: matrix
  markers: braille
  width: null  # Auto-detect
  height: null  # Auto-detect
Chart Types
Plotext Charts (Default)
Plotext is the primary charting library, providing colorful ANSI charts:
bar- Vertical bar chart (automatically stacks when color column provided)line- Line chart with optional markersscatter- Scatter plot with various marker styleshistogram- Distribution histogrambraille- Braille character scatter plot (high resolution)box- Box plot for statistical distributionssimple_bar- Simplified bar chartmultiple_bar- Multiple bar series side-by-sidestacked_bar- Explicitly stacked bar chart
Custom Implementations
These are custom-built visualizations unique to Cheshire:
pie- Pie chart with percentages (custom implementation)waffle- Waffle/square chart for proportions (custom implementation)matrix_heatmap- 2D matrix visualization with color gradients (custom implementation)
Geographic Maps (Custom)
Custom map renderer for geographic data (requires lat/lon columns):
mapormap_points- Point map with Braille charactersmap_blocks- Block-based point mapmap_density- Density heatmap overlaymap_clusters- Clustered point aggregationmap_heatmap- Geographic heatmap with color gradientsmap_blocks_heatmap- True color block heatmapmap_braille_heatmap- Braille character heatmap
Termgraph Charts
Alternative chart renderer using the termgraph library:
tg_bar- Horizontal bar charttg_hbar- Horizontal bar varianttg_multi- Multi-series bar charttg_stacked- Stacked bar charttg_histogram- Histogram with customizable binstg_calendar- Calendar heatmap for time series data
Tables and Text
rich_table- Formatted table with colors (uses Rich library)figlet- Large ASCII art text for KPIs (uses pyfiglet library)json- Raw JSON output of query results (built-in)
SQL Query Format
Queries must return specific column names depending on the chart type:
Standard Charts
SELECT
  category as x,      -- X-axis values
  SUM(amount) as y,   -- Y-axis values
  status as color     -- Optional: color grouping
FROM sales
GROUP BY category, status
Geographic Maps
SELECT
  latitude as lat,    -- Latitude
  longitude as lon,   -- Longitude
  sales as value      -- Optional: heat value
FROM store_locations
Pie/Waffle Charts
SELECT
  category as x,      -- Category labels
  COUNT(*) as y       -- Values
FROM products
GROUP BY category
Advanced Features
Live Refresh
Add an interval to auto-refresh charts:
cheshire "SELECT ..." bar 5s    # Refresh every 5 seconds
cheshire "SELECT ..." line 1m    # Refresh every minute
cheshire "SELECT ..." scatter 0.5h  # Refresh every 30 minutes
Database Analysis
Analyze a database to generate chart suggestions:
# Analyze configured database
cheshire --sniff --database sales

# Analyze SQLite file
cheshire --sniff --db mydata.db

# Analyze CSV file
cheshire --sniff --csv data.csv

# Analyze Parquet folder
cheshire --sniff --parquet /data/parquet/
Chart Size Control
# Set explicit width and height in characters
cheshire "SELECT ..." bar --width 60 --height 20

# Use percentage of terminal size
cheshire "SELECT ..." line --width "80%" --height "50%"

# Mix absolute and percentage
cheshire "SELECT ..." scatter --width "75%" --height 15

# Small inline charts
cheshire "SELECT ..." bar --width 40 --height 8
Color Customization
# Named colors
cheshire "SELECT ..." bar --color red

# Hex colors
cheshire "SELECT ..." line --color "#FF5733"

# Themes
cheshire "SELECT ..." scatter --theme matrix
Script-Friendly Output
# Don't clear terminal before rendering (useful for scripts/logs)
cheshire "SELECT ..." bar --no-clear

# Capture output in scripts without terminal clearing
echo "=== Sales Report ===" >> report.log
cheshire "SELECT product as x, SUM(sales) as y FROM data GROUP BY 1" bar --no-clear >> report.log

# Build dashboards with multiple charts
cheshire "SELECT ..." pie --no-clear
cheshire "SELECT ..." bar --no-clear
cheshire "SELECT ..." line --no-clear
Interactive TUI Mode
Launch without arguments to enter the interactive TUI:
cheshire
Features:
- Database browser with table listings
- SQL query editor with syntax highlighting
- Live preview of query results
- Chart type selector with recommendations
- Keyboard navigation and shortcuts
TUI Keyboard Shortcuts
Tab- Switch between panelsEnter- Execute query/select itemEsc- Exit/cancelCtrl+Q- Quit applicationCtrl+C- Copy current chart's CLI
Examples
Sales Dashboard
# Top products by revenue
cheshire "SELECT product as x, SUM(revenue) as y FROM sales GROUP BY product ORDER BY y DESC LIMIT 10" bar --db sales.db

# Sales trend over time
cheshire "SELECT DATE(order_date) as x, SUM(amount) as y FROM orders GROUP BY 1 ORDER BY 1" line --db sales.db

# Geographic distribution
cheshire "SELECT store_lat as lat, store_lon as lon, SUM(sales) as value FROM stores GROUP BY lat, lon" map_heatmap --db sales.db
System Monitoring
# Memory usage by process
cheshire "SELECT name as x, resident_size/1024/1024 as y FROM processes WHERE resident_size > 0 ORDER BY y DESC LIMIT 15" bar --database osquery

# Network connections
cheshire "SELECT remote_address as x, COUNT(*) as y FROM process_open_sockets GROUP BY remote_address ORDER BY y DESC LIMIT 10" bar --database osquery

# CPU time distribution
cheshire "SELECT name as x, (user_time + system_time) as y FROM processes ORDER BY y DESC LIMIT 20" pie --database osquery
Data Analysis
# Analyze CSV and view suggestions
cheshire --sniff --csv sales_data.csv

# Query Parquet files with complex aggregations
cheshire "WITH monthly AS (SELECT DATE_TRUNC('month', date) as month, SUM(sales) as total FROM data GROUP BY 1) SELECT month as x, total as y FROM monthly ORDER BY month" line --parquet /data/

# Join multiple data sources using DuckDB
cheshire "SELECT c.name as x, SUM(s.amount) as y FROM read_csv_auto('customers.csv') c JOIN sales s ON c.id = s.customer_id GROUP BY c.name" bar --db sales.db

# Export query results as JSON for further processing
cheshire "SELECT * FROM sales WHERE date >= '2024-01-01'" json --db sales.db > sales_2024.json
Troubleshooting
Common Issues
No color output: Force color mode with environment variable:
FORCE_COLOR=1 cheshire "SELECT ..." bar
Database not found: Check file path or configure in cheshire.yaml:
cheshire --list-databases # Show configured databases
osquery not detected: Ensure osqueryi is installed and in PATH:
which osqueryi # Should show path to osqueryi
Chart too large/small: Adjust terminal size or set explicit dimensions:
# In cheshire.yaml
chart_defaults:
  width: 80
  height: 24
License
MIT License - See LICENSE file for details
Contributing
Contributions are welcome! Please feel free to submit issues and pull requests.
Acknowledgments
Built with amazing open-source libraries including DuckDB, plotext, Rich, and many others.
Release history Release notifications | RSS feed


Download files
Download the file for your platform. If you're not sure which to choose, learn more about installing packages.
Source Distribution
Built Distribution
Filter files by name, interpreter, ABI, and platform.
If you're not sure about the file name format, learn more about wheel file names.
Copy a direct link to the current filters
File details
Details for the file cheshire_sql-0.1.2.tar.gz.
File metadata
- Download URL: cheshire_sql-0.1.2.tar.gz
- Upload date:
- Size: 117.3 kB
- Tags: Source
- Uploaded using Trusted Publishing? No
- Uploaded via: twine/6.1.0 CPython/3.12.3
File hashes
| Algorithm | Hash digest | |
|---|---|---|
| SHA256 |
43753bc5b2a3343bfe86f72b9eafa6d54cb150d3ba2bcb6981756766a3ae753a
|
|
| MD5 |
e9bf98e4a008b99e8a46fdbf95031c90
|
|
| BLAKE2b-256 |
b34dbda7f4ca6633e5732fb6d284912c3498e11768390c6a2cabf35df7fad2f9
|
File details
Details for the file cheshire_sql-0.1.2-py3-none-any.whl.
File metadata
- Download URL: cheshire_sql-0.1.2-py3-none-any.whl
- Upload date:
- Size: 107.1 kB
- Tags: Python 3
- Uploaded using Trusted Publishing? No
- Uploaded via: twine/6.1.0 CPython/3.12.3
File hashes
| Algorithm | Hash digest | |
|---|---|---|
| SHA256 |
9bcee10a6b7255eaadb69a54a19ca87578c0a2b179ab39b28c5a204b4e172401
|
|
| MD5 |
f9eec01e267355686abcb2ba28d0034d
|
|
| BLAKE2b-256 |
93981fd8306121097d98746e7bdaedf0e80c5c43cc6b436fac59e2870fe553c9
|


