
chessanalytics_st
Graphical representation of functions from chessanalytics designed for Streamlit apps.
NOTE.
Not all functions from chessanalytics could be presented in graphical way. Functions returning single integer or two-element list do not have huge potential of graphical representation. That is why the two libraries may vary a little - chessanalytics_st does not have all functions from chessanalytics, but has some that chessanalytics does not have. This library strictly focuses on streamlit and uses 'st.' functions for plotting, representing data and so on.
Installation.
$ pip install chessanalytics_st
Initializing class.
  from chessanalytics_st import CAST
  cast = CAST('path/to/file/with/games', 'username')
W/D/L Functions.
WDL_date
Generates a plot showing the win, draw, and loss statistics by date.
    Params:
    - colors (list): A list of colors for the bars representing win, draw, and loss. Default is ['green', 'gray', 'red'].
    - title (str): The title of the chart. Default is 'Win/Draw/Loss stats by date'.
    - xaxis_name (str): The label for the x-axis. Default is 'Date'.
    - yaxis_name (str): The label for the y-axis. Default is 'Number of games'.
WDL_day
Generates a plot showing the win, draw, and loss statistics by day.
    Params:
    - colors (list): A list of colors for the bars representing win, draw, and loss. Default is ['green', 'gray', 'red'].
    - title (str): The title of the chart. Default is 'Win/Draw/Loss stats by day'.
    - xaxis_name (str): The label for the x-axis. Default is 'Day'.
    - yaxis_name (str): The label for the y-axis. Default is 'Number of games'.
WDL_opening
Generates a plot showing the win, draw, and loss statistics by opening.
    Params:
    - colors (list): A list of colors for the bars representing win, draw, and loss. Default is ['green', 'gray', 'red'].
    - title (str): The title of the chart. Default is 'Win/Draw/Loss stats by opening'.
    - xaxis_name (str): The label for the x-axis. Default is 'Opening'.
    - yaxis_name (str): The label for the y-axis. Default is 'Number of games'.
WDL_part
Generates a plot showing the win, draw, and loss statistics by part of the day.
    Params:
    - type (str): The type of chart to display. Default is 'pie'. Options are 'pie' or 'bar'.
    - colors (list): A list of colors for the bars representing win, draw, and loss. Default is ['green', 'gray', 'red'].
    - title (str): The title of the chart. Default is 'Win/Draw/Loss stats by opening'.
    - xaxis_name (str): The label for the x-axis. Default is 'Opening'.
    - yaxis_name (str): The label for the y-axis. Default is 'Number of games'.
WDL_time
Generates a bar chart showing the win, draw, and loss statistics by time.
    Parameters:
    - colors (list): A list of colors for the bars representing win, draw, and loss. Default is ['green', 'gray', 'red'].
    - title (str): The title of the chart. Default is 'Win/Draw/Loss stats by time'.
    - xaxis_name (str): The label for the x-axis. Default is 'Hour'.
    - yaxis_name (str): The label for the y-axis. Default is 'Number of games'.
WDL_accurate_elo
Displays the win/draw/loss statistics in st.metric format against players with a specified Elo rating range.
    Parameters:
    - elo (int): The Elo rating of the players to compare against.
    - colors (list): A list of colors to use for the metrics. Default is ['green', 'gray', 'red'].
    - title (bool): Whether to display the title. Default is True.
WDL_elo
Generates a bar plot or dataframe showing the win/draw/loss statistics by opponent's elo.
    Parameters:
    - plot (str): Specifies the type of plot to generate. Default is 'bar'. Options are 'bar' or 'df'.
    - colors (list): Specifies the colors for the bars in the plot. Default is ['green', 'gray', 'red'].
    - title (str): Specifies the title of the plot. Default is "Win/Draw/Loss stats by opponent's elo".
    - xaxis_name (str): Specifies the label for the x-axis. Default is 'elo'.
    - yaxis_name (str): Specifies the label for the y-axis. Default is 'Number of games'.
WDL_time_control
Generates a pie chart visualization of the win/draw/loss statistics by time control.
    Parameters:
    - title (str): The title of the chart. Default is 'Win/Draw/Loss stats by time control'.
    - colors (list): The colors for the bar chart. Default is ['green', 'gray', 'red'].
    - xaxis_name (str): The label for the x-axis. Default is 'Time control'.
    - yaxis_name (str): The label for the y-axis. Default is 'Number of games'.
WDL_gametype
Generates a pie chart or dataframe showing the win/draw/loss statistics by game type.
    Params:
    - plot (str): The type of chart to display. Default is 'pie'. Options are 'pie', 'bar' or 'df'.
    - colors (list): The colors for the pie chart. Default is ['green', 'gray', 'red'].
    - title (str): The title of the chart. Default is 'Win/Draw/Loss stats by game type'.
    - xaxis_name (str): The label for the x-axis. Default is 'Game type'.
    - yaxis_name (str): The label for the y-axis. Default is 'Number of games'.
    - plot_height (int): The height of the chart in pixels. Default is 700.
    - plot_hole (float): The size of the hole in the center of the pie chart. Default is 0.3.
Time related Functions.
ranked_unranked
Generates a pie chart showing the distribution of ranked and unranked games.
    Params:
    - title (str): The title of the chart. Default is 'Ranked vs Unranked games'.
count_games_date
Generates a plotly chart showing the count of games played by date.
    Parameters:
    - type (str): The type of chart to display. Options are 'bar' (default) or 'scatter'.
    - yaxis_name (str): The label for the y-axis. Default is 'Number of games'.
    - xaxis_name (str): The label for the x-axis. Default is 'Day'.
    - title (str): The title of the chart. Default is 'Number of games played by date'.
bullet_progress
Generates a plot showing the progress of the player's elo progress in bullet games over time.
    Params:
    - x_title (str): The title of the x-axis. Default is 'Number of games'.
    - y_title (str): The title of the y-axis. Default is 'Elo'.
    - plot_title (str): The title of the plot. Default is 'Elo progress over time'.
Same functions for different time controls are:
- blitz_progress
- rapid_progress
bullet_progress_date
Generates a plot showing the progress of the player's elo progress in bullet games by date.
    Params:
    - title (str): The title of the plot. Default is 'Bullet elo progress by date'.
    - x_title (str): The title of the x-axis. Default is 'Date'.
    - y_title (str): The title of the y-axis. Default is 'Elo'.
Same functions for different time controls are:
- blitz_progress_date
- rapid_progress_date
bullet_progress_hour
Generates a plot showing the progress of the player's elo progress in bullet games by hour of game.
    Params:
    - title (str): The title of the plot. Default is 'Bullet elo progress by hour'.
    - x_title (str): The title of the x-axis. Default is 'Hour'.
    - y_title (str): The title of the y-axis. Default is 'Elo'.
    - type (str): The type of plot to generate. Default is 'bar'. Options are 'bar' or 'line'.
Same functions for different time controls are:
- blitz_progress_hour
- rapid_progress_hour
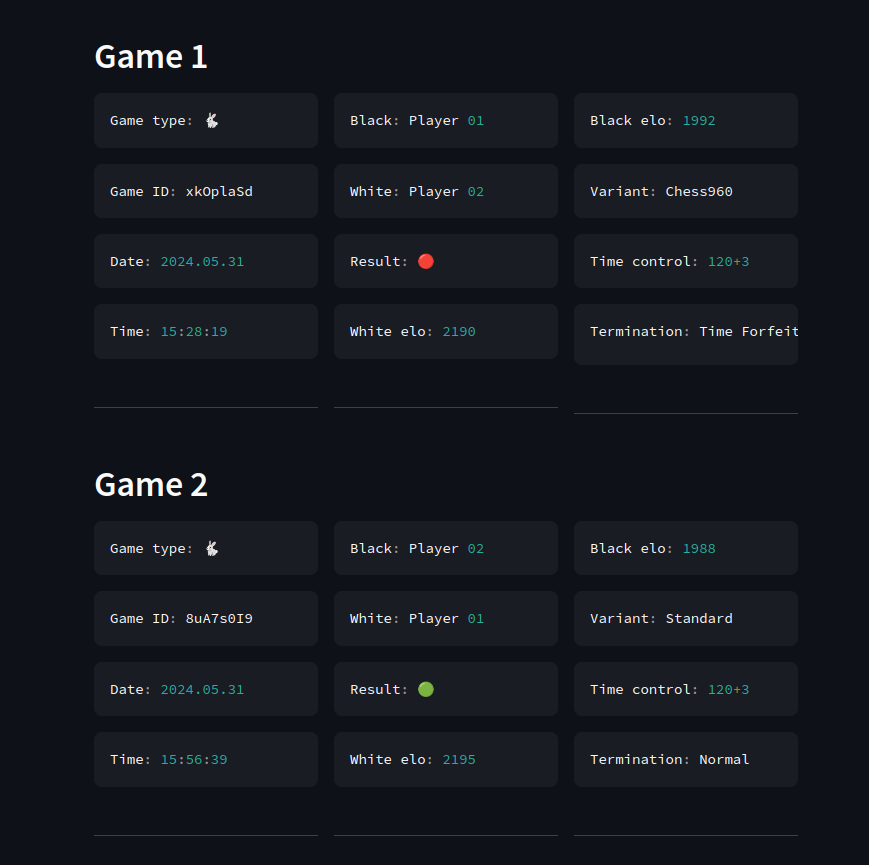
last_games_stats
Generates a plot showing the statistics of the last games played.
    Params:
    - title (str): The title of the plot. Default is 'Last games stats'.
    - amount (int): The number of games to display. Default is 20.
    - plot_type (str): The type of plot to generate. Default is 'metric_flashy'. Options are 'df', 'metric_classy', 'metric_flashy', 'json'.
To display info st.code() is used (for visual effects) but even if your opponent name is "print(chess)" it will not affect the plot at all, except looking slightly different. The chart itself looks like this:
Heatmaps and graphical representation of the board.
rook_moves
Generates a heatmap of the squares where the Rook moves were made.
Same function for different piece types are:
-
king_moves
-
queen_moves
-
bishop_moves
-
knight_moves
   Params:
   - plot_colorscale (str): The colorscale to use for the heatmap. Default is 'Viridis'.
   - title (str): The title of the heatmap. Default is '(PIECE) moves heatmap'.
squares_rook_captures
Generates a heatmap of the squares where the Rook captures were made.
Same function for different piece types are:
-
squares_king_captures
-
squares_queen_captures
-
squares_bishop_captures
-
squares_knight_captures
-
squares_pawn_captures
  Params:
  - plot_colorscale (str): The colorscale to use for the heatmap. Default is 'Viridis'.
  - title (str): The title of the heatmap. Default is 'Squares with (PIECE) captures'.
  - plot_showscale (bool): Whether to show the color scale. Default is True.
squares_with_mates
Generates a heatmap of the squares where the checkmates were made.
    Params:
    - plot_colorscale (str): The colorscale to use for the heatmap. Default is 'plasma'.
    - title (str): The title of the heatmap. Default is 'Squares with checkmates'.
    - plot_showscale (bool): Whether to show the color scale. Default is True.
    - opg (bool): Whether to show only the player's games. Default is False.
squares_with_checks
Generates a heatmap of the squares where the checks were made.
    Params:
    - plot_colorscale (str): The colorscale to use for the heatmap. Default is 'plasma'.
    - title (str): The title of the heatmap. Default is 'Squares with checks'.
    - plot_showscale (bool): Whether to show the color scale. Default is True.
    - opg (bool): Whether to show only moves from the player's games. Default is False.
squares_with_captures
Generates a heatmap of the squares where the captures were made.
    Params:
    - plot_colorscale (str): The colorscale to use for the heatmap. Default is 'plasma'.
    - title (str): The title of the heatmap. Default is 'Squares with captures'.
    - plot_showscale (bool): Whether to show the color scale. Default is True.
    - opg (bool): Whether to show only moves from the player's games. Default is False.
How does heatmap plots look?
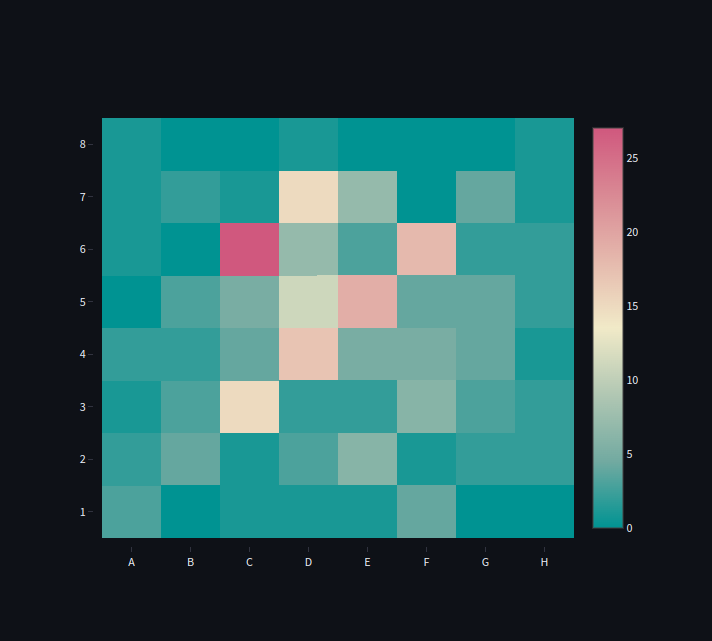
This is a sample heatmap of king_square_captures() with default params (colorscale set to 'plotly3', showscale set to False). Note that setting off showscale makes heatmap look more like a rect than square and less readable.
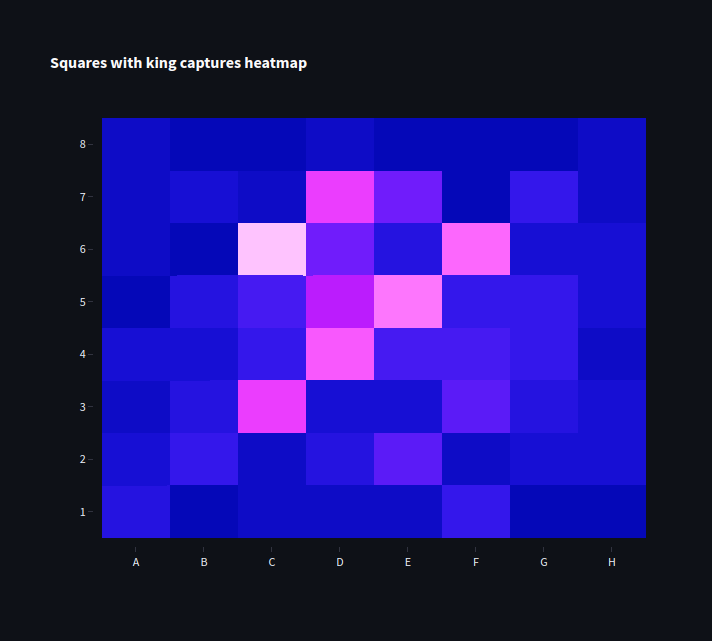
Here you can see how does the heatmap look without the title.
TIPS AND TRICKS.
-
If you do not like how does the title look but setting it to 'None' makes the plot/heatmap look worse, set the title to " " (one space sign).
-
If you do not like how particular funcion look but want to plot it using Streamlit, just call the function from chessanalytics library and plot it yourself.
-
You can check output of almost all of the functions available in the lib here:
1 maintainer

Metadata
1 maintainer
Release files for chessanalytics-st 0.3.0
For a detailed explanation of source distributions (sdists) and built distributions (wheels), please see the package formats documentation.
Source distribution (sdist)
| File | Size | Uploaded | |
|---|---|---|---|
| chessanalytics_st-0.3.0.tar.gz | 11.7 kB | Details |
Built distribution (wheel)
| File | Interpreter | ABI | Platform | Reset |
|---|---|---|---|---|
| chessanalytics_st-0.3.0-py3-none-any.whl | Python 3 | none | any | Details |
Total release size: 22.6 kB
Release files / chessanalytics_st-0.3.0.tar.gz
| Download URL | chessanalytics_st-0.3.0.tar.gz |
|---|---|
| Size | 11.7 kB |
| Tags | Source |
|
SHA-256 checksum How to use checksums |
46e384f0212c3106b0a3f2431add9ef7f3fd3fde06799e15efbcfaded90804d1
|
|
BLAKE2b-256 checksum How to use checksums |
5f15c15f00aa7ddcb5f6623cc495ef7349d9719410babb592126a6d94c7b7f40
|
| Upload date | |
|
Uploaded using Trusted Publishing? What is trusted publishing? |
No |
| Uploaded via |
twine/5.1.1 CPython/3.9.19
|
Release files / chessanalytics_st-0.3.0-py3-none-any.whl
| Download URL | chessanalytics_st-0.3.0-py3-none-any.whl |
|---|---|
| Size | 10.9 kB |
| Tags | Python 3 |
|
SHA-256 checksum How to use checksums |
a65840592ca11ac457f2dd418b195d3f3acebc716f6ac079504760e4fafab0f4
|
|
BLAKE2b-256 checksum How to use checksums |
bd3930e2d678c35dec4c674869ca84cfdf1f5de6722d5a1b3316e43295540c20
|
| Upload date | |
|
Uploaded using Trusted Publishing? What is trusted publishing? |
No |
| Uploaded via |
twine/5.1.1 CPython/3.9.19
|














