
cleanfig






Clean, opinionated, vector-first scientific plotting for Python.
cleanfig is a small Rust/Python plotting package for clean scientific figures with vector-first export.
It is intentionally narrow: simple publication-style defaults, light visual clutter, compact labeling, and a small public API. The focus is on figures that should look close to final output without extensive styling code.
Useful links:
- Gallery: https://adakite.github.io/cleanfig/gallery/
- Documentation landing page: https://adakite.github.io/cleanfig/
- Repository: https://github.com/adakite/cleanfig
Installation
Install from PyPI:
pip install cleanfig
Install the latest development GitHub version:
pip install git+https://github.com/adakite/cleanfig.git
Quick Start
import numpy as np
import cleanfig as cf

x = np.linspace(0, 10, 200)
y = np.sin(x)

fig = cf.figure(width="single", height=3.4, panel_labels=False)
ax = fig.panel(0, 0)
ax.line(x, y, label="signal")
ax.scatter(x[::20], y[::20], size=5)
ax.xlabel("x")
ax.ylabel("y")

fig.save("basic_line.svg")
fig.save("basic_line.html")
fig.save("basic_line.pdf")
Public API
The package is designed to be used as:
import cleanfig as cf
Current public entry points:
cf.figure(...)Figure.panel(row, col)Figure.save(path)Panel.scatter(...)Panel.line(...)Panel.bar(...)Panel.histogram(...)Panel.field(...)Panel.violin(...)Panel.box(...)Panel.colorbar(...)Panel.legend()Panel.xlabel(...)Panel.ylabel(...)Panel.right_ylabel(...)Panel.xscale(...)Panel.yscale(...)Panel.limits(...)Panel.right_limits(...)
API Reference
cf.figure(width="single", height=4.0, grid=(1, 1), panel_labels=False, font=None, theme="publication", layout="standard")
width:"single"or"double"height: figure height in inchesgrid:(rows, cols)panel_labels: add panel lettersfont: custom font family stringtheme:"publication"/"nature"/"light"alias, or"dark"layout:"standard"or"timeseries"
For layout="timeseries", cleanfig uses an internal wide-format figure width optimized for stacked time series panels, so width is ignored.
Axis labels, limits, and scales
ax.xlabel(label)ax.ylabel(label)ax.right_ylabel(label): label for a secondary right Y axisax.limits(x=None, y=None): explicit limits for the main X/Y axesax.right_limits(y=None): explicit limits for the right Y axisax.xscale("linear" | "log")ax.yscale("linear" | "log", axis="left" | "right")
Log scales require strictly positive values and strictly positive limits.
ax.scatter(x, y, color=None, size=6.0, alpha=0.8, label=None, cmap=None, yaxis="left")
x,y: same-length numeric arrayscolor: named/hex color or numeric array for colormap mappingsize: marker diameter in pointsalpha: opacitylabel: legend entrycmap: colormap name for mapped colors; seeBuilt-in Colormapsbelowyaxis:"left"or"right"for dual-Y figures
Returns a PlotHandle when color mapping is used.
ax.line(x, y, color=None, width=1.2, alpha=1.0, label=None, yaxis="left")
color: named/hex colorwidth: stroke width in pointsalpha: opacitylabel: legend entryyaxis:"left"or"right"
ax.bar(labels, values, yaxis="left", color=None, alpha=1.0, show_x_axis=False)
labels: categorical X labelsvalues: numeric heightsyaxis:"left"or"right"color: named/hex coloralpha: opacityshow_x_axis: draw the bottom X axis line and ticks for bar charts
ax.histogram(data, bins=12, range=None, density=False, color=None, alpha=1.0, label=None, yaxis="left")
data: numeric samplesbins: number of binsrange: optional(min, max)binning rangedensity: normalize to probability density instead of countscolor: named/hex fill coloralpha: opacitylabel: legend entryyaxis:"left"or"right"
ax.field(grid, cmap=None, cell_edges=False, render="auto")
grid: 2D numeric arraycmap: colormap name; seeBuilt-in Colormapsbelowcell_edges: draw subtle cell borders whenTruerender:"auto","grid", or"embedded"
render="auto" is the default. In the Rust backend, dense fields automatically switch to an embedded raster image to avoid visible seams between cells, while smaller fields remain grid/vector based. Use "grid" to force cell-by-cell rendering or "embedded" to force the rasterized field image path.
Returns a PlotHandle for optional colorbar creation.
ax.colorbar(handle, label=None, placement=None, style=None)
handle: result of a mappedscatter,field, or mapped-pointviolinlabel: colorbar labelplacement:"right"or"inside-left"style:"binned"or"continuous"
Current default is "binned".
ax.violin(data, labels=None, show_median=False, points=False, point_color=None, point_size=4.0, point_alpha=0.75, point_cmap=None)
data: grouped numeric datalabels: category labelsshow_median: draw median segmentpoints: overlay individual pointspoint_color: constant color, flat array, or grouped arrayspoint_size: point diameterpoint_alpha: point opacitypoint_cmap: colormap for mapped points; seeBuilt-in Colormapsbelow
Returns a PlotHandle when mapped point colors are used.
ax.box(data, labels=None)
data: grouped numeric datalabels: category labels
ax.legend()
Creates a compact frameless legend from labeled layers.
Current Feature Status
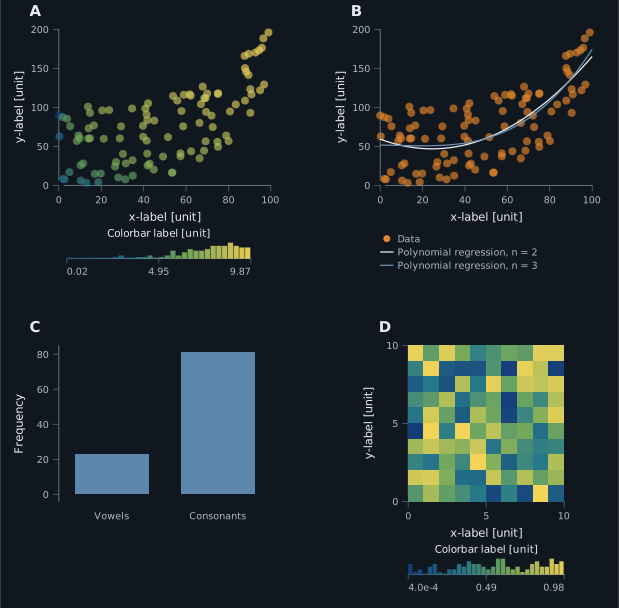
- Supported: line, scatter, bar, histogram, violin, box, field plots with auto grid/embedded rendering
- Supported: light/dark themes, log X/Y axes, dual Y axes, SVG/HTML/PDF export
- Not supported yet:
ax.spectrogram(), logarithmic colorbars, geographic projections
Examples
Useful example scripts are provided in examples/:
basic_line.pyfour_panels.pyviolin_box_light.pyesec_dual_y_light.pyfor a light-theme dual-Y example using apandas.DataFrameloaded from a bundled ESEC catalog extract inexamples/Data/weather_timeserie_check.pyfor a compact multi-altitude time-series example built from a small CSV andnumpynotebook_example.pyfor an IPython-friendly scatter example that saves SVG and displays it inline when run in a notebook- theme-specific wrappers for light/dark example output
Export Formats
Supported export targets:
SVGHTMLwith embedded SVGPDFthrough SVG conversion in the Rust backend
Built-in Colormaps
cleanfig currently ships with a larger built-in continuous colormap set.
General:
graymagmabone
Fabio Crameri family currently integrated:
- Sequential-ish:
acton,bamako,batlow,bilbao,devon,hawaii,imola,lajolla,lapaz,lipari,navia,nuuk,oslo,tokyo,turku - Diverging / balanced:
berlin,broc,cork,managua,roma,tofino,vanimo,vik
Notes:
- These Crameri maps were integrated as built-in names so the plotting API stays unchanged:
cmap="roma",cmap="batlow", etc. - Unknown colormap names still fall back to
batlow. - Colormap attribution and licensing notice: LICENSE-THIRD-PARTY.md
Citation for the integrated Scientific colour maps:
Crameri, F. (2023). Scientific colour maps (8.0.1). Zenodo. https://doi.org/10.5281/zenodo.8409685
Design Philosophy
- vector-first output
- clean left/bottom axes by default
- minimal plot constructors
- no GUI, dashboards, or heavyweight plotting state
- useful scientific defaults over maximum flexibility
Fallback Behavior
cleanfig prefers the compiled Rust extension.
If the extension is unavailable, it falls back to a pure Python implementation. The fallback is intended for graceful local use and testing, but it is not feature-complete. In particular, PDF export is only available when the Rust backend is loaded.
You can inspect the active backend with:
import cleanfig as cf
print(cf.BACKEND)
Current Limitations
- no
ax.spectrogram()yet - no logarithmic colorbars
- no standalone raster plotting backend beyond embedded dense field rendering
- no geographic projections
- visual styling is intentionally constrained
- the Python fallback keeps field rendering grid-based even when
render="embedded"is requested
Development Install
python -m venv .venv
source .venv/bin/activate
python -m pip install -U pip
python -m pip install -e ".[dev]"
maturin develop
pytest -q
The esec_dual_y_light.py example additionally expects pandas, which is included in the dev extra. The bundled ESEC source file and citation notes are stored under examples/Data/.
Citation, License, Contact
- License: MIT, see
LICENSE - Changelog:
CHANGELOG.md - Release checklist:
RELEASE.md - Contact: Antoine Lucas
1 maintainer

Release files for cleanfig 1.4.0
For a detailed explanation of source distributions (sdists) and built distributions (wheels), please see the package formats documentation.
Source distribution (sdist)
| File | Size | Uploaded | |
|---|---|---|---|
| cleanfig-1.4.0.tar.gz | 388.6 kB | Details |
Built distributions (wheels)
| File | Interpreter | ABI | Platform | Reset |
|---|---|---|---|---|
| cleanfig-1.4.0-cp310-abi3-manylinux_2_17_x86_64.manylinux2014_x86_64.whl | CPython 3.10 | abi3 | Linux glibc 2.17+ x86-64 | Details |
| cleanfig-1.4.0-cp310-abi3-macosx_10_12_x86_64.macosx_11_0_arm64.macosx_10_12_universal2.whl | CPython 3.10 | abi3 | macOS 10.12+ x86-64, macOS 11.0+ ARM64, macOS 10.12+ universal2 (ARM64, x86-64) | Details |
Total release size: 6.6 MB
Release files / cleanfig-1.4.0.tar.gz
| Download URL | cleanfig-1.4.0.tar.gz |
|---|---|
| Size | 388.6 kB |
| Tags | Source |
|
SHA-256 checksum How to use checksums |
ace10b9853375eaf57e7c08d822f578cb751a12d7ff38317317b87a1fadffa55
|
|
BLAKE2b-256 checksum How to use checksums |
1f76db9e242ac38642391f7e6c3b00d095a1065c9cbbe3e356527a0d5ac6fc72
|
| Upload date | |
|
Uploaded using Trusted Publishing? What is trusted publishing? |
Yes |
| Uploaded via |
twine/6.1.0 CPython/3.13.12
|
Provenance
Provenance describes where a file came from. On PyPI, provenance is shared via attestations, which provide a verifiable record of the build or publishing details. View details, limitations and caveats.


PyPI Publish Attestation
PyPI verified that this artifact, at this checksum, originated from the publisher listed below.
Signed by GitHub Actions, verified by PyPI on Jul 15, 2026.
Transparency logRelease files / cleanfig-1.4.0-cp310-abi3-manylinux_2_17_x86_64.manylinux2014_x86_64.whl
| Download URL | cleanfig-1.4.0-cp310-abi3-manylinux_2_17_x86_64.manylinux2014_x86_64.whl |
|---|---|
| Size | 2.2 MB |
| Tags | CPython 3.10 Linux glibc 2.17+ x86-64 abi3 |
|
SHA-256 checksum How to use checksums |
d8653aa7ce0e4362c9e4da8f31696bc985dc4a0c924585487464797d01d72733
|
|
BLAKE2b-256 checksum How to use checksums |
d947f4f204f4bde435337f14025570ba23e13242b2445748fe12d8e39df3c947
|
| Upload date | |
|
Uploaded using Trusted Publishing? What is trusted publishing? |
Yes |
| Uploaded via |
twine/6.1.0 CPython/3.13.12
|
Provenance
Provenance describes where a file came from. On PyPI, provenance is shared via attestations, which provide a verifiable record of the build or publishing details. View details, limitations and caveats.
PyPI Publish Attestation
PyPI verified that this artifact, at this checksum, originated from the publisher listed below.
Signed by GitHub Actions, verified by PyPI on Jul 15, 2026.
Transparency logRelease files / cleanfig-1.4.0-cp310-abi3-macosx_10_12_x86_64.macosx_11_0_arm64.macosx_10_12_universal2.whl
| Download URL | cleanfig-1.4.0-cp310-abi3-macosx_10_12_x86_64.macosx_11_0_arm64.macosx_10_12_universal2.whl |
|---|---|
| Size | 4.0 MB |
| Tags | CPython 3.10 abi3 macOS 10.12+ universal2 (ARM64, x86-64) macOS 10.12+ x86-64 macOS 11.0+ ARM64 |
|
SHA-256 checksum How to use checksums |
74b6ea8381f92fdc0f21b5538faeaab27b090378cd9ffa5be20f80c3ee61b79e
|
|
BLAKE2b-256 checksum How to use checksums |
d6846a950c3d926c7dd52003ba4ce2c9ddded592e4e15e689065865719c52837
|
| Upload date | |
|
Uploaded using Trusted Publishing? What is trusted publishing? |
Yes |
| Uploaded via |
twine/6.1.0 CPython/3.13.12
|
Provenance
Provenance describes where a file came from. On PyPI, provenance is shared via attestations, which provide a verifiable record of the build or publishing details. View details, limitations and caveats.
PyPI Publish Attestation
PyPI verified that this artifact, at this checksum, originated from the publisher listed below.
Signed by GitHub Actions, verified by PyPI on Jul 15, 2026.
Transparency log













