A commandline app for plotting datafiles

Project description
CLI Plot
A commandline app for parsing and plotting text data files.
Installation
Using Pip
$ pip install cli-plot
Manual
  $ git clone https://github.com/John-Lee-Cooper/cli_plot
  $ cd cli_plot
  $ python setup.py install
Usage
$ cli_plot --version
$ cli_plot --help
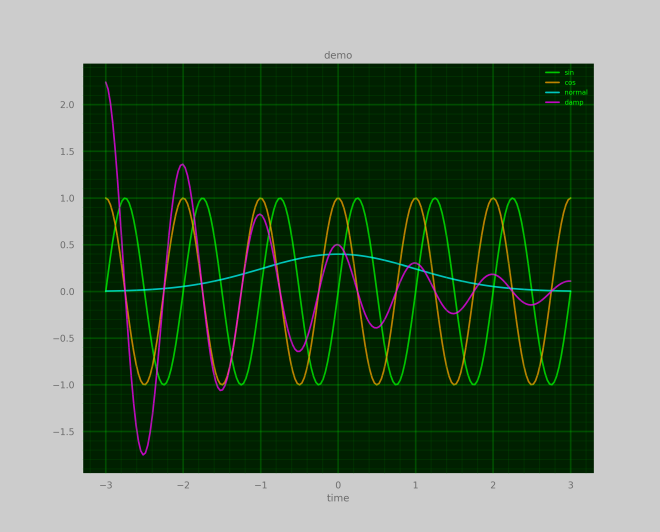
Generate demo
Generate and display some sample data, written to demo.dat
$ cli_plot --demo
User Interface
| Key | Result |
|---|---|
| g | Toggle Grid |
| t | Cycle Plot Type |
| m | Toggle Series Markers |
| 1-9 | Toggle Series 1-9 Display |
| enter | Save Plot to png Image |
| escape | Exit |
Holding the left mouse button down and moving the mouse will pan the plot.
Rolling the mouse wheel up and down will zoom out and in where the mouse is.
Display head of file
$ cli_plot demo.dat --type=head
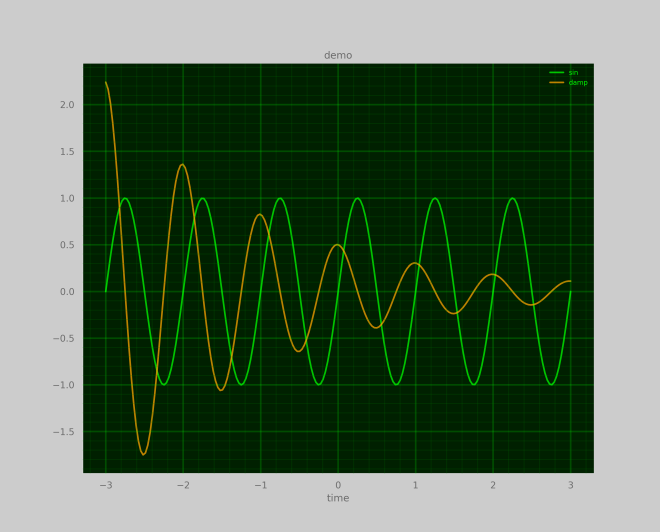
Plot specific columns
Plot sin and growth against time:
$ cli_plot demo.dat time sin damp
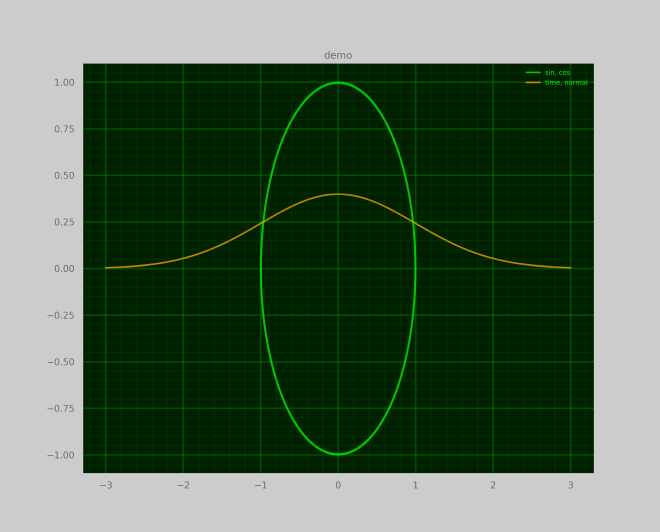
Plot pairs of columns
Plot columns 2 against column 1 and column 4 against column 3:
$ cli_plot demo.dat 2,3 1,4
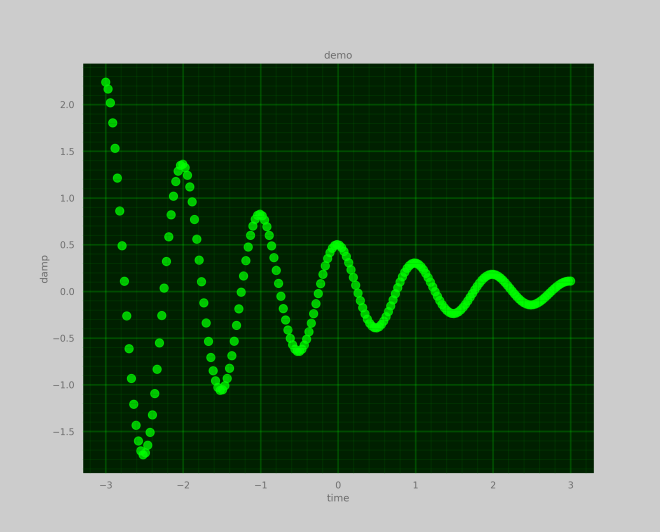
Specify plot type
Plot data as a scatter plot:
$ cli_plot demo.dat --type=scatter
Todo
Written by
John Lee Cooper
john.lee.cooper@gatech.edu


Download files
Download the file for your platform. If you're not sure which to choose, learn more about installing packages.
Source Distribution
Built Distributions
Filter files by name, interpreter, ABI, and platform.
If you're not sure about the file name format, learn more about wheel file names.
Copy a direct link to the current filters
File details
Details for the file cli_plot-1.1.2.tar.gz.
File metadata
- Download URL: cli_plot-1.1.2.tar.gz
- Upload date:
- Size: 24.1 kB
- Tags: Source
- Uploaded using Trusted Publishing? No
- Uploaded via: twine/4.0.1 CPython/3.9.4
File hashes
| Algorithm | Hash digest | |
|---|---|---|
| SHA256 |
c8c001360225e51f085bb968057df1a8761072b81eb74d8ed11f13a60f20fd25
|
|
| MD5 |
1fbb4f0134ff340177185ad7506802d7
|
|
| BLAKE2b-256 |
3ad5263a25a6ac5db5bf16261afc8d74a6513680f00d176358f50a5299a63e8e
|
File details
Details for the file cli_plot-1.1.2-py3.9.egg.
File metadata
- Download URL: cli_plot-1.1.2-py3.9.egg
- Upload date:
- Size: 28.4 kB
- Tags: Egg
- Uploaded using Trusted Publishing? No
- Uploaded via: twine/4.0.1 CPython/3.9.4
File hashes
| Algorithm | Hash digest | |
|---|---|---|
| SHA256 |
1e5c851e9a608f98fc29debba6095ae5306455404a73d35e5a9800a28b818155
|
|
| MD5 |
6bf9bd8d7ce9775ca4ada8f53e9ed52c
|
|
| BLAKE2b-256 |
6bcab432b9039ce34e2d8ef6bcf976bfcb121b404ba5fa0c65b249652d004739
|
File details
Details for the file cli_plot-1.1.2-py3-none-any.whl.
File metadata
- Download URL: cli_plot-1.1.2-py3-none-any.whl
- Upload date:
- Size: 25.6 kB
- Tags: Python 3
- Uploaded using Trusted Publishing? No
- Uploaded via: twine/4.0.1 CPython/3.9.4
File hashes
| Algorithm | Hash digest | |
|---|---|---|
| SHA256 |
ed1a20d6f9ea7aaa9dcbca95f48be0140582bf6941186af9233e1c84c5952d79
|
|
| MD5 |
dc6832987809f51a3531ea1904861ec8
|
|
| BLAKE2b-256 |
962f9bcafab5f49486494288adf1ea2570d01be568c5583d7f69fb136d7f638c
|


