Climate data, grid-ready: standards-based environmental stress features for grid equipment, from free NOAA, NASA, USDA, and USFS data
Verified details
These details have been verified by PyPIProject links
GitHub Statistics
Maintainers

Project description
climagrid
Turn free public weather data into standards-based stress scores for your grid equipment.
climagrid is an open-source toolkit built on NOAA, NASA, USDA, and USFS data, the kind of weather-risk analysis that used to require expensive software.
Built for the more than 900 rural cooperatives serving 42 million Americans across 56 percent of U.S. landmass:
small utilities with no data-science team.


Why this exists
Power outages cost the U.S. economy about $67 billion every year on average, according to Oak Ridge National Laboratory. Most of those outages trace back to weather, vegetation, and environmental stress on aging grid equipment: transformers, power lines, and circuit breakers.
Large utilities can afford expensive software to monitor this risk. The roughly 900 rural electric cooperatives and 2,000 municipal utilities that serve 42 million Americans across 56% of U.S. landmass mostly cannot. They have small engineering teams, no data scientists, and no budget for six-figure software contracts.
climagrid is built for them. It is free, open source (Apache 2.0), and runs on a single laptop. It takes weather and environmental data that the U.S. government already publishes for free, from NOAA, NASA, the USDA, and the U.S. Forest Service, and turns it into the kind of information a maintenance engineer can actually use: which of my transformers are under the most heat stress this month? Which power-line spans are closest to active wildfires? Which areas should I prioritize for inspection?
The U.S. Department of Energy reports that predictive maintenance can cut equipment costs by 25 to 30 percent and return roughly $10 for every $1 invested. climagrid does not deliver those savings on its own; it provides the standards-based environmental stress data that feeds that kind of maintenance planning, for utilities that could not otherwise produce it.
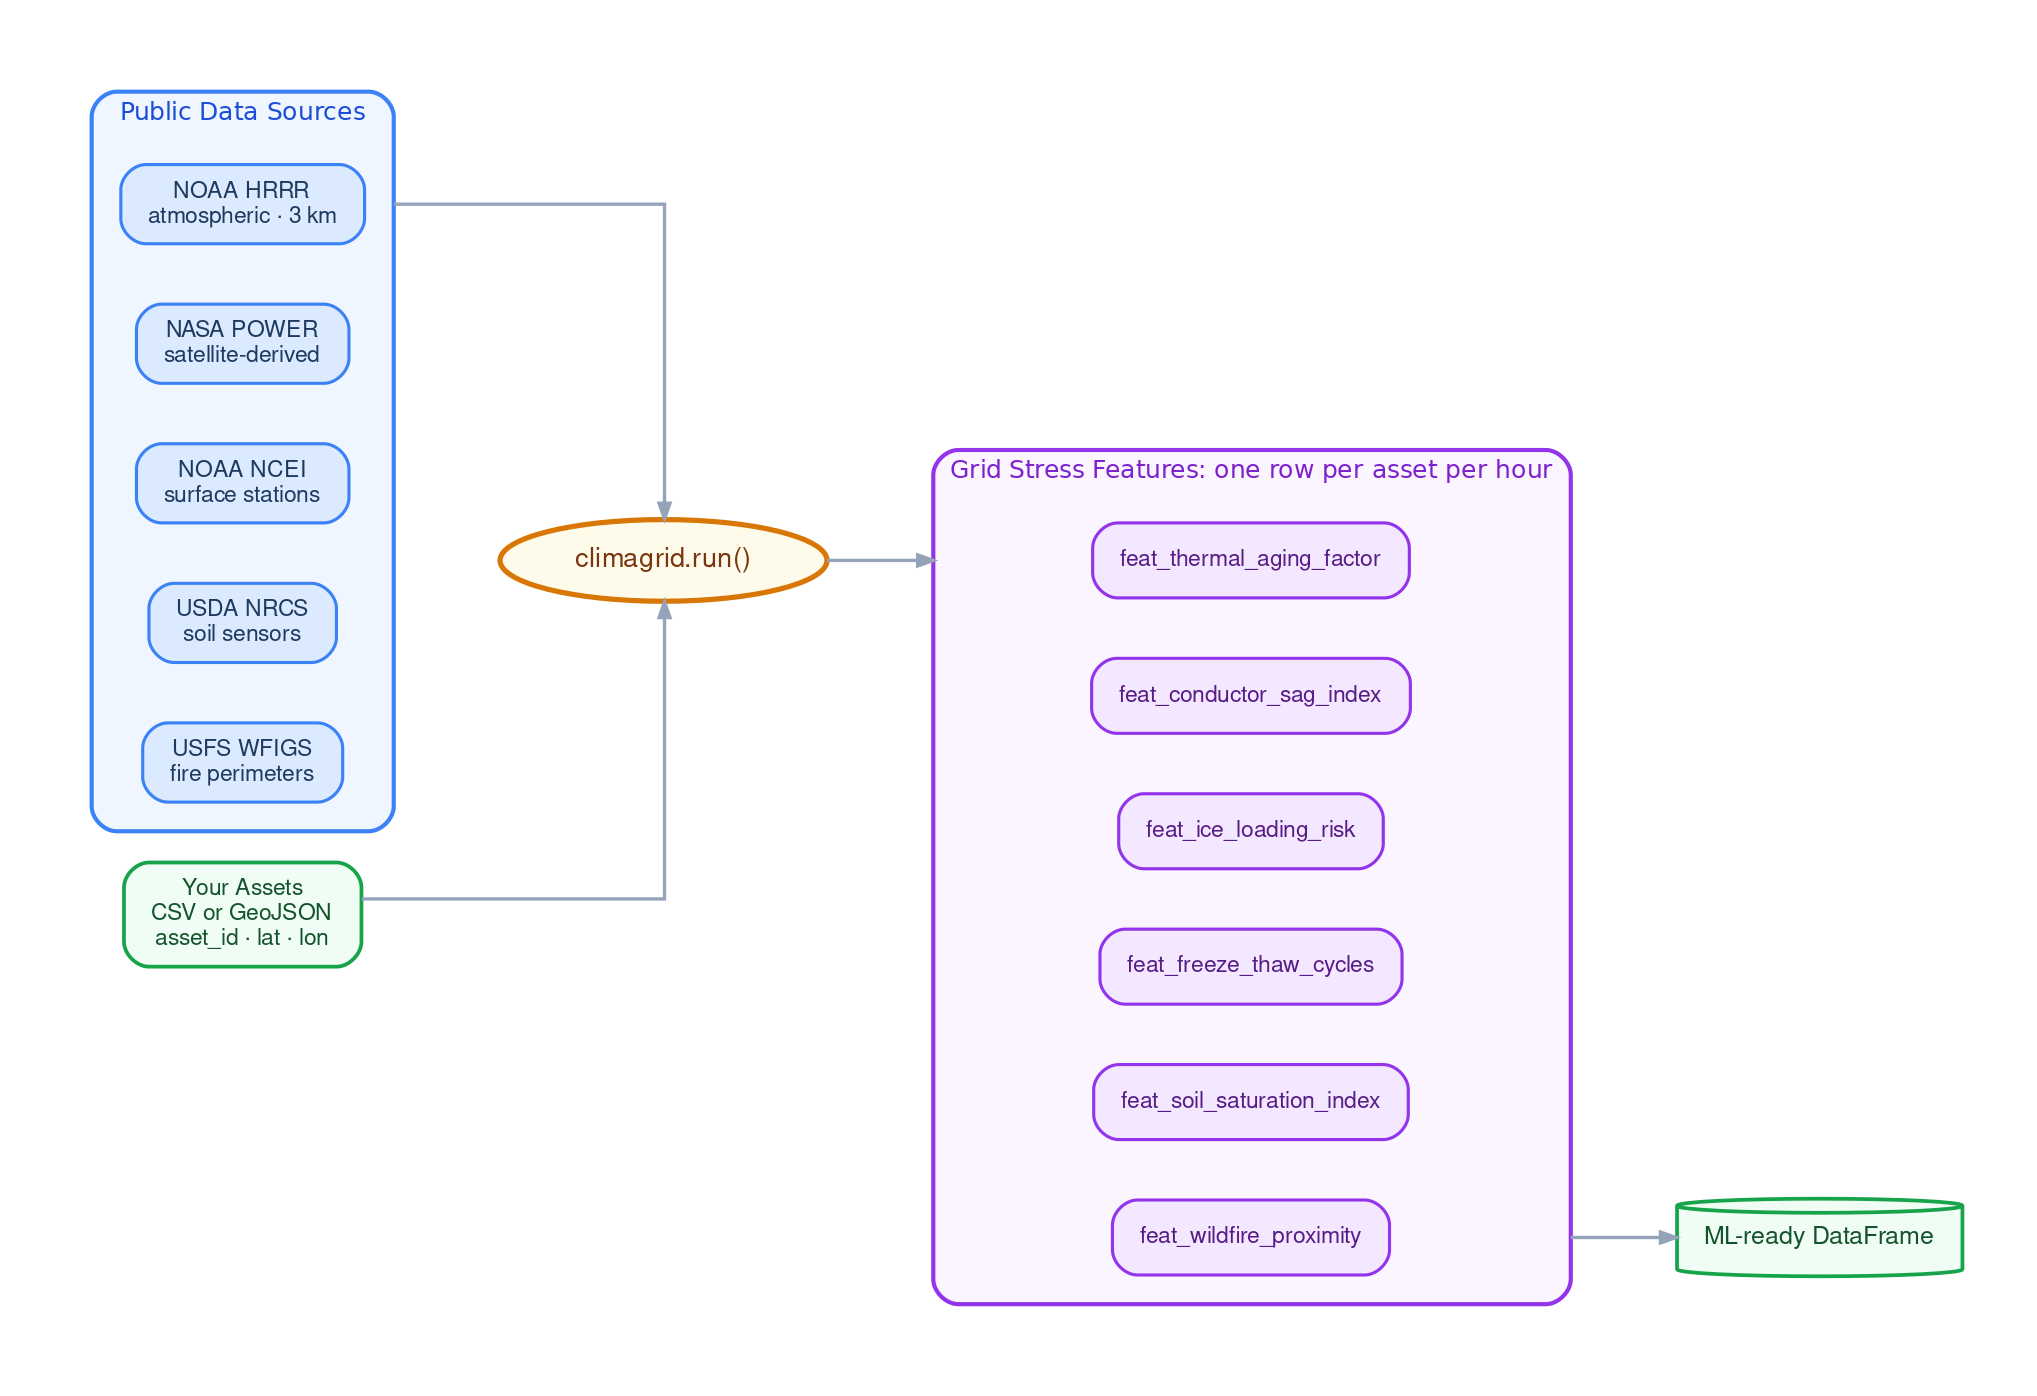
What it does
climagrid pulls from five free federal data sources, joins the data to your asset locations, and computes grid stress features ready to drop into any model or spreadsheet. One call in, one DataFrame out.
Who this is for
- Rural electric cooperatives and municipal utilities that want to start using weather and environmental data in their maintenance planning but don't have a data-science team to build the pipeline.
- Utility engineers who already run predictive-maintenance or anomaly-detection models and want to add environmental stress features to them as additional inputs.
- Researchers and journalists studying grid resilience and rural energy equity.
If you serve fewer than 100,000 meters and your weather "data integration" today is "we check the National Weather Service app before a storm," this toolkit is built for you.
Quick start
pip install climagrid
import climagrid
from datetime import datetime, timezone

df = climagrid.run(
    "my_transformers.csv",          # CSV with asset_id, lat, lon columns
    start_dt=datetime(2024, 7, 1,  tzinfo=timezone.utc),
    end_dt=datetime(2024, 7, 31, tzinfo=timezone.utc),
    sources=["nasa_power"],         # no API key required
    features="all",
)
df.to_parquet("stress_features.parquet")
You now have a file you can join to your maintenance records and feed into whatever model or spreadsheet you already use. See the quickstart notebook for a worked example.
Prefer a ready-to-read deliverable over a DataFrame? One command turns an asset list into a ranked inspection report (PDF) and an inspection-list CSV, no Python required:
pip install "climagrid[report]"
climagrid report --assets my_assets.csv --start 2024-07-01 --end 2024-07-31
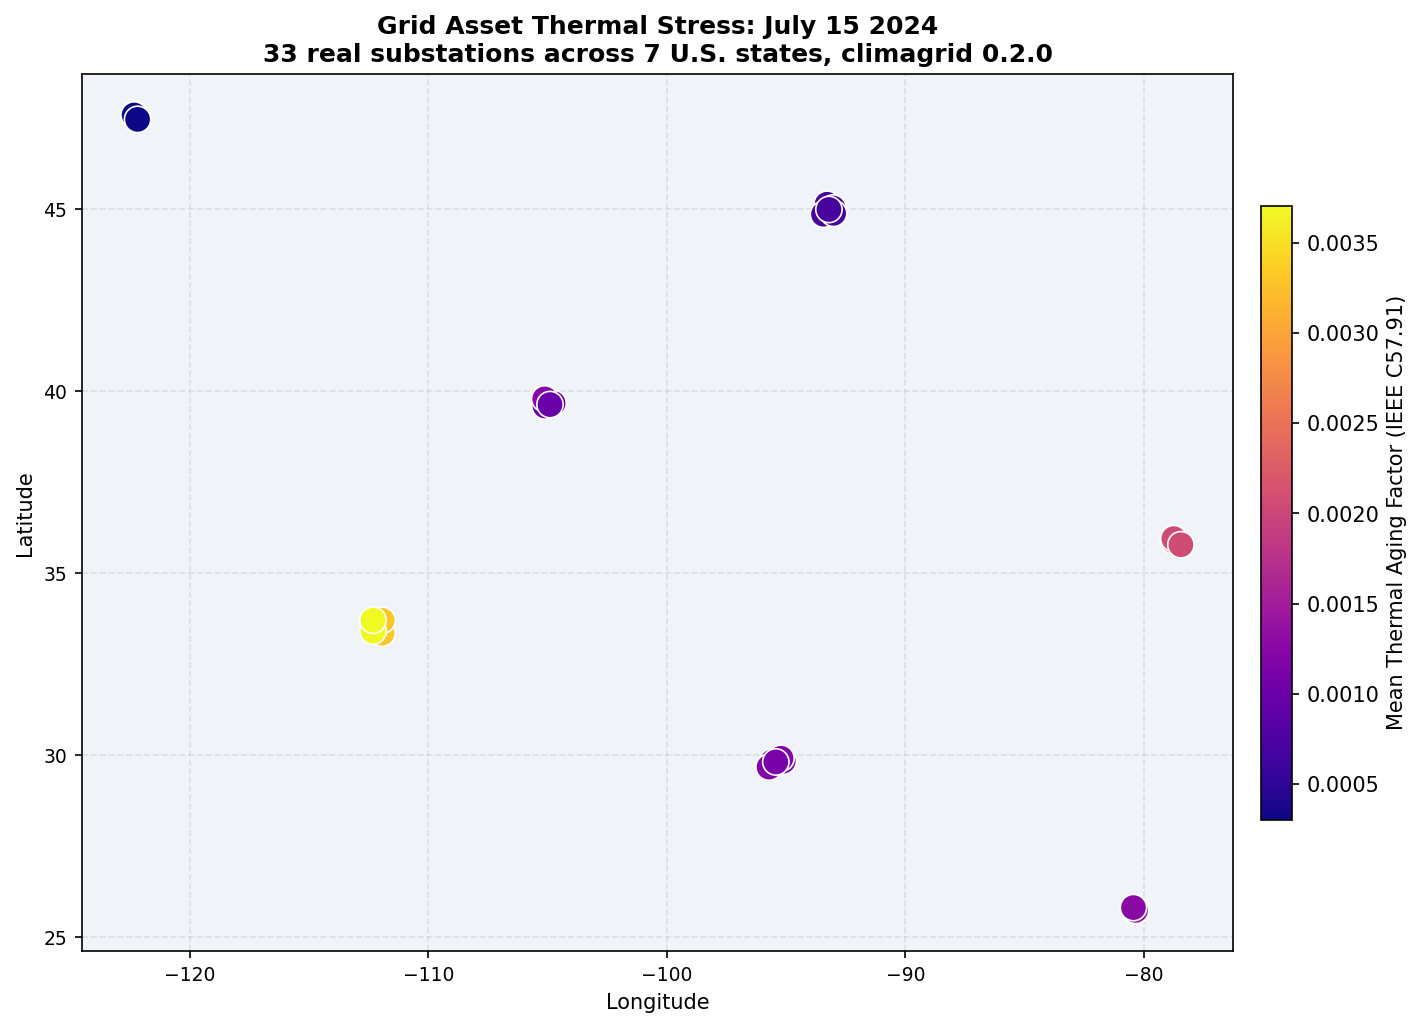
Each asset is ranked by the single weather hazard it is most exposed to, with the driving stress and its standard named. It is a prioritization aid, not a failure prediction (see Validation Notes for what climagrid does and does not establish).
For the lower-level adapter API (fetching individual data sources, custom feature computation) see the documentation.
Data sources
| Agency | Dataset | Variables | Frequency |
|---|---|---|---|
| NOAA | HRRR (3 km CONUS) | Temperature, wind, precipitation, humidity, solar | Hourly |
| NOAA | NCEI CDO (stations) | Temperature, wind, precipitation | Hourly/Daily |
| NASA | POWER API (MERRA-2) | Surface meteorology, irradiance | Hourly/Daily |
| USDA NRCS | SCAN / SNOTEL | Soil moisture, soil temperature, snow water equivalent | Hourly |
| USFS / NIFC | WFIGS | Active wildfire perimeters, fire area | Daily |
All sources are free and publicly accessible. NOAA NCEI requires a free API token (register at ncdc.noaa.gov/cdo-web/token, then set the NOAA_CDO_TOKEN environment variable). All other sources work without credentials.
Environmental stress features
| Feature | Output column | Target assets | Standard |
|---|---|---|---|
| Transformer thermal aging factor | feat_thermal_aging_factor |
Transformers | IEEE C57.91 |
| Heat accumulation hours | feat_heat_hours_above_35c |
Transformers, switchgear | IEEE C57.91 |
| Freeze-thaw cycles | feat_freeze_thaw_cycles |
Conductors, insulators, poles | n/a |
| Ice loading risk | feat_ice_loading_risk |
Overhead T&D lines | ASCE 7-22 (simplified) |
| Soil saturation index | feat_soil_saturation_index |
Underground cables, poles | n/a |
| Wildfire proximity score | feat_wildfire_proximity |
All overhead assets | n/a |
| Conductor sag index | feat_conductor_sag_index |
Overhead T&D lines | IEEE 738 (simplified) |
How this is different from existing tools
| Tool | What it does | How climagrid is different |
|---|---|---|
| atlite (PyPSA) | Turns weather into renewable-generation forecasts | climagrid focuses on environmental stress on equipment, not generation |
| ERAD (NREL) | Estimates damage from one-time disasters (hurricanes, floods) | climagrid produces continuous stress features for day-to-day maintenance |
| OpenSTEF | Forecasts feeder load using weather inputs | climagrid produces environmental stress features, not load forecasts |
| NRECA OMF | Simulates rural-coop feeders to evaluate new technologies | climagrid feeds maintenance models, not feeder simulators |
| EEweather (OpenDSM) | Pulls NOAA temperature for energy-efficiency baselines | climagrid integrates five federal sources and produces grid-stress features |
See the full related-work review.
National impact
- About 42 million Americans are served by rural electric cooperatives, covering 56% of U.S. landmass (NRECA).
- Major U.S. power outages cost roughly $67 billion per year on average (Oak Ridge National Laboratory).
- Predictive maintenance, the broader practice, reduces equipment-maintenance costs by 25 to 30 percent with about a 10-to-1 return on investment (U.S. Department of Energy). climagrid's contribution is to make the underlying environmental stress data free and accessible, lowering the barrier for smaller utilities to adopt that practice.
- climagrid is released under the Apache 2.0 license so that any utility, regardless of size or budget, can use, modify, and redistribute it freely and permanently.
For more on how climagrid ties into U.S. grid resilience priorities, see docs/national_impact.md.
Citation
If you use climagrid in research, regulatory filings, or utility planning, please cite it using the metadata in CITATION.cff, or:
Adesiji, T. (2026). climagrid: Open-source environmental stress feature toolkit
to support electric utility predictive maintenance (v0.2.1). Apache 2.0.
https://doi.org/10.5281/zenodo.20256535
Contributing
climagrid welcomes contributions from utility engineers, data scientists, and researchers. See CONTRIBUTING.md for how to add a new data source adapter or stress feature. Project governance is documented in GOVERNANCE.md.
License
Apache License 2.0. See LICENSE for full text.
Copyright 2026 Temidire Adesiji
Project details
Verified details
These details have been verified by PyPIProject links
GitHub Statistics
Maintainers
Release history Release notifications | RSS feed


Download files
Download the file for your platform. If you're not sure which to choose, learn more about installing packages.
Source Distribution
Built Distribution
Filter files by name, interpreter, ABI, and platform.
If you're not sure about the file name format, learn more about wheel file names.
Copy a direct link to the current filters
File details
Details for the file climagrid-0.2.1.tar.gz.
File metadata
- Download URL: climagrid-0.2.1.tar.gz
- Upload date:
- Size: 1.1 MB
- Tags: Source
- Uploaded using Trusted Publishing? Yes
- Uploaded via: twine/6.1.0 CPython/3.13.12
File hashes
| Algorithm | Hash digest | |
|---|---|---|
| SHA256 |
0767cdb3b6e320b0eed55430ac044ffa33194d70d78ddc61f49f0bc3938a9739
|
|
| MD5 |
0cc4ca2903bbfed2bf0be107b7433bc7
|
|
| BLAKE2b-256 |
11feac6f0592e164461574b96322c3350cc036c6d11a77ffe5fa955ec3c7868a
|
Provenance
The following attestation bundles were made for climagrid-0.2.1.tar.gz:
Publisher:
publish.yml on TemidireAdesiji/climagrid
-
Statement:
-
Statement type:
https://in-toto.io/Statement/v1 -
Predicate type:
https://docs.pypi.org/attestations/publish/v1 -
Subject name:
climagrid-0.2.1.tar.gz -
Subject digest:
0767cdb3b6e320b0eed55430ac044ffa33194d70d78ddc61f49f0bc3938a9739 - Sigstore transparency entry: 1764007412
- Sigstore integration time:
-
Permalink:
TemidireAdesiji/climagrid@cd9cf8133b110d12fe403ee08588d488bc2b92fe -
Branch / Tag:
refs/tags/v0.2.1 - Owner: https://github.com/TemidireAdesiji
-
Access:
public
-
Token Issuer:
https://token.actions.githubusercontent.com -
Runner Environment:
github-hosted -
Publication workflow:
publish.yml@cd9cf8133b110d12fe403ee08588d488bc2b92fe -
Trigger Event:
push
-
Statement type:
File details
Details for the file climagrid-0.2.1-py3-none-any.whl.
File metadata
- Download URL: climagrid-0.2.1-py3-none-any.whl
- Upload date:
- Size: 54.4 kB
- Tags: Python 3
- Uploaded using Trusted Publishing? Yes
- Uploaded via: twine/6.1.0 CPython/3.13.12
File hashes
| Algorithm | Hash digest | |
|---|---|---|
| SHA256 |
61fba75267ed57368da69e63e69cd6cac1ffea1785d3d969d307e6acb2680f6b
|
|
| MD5 |
72b7285183295ef82836c491462ad520
|
|
| BLAKE2b-256 |
0d0a4a698e4b39291897ddc300ce5ce88ef50ae5411e6020ea44b714bce2b1cb
|
Provenance
The following attestation bundles were made for climagrid-0.2.1-py3-none-any.whl:
Publisher:
publish.yml on TemidireAdesiji/climagrid
-
Statement:
-
Statement type:
https://in-toto.io/Statement/v1 -
Predicate type:
https://docs.pypi.org/attestations/publish/v1 -
Subject name:
climagrid-0.2.1-py3-none-any.whl -
Subject digest:
61fba75267ed57368da69e63e69cd6cac1ffea1785d3d969d307e6acb2680f6b - Sigstore transparency entry: 1764008051
- Sigstore integration time:
-
Permalink:
TemidireAdesiji/climagrid@cd9cf8133b110d12fe403ee08588d488bc2b92fe -
Branch / Tag:
refs/tags/v0.2.1 - Owner: https://github.com/TemidireAdesiji
-
Access:
public
-
Token Issuer:
https://token.actions.githubusercontent.com -
Runner Environment:
github-hosted -
Publication workflow:
publish.yml@cd9cf8133b110d12fe403ee08588d488bc2b92fe -
Trigger Event:
push
-
Statement type:


