
Climate Analysis Package
Overview
The Climate Analysis Package is a powerful tool designed for analyzing climate data with a focus on generating time-series visualizations and map-based insights. This package supports processing CMIP6 data, calculating regional means, and visualizing climate anomalies, making it ideal for climate scientists, researchers, and data analysts.
Example pngs:
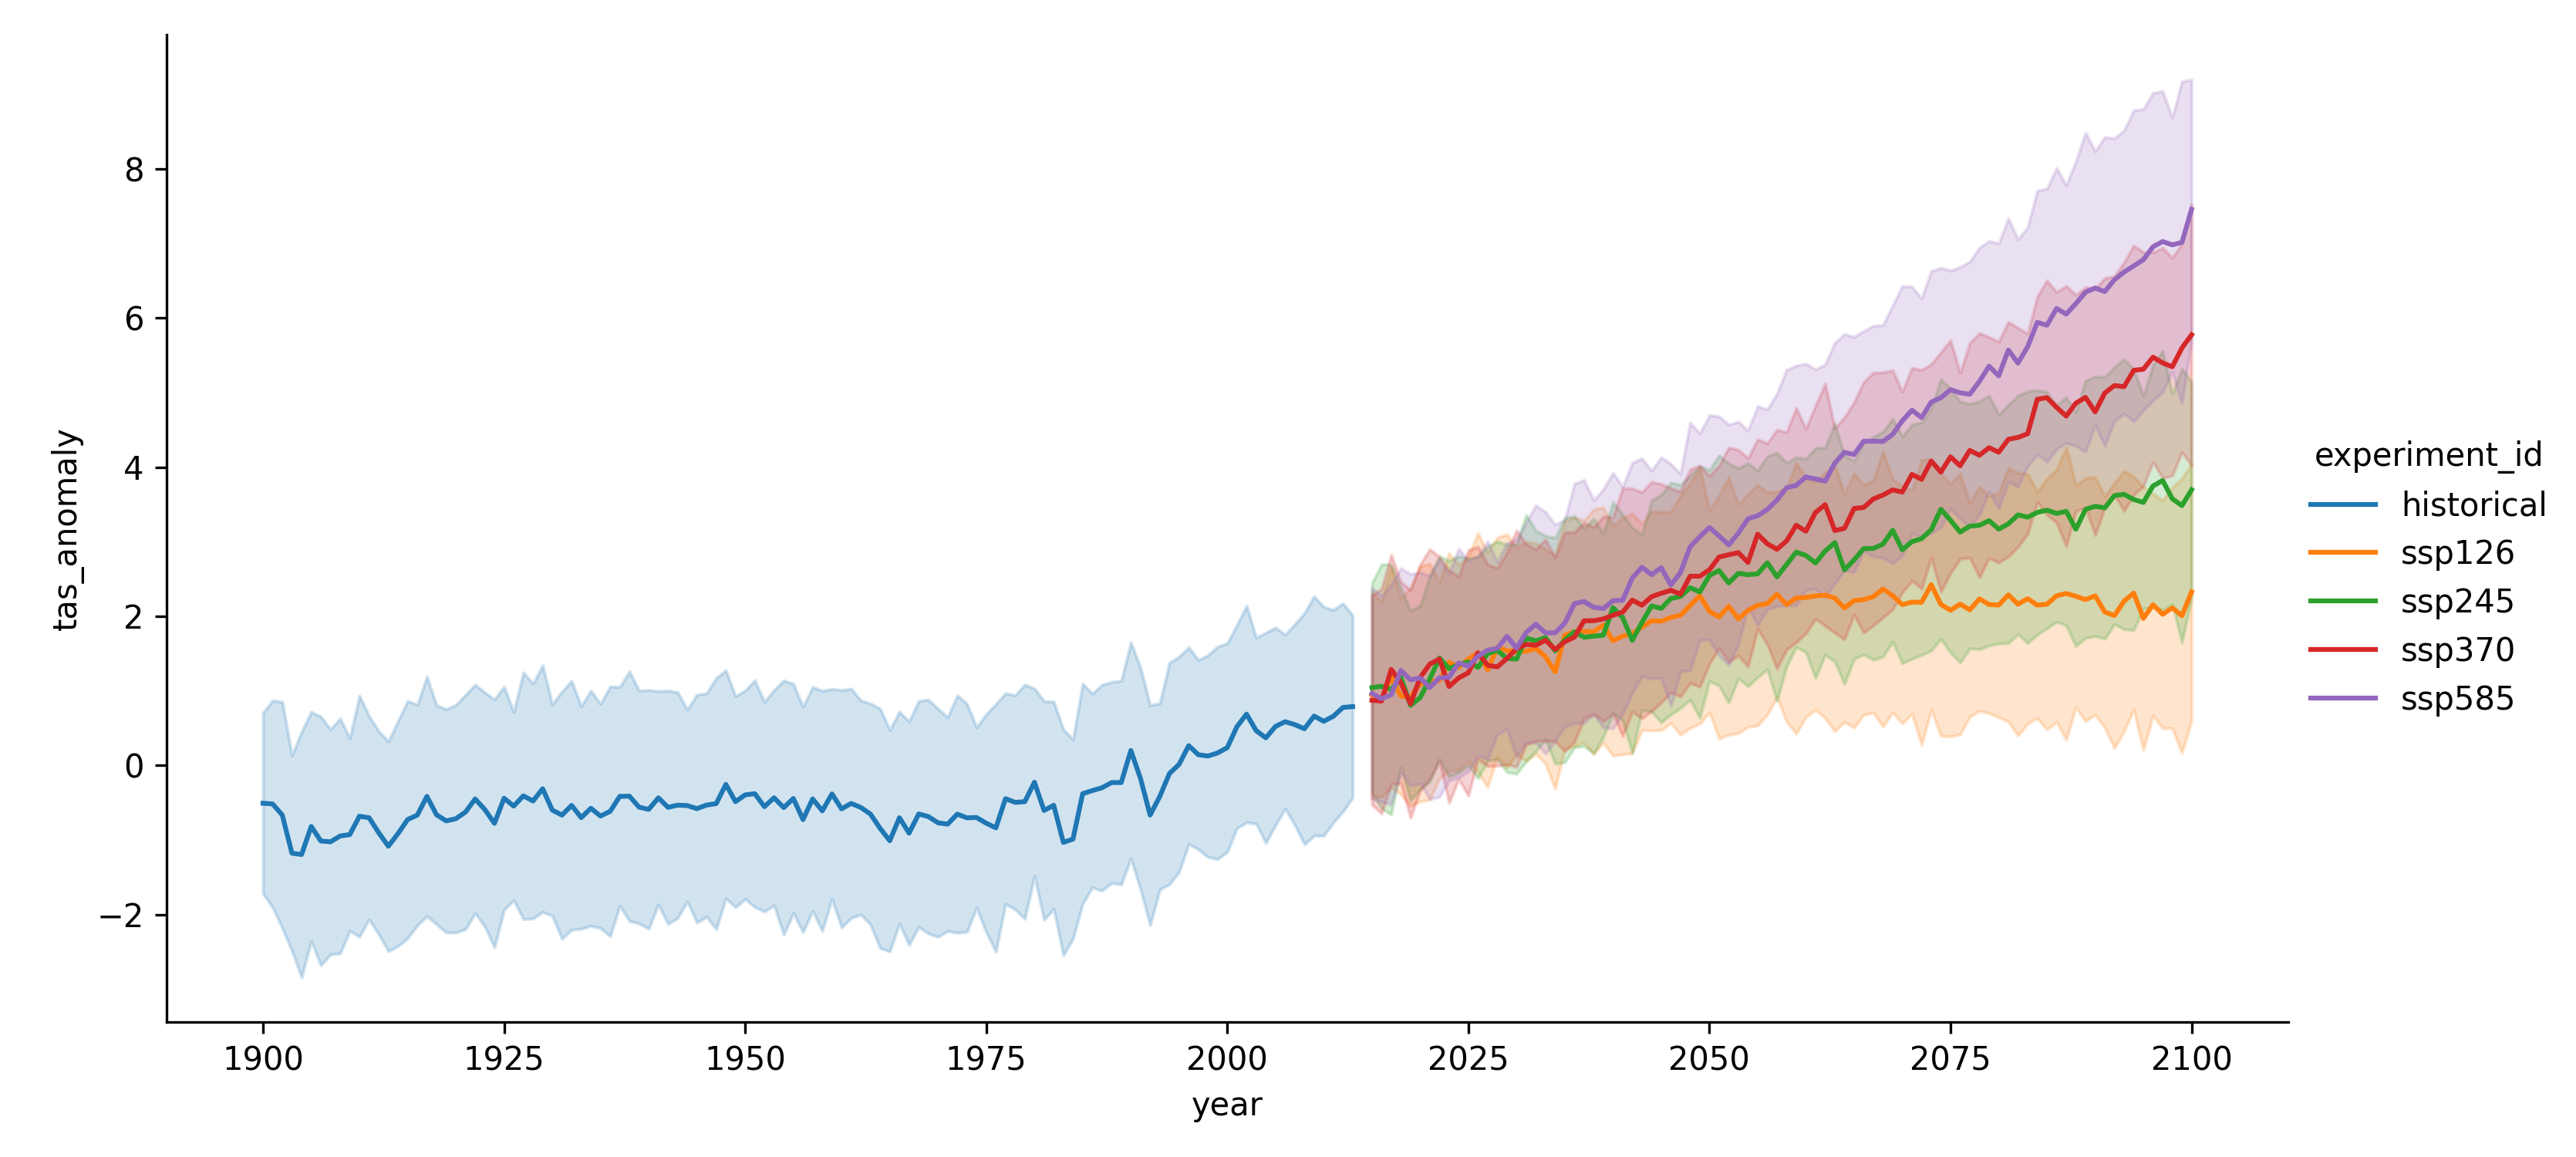
- Near surface temperature changes w.r.t. 1981-2010 reference
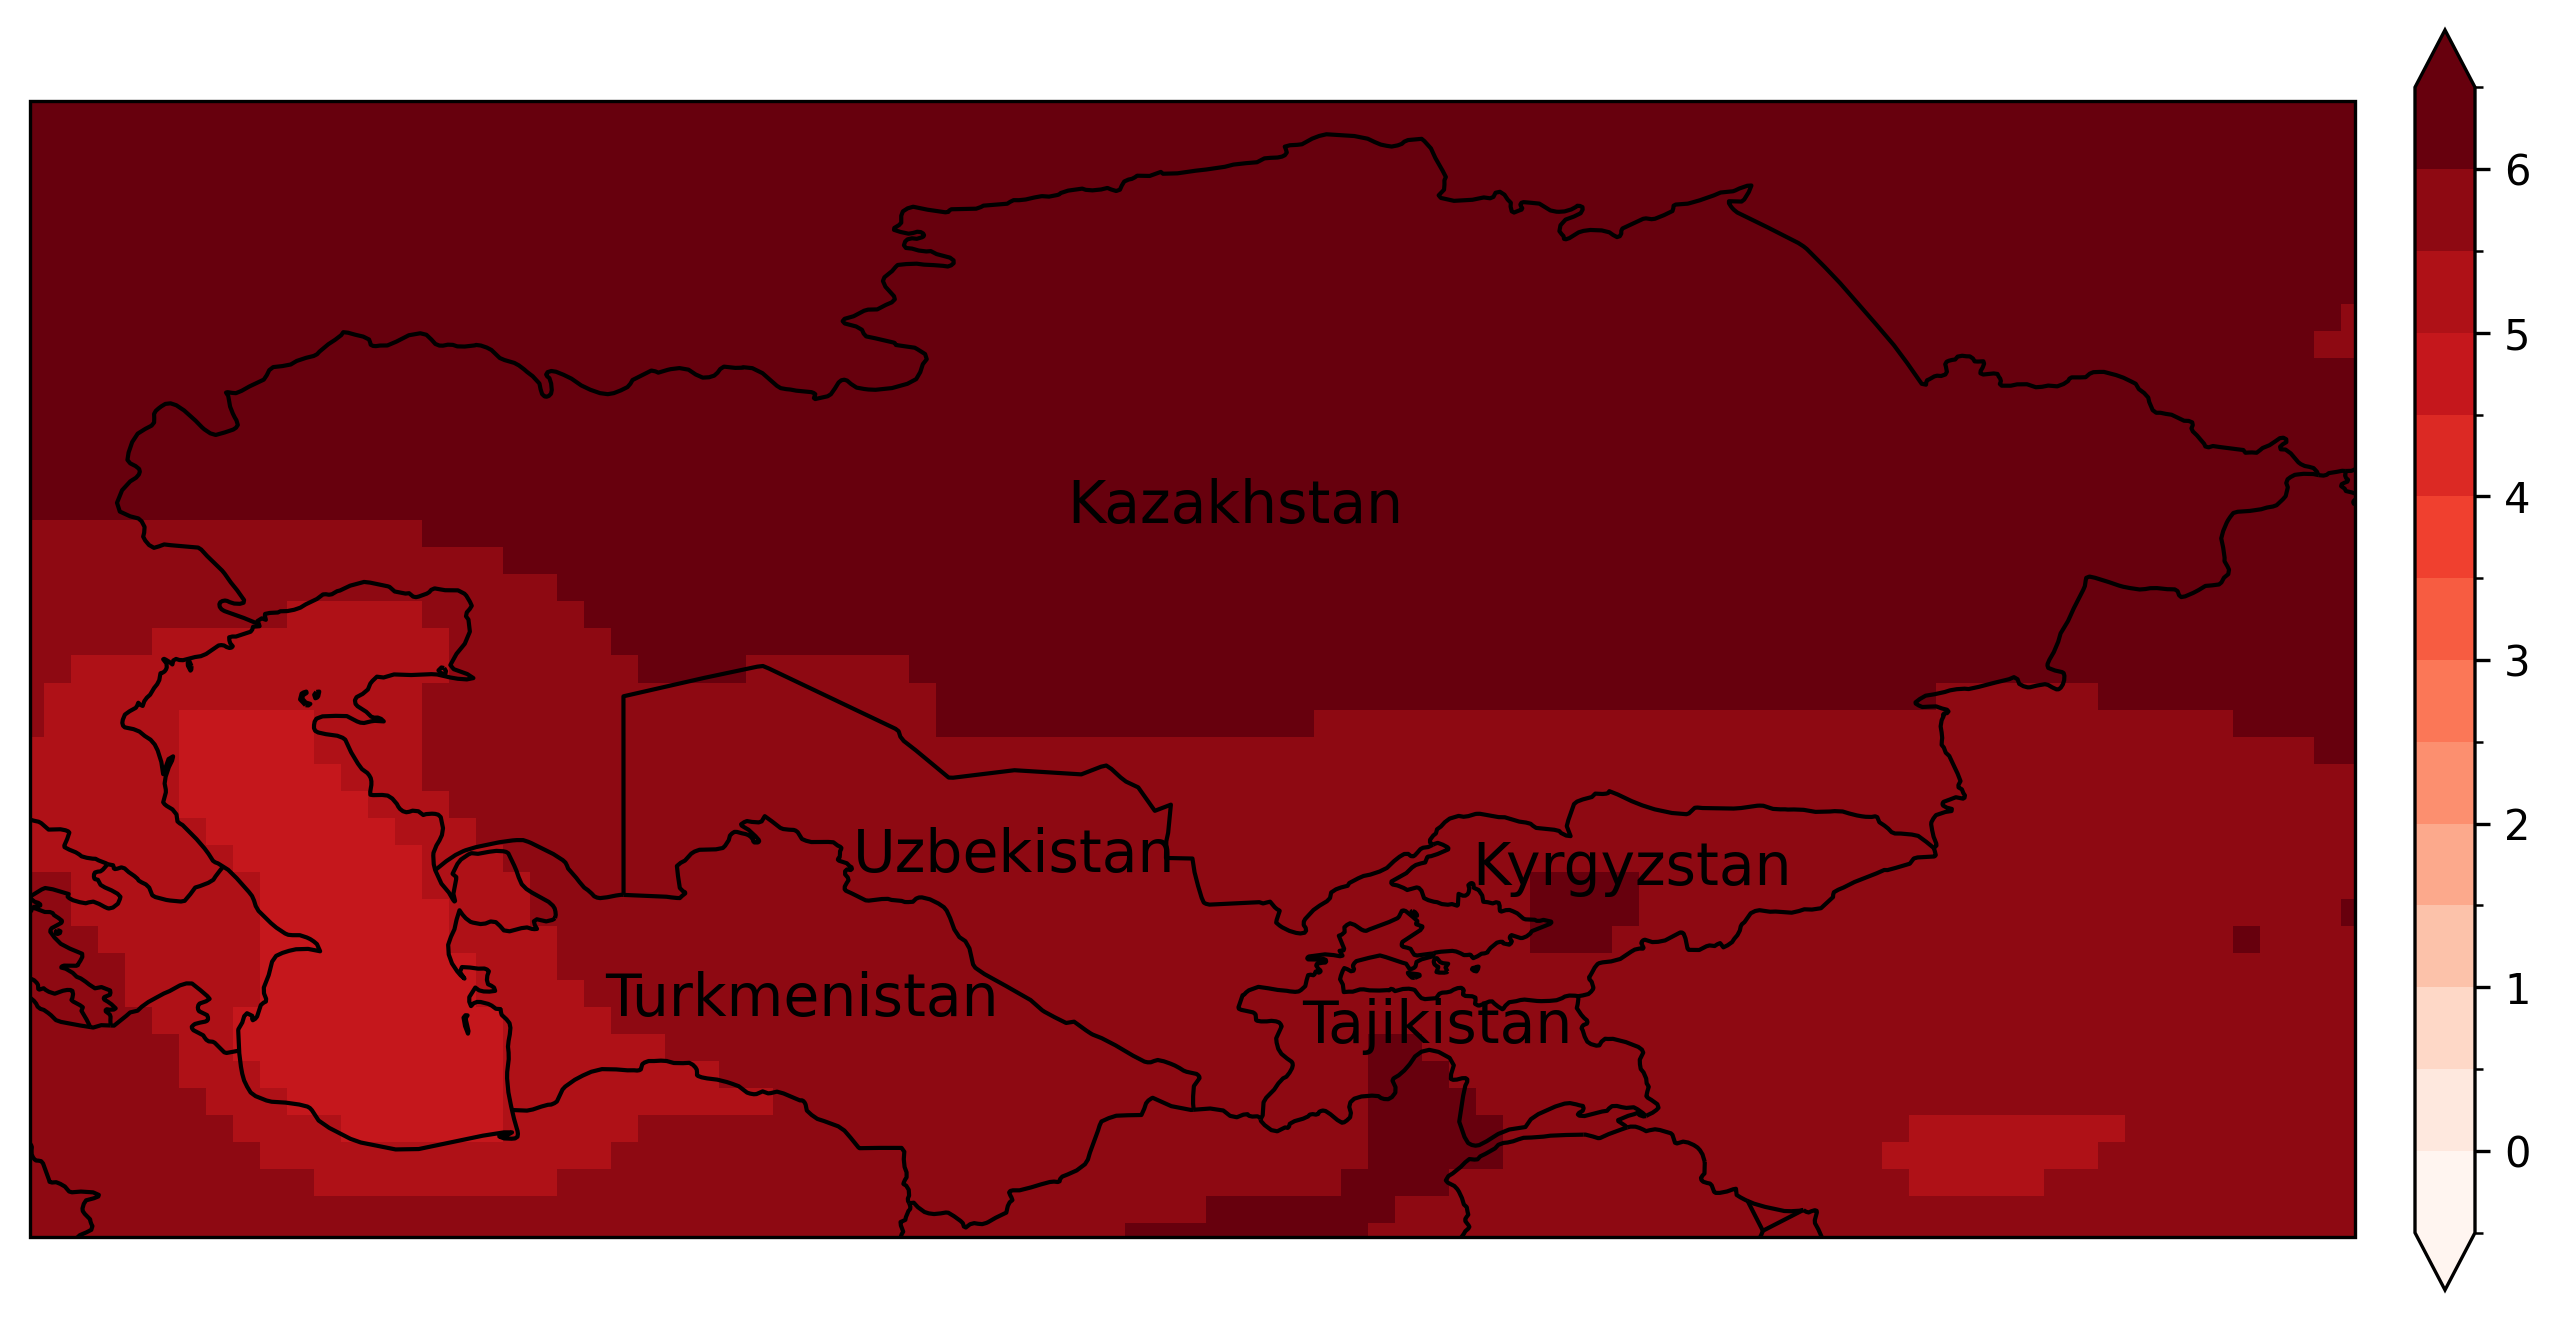
- SSP585 w.r.t. 1981-2010 at the end of the century 2071-2099
Features
- Time-Series Analysis: Generate detailed time-series plots of temperature or other variables over time for specified experiments.
- Map Visualizations: Create spatial maps of climate variables, regridded to a specified resolution.
- Customizable: Set your own region of interest, experiments, and climatological baselines.
- Automated Processing: Handles CMIP6 datasets, including preprocessing and anomaly computation.
Installation
- via
pypi:
pip install climate-analysis
- via
github:
-
Clone the repository:
git clone https://github.com/bijanf/climate_analysis.git
-
Navigate to the package directory:
cd climate_analysis_package
-
Install the required dependencies:
pip install -r requirements.txt
-
Install the package:
python setup.py install
Usage
The package provides two main functionalities: time-series plots and map-based visualizations.
Time-Series Plots
Generate time-series plots to visualize climate variable anomalies over time.
Example
generate-time-series \
    --catalog_url https://storage.googleapis.com/cmip6/pangeo-cmip6.json \
    --experiments historical ssp126 ssp245 ssp370 ssp585 \
    --lat_range 30 60 \
    --lon_range 30 90 \
    --climatology_start 1981 \
    --climatology_end 2010 \
    --output time_series_plot.png \
    --variable tas
Output
- Plot: Saved as
time_series_output.png. - Model List: A text file
time_series_output_models.txtcontaining all models used for the plot. - df_all_processed.csv: A csv file of dataframe of time-series.
Map Visualizations
Generate map visualizations of regridded climate variable differences between scenarios.
Example
generate-maps \
    --catalog_url https://storage.googleapis.com/cmip6/pangeo-cmip6.json \
    --experiments ssp585 \
    --lat_range 35 57 \
    --lon_range 45 87 \
    --output climate_map.png
Output
- Map: Saved as
map_output.png.
Contributing
We welcome contributions to the Climate Analysis Package! To contribute:
-
Fork the Repository:
- Visit the GitHub repository and fork it to your account.
-
Clone Your Fork:
git clone https://github.com/bijanf/climate_analysis.git
-
Create a New Branch:
git checkout -b feature/your-feature-name
-
Make Changes:
- Edit the code, add new features, or fix bugs.
- Follow the existing code style and conventions.
-
Test Your Changes:
- Ensure all tests pass by running NOT implemented yet :
pytest
- Add new tests if needed.
- Ensure all tests pass by running NOT implemented yet :
-
Commit Your Changes:
git add .
git commit -m "Add your descriptive commit message"
-
Push Your Changes:
git push origin feature/your-feature-name
-
Create a Pull Request:
- Go to the original repository and create a pull request from your branch.
Guidelines
- Code Style: Follow PEP 8 standards for Python code.
- Documentation: Update the README.md or docstrings as needed.
- Tests: Ensure new features or changes are covered by tests.
Key Parameters
catalog_url: URL to the CMIP6 data catalog (e.g.,https://storage.googleapis.com/cmip6/pangeo-cmip6.json).experiments: List of experiments to include (e.g.,historical,ssp585).lat_rangeandlon_range: Latitude and longitude bounds for the region of interest.variable: Climate variable to analyze (e.g.,tas,pr).climatology_startandclimatology_end: Years for the climatology baseline.target_resolution: Spatial resolution for regridding (in degrees).
Keywords
- Climate Analysis
- CMIP6
- Regional Climate
- Climate Modeling
- Climate Visualization
- Time-Series Analysis
- Map Visualization
License
This package is licensed under the MIT License. See the LICENSE file for details.
Author
Bijan Fallah
Climate Scientist, Berlin
Linkedin
1 maintainer

Release files for climate-analysis 0.1.11
For a detailed explanation of source distributions (sdists) and built distributions (wheels), please see the package formats documentation.
Source distribution (sdist)
| File | Size | Uploaded | |
|---|---|---|---|
| climate_analysis-0.1.11.tar.gz | 12.5 kB | Details |
Built distribution (wheel)
| File | Interpreter | ABI | Platform | Reset |
|---|---|---|---|---|
| climate_analysis-0.1.11-py3-none-any.whl | Python 3 | none | any | Details |
Total release size: 24.6 kB
Release files / climate_analysis-0.1.11.tar.gz
| Download URL | climate_analysis-0.1.11.tar.gz |
|---|---|
| Size | 12.5 kB |
| Tags | Source |
|
SHA-256 checksum How to use checksums |
bd3d47a1519dcbfde1f6c6bc28b9ad6d444d905cfba280700eb21794f2aab3cc
|
|
BLAKE2b-256 checksum How to use checksums |
90580ab115efc7b52d8ed78ea67a0a7b3dd7f700ff3934b1adbfaf716c469160
|
| Upload date | |
|
Uploaded using Trusted Publishing? What is trusted publishing? |
No |
| Uploaded via |
twine/6.0.1 CPython/3.11.6
|
Release files / climate_analysis-0.1.11-py3-none-any.whl
| Download URL | climate_analysis-0.1.11-py3-none-any.whl |
|---|---|
| Size | 12.0 kB |
| Tags | Python 3 |
|
SHA-256 checksum How to use checksums |
6adac3a0352e36481aeb979a3dae0845183e4abbf60499879f81a151c45a2548
|
|
BLAKE2b-256 checksum How to use checksums |
cfe5a9e23dc508bc45cc24d3670895e9a2ebced39eeab113a5d998fc65072847
|
| Upload date | |
|
Uploaded using Trusted Publishing? What is trusted publishing? |
No |
| Uploaded via |
twine/6.0.1 CPython/3.11.6
|














