
climate-resilience

Download Examples
This file requires a download_params.yml file to specify the download configurations.
We cannot directly download the data from the Google Earth Engine directly onto the local machine. So the best option is to download to the drive and then download that data to the local drive.
Preprocess Examples
The preprocessing functions will expect that the local data drive contains the downloaded data.
If the data is on drive, the drive needs to be mounted. This is easier to do in a google colab session. Once the drive is mounted, the path of the mounted drive can be used with the functions as normal.
Expected file and directory structure:
The input file and directory structure for functions calculate_Nth_percentile(), calculate_pr_count_amount(), and calculate_temporal_mean() in the preprocessing code should be as follows:
datadir
├── scenario1_variable1_ensemble
│   ├── name1_state1_scenario1_variable1.csv
│   └── name2_state2_scenario1_variable1.csv
├── scenario1_variable2_ensemble
│   ├── name1_state1_scenario1_variable2.csv
│   └── name2_state2_scenario1_variable2.csv
├── scenario2_variable1_ensemble
│   ├── name1_state1_scenario2_variable1.csv
│   └── name2_state2_scenario2_variable1.csv
└── scenario2_variable2_ensemble
    ├── name1_state1_scenario2_variable2.csv
    └── name2_state2_scenario2_variable2.csv
Visualization Examples
The visualization code will be easier to be used in a notebook as inline visualizations can be used.
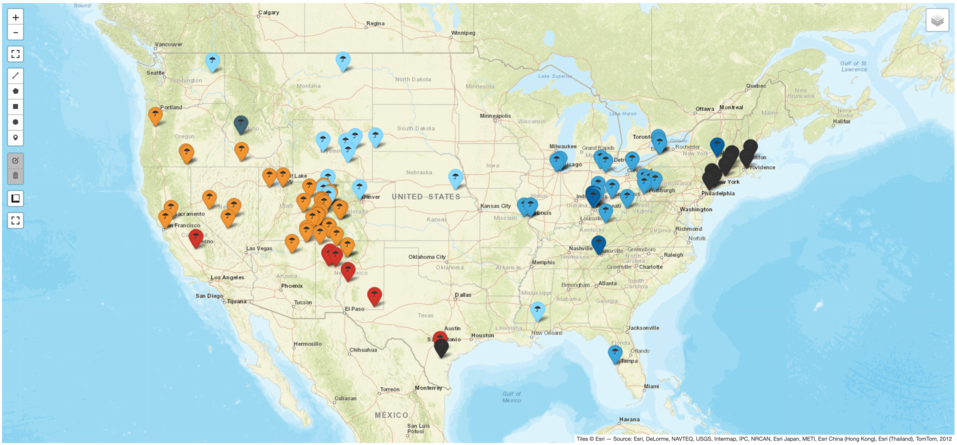
Map visualization notebook
Below is a screenshot of the interactive map with the sites marked.

Box plot visualization notebook
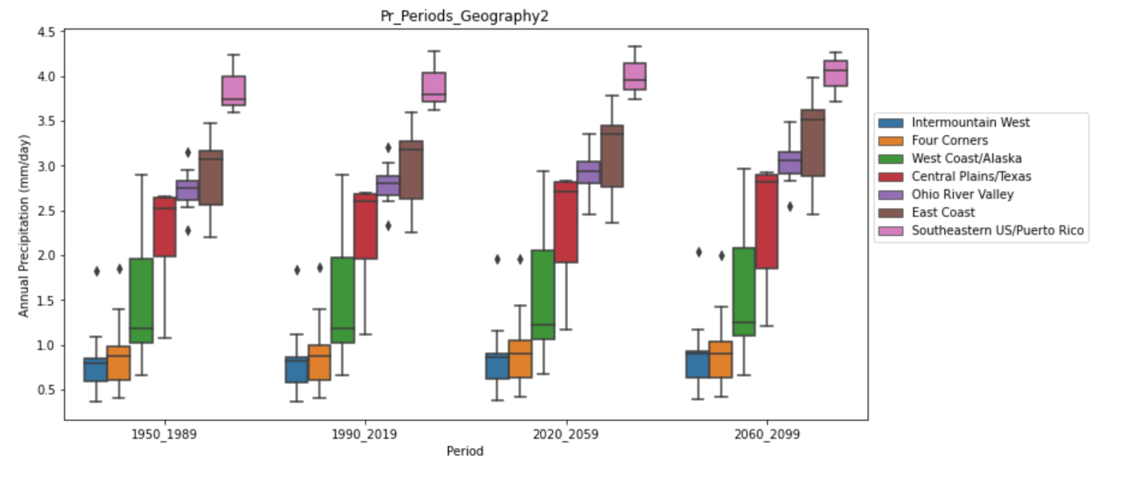
Below is a screenshot of boxplot of annual precipitation in different regions of the United States.
Library Features:
Downloader
- Class SiteDownloader member functions:
- download_model_average_daily()
- download_historical_daily()
- download_historical_monthly()
- download_samples()
Preprocessing functions
- calculate_Nth_percentile()
- calculate_pr_count_amount()
- calculate_temporal_mean()
- get_climate_ensemble()
- get_per_year_stats()
- get_sub_period_stats()
Vizualization functions
Contributors
1 maintainer

Download files
Download the file for your platform. If you're not sure which to choose, learn more about installing packages.
Source Distribution
Built Distribution
Filter files by name, interpreter, ABI, and platform.
If you're not sure about the file name format, learn more about wheel file names.
Copy a direct link to the current filters
File details
Details for the file climate-resilience-0.4.10.tar.gz.
File metadata
- Download URL: climate-resilience-0.4.10.tar.gz
- Upload date:
- Size: 26.8 kB
- Tags: Source
- Uploaded using Trusted Publishing? No
- Uploaded via:
twine/4.0.1 CPython/3.9.7
File hashes
| Algorithm | Hash digest | |
|---|---|---|
| SHA256 |
eae990acb2862ac331c587d130805136782bb343dc610d29797e3764823ace4e
|
|
| MD5 |
48061592d27be20abad28580c63eeecd
|
|
| BLAKE2b-256 |
f34f639c645a90d3153c1434dc5a9a01e2d2ec0ea7de5e7332a2fb2b8a47a023
|
File details
Details for the file climate_resilience-0.4.10-py3-none-any.whl.
File metadata
- Download URL: climate_resilience-0.4.10-py3-none-any.whl
- Upload date:
- Size: 27.7 kB
- Tags: Python 3
- Uploaded using Trusted Publishing? No
- Uploaded via:
twine/4.0.1 CPython/3.9.7
File hashes
| Algorithm | Hash digest | |
|---|---|---|
| SHA256 |
d383edf943d6359bf39098382f02a0f40dc12179cf6fd4306d2450a932f66620
|
|
| MD5 |
2d9acba46f151c1e3bbdb3469837ad32
|
|
| BLAKE2b-256 |
a3ae75d388cd9b9acaf1aa661ae2840b609348d766434f52a62bdc56fcf8cc09
|














