clv prediction applying with deep learning
Project description
Customer Lifetime Value Prediction
How it works?
-
Main Concept
The main concept of customer value prediction is related to calculate Return Rate, Churn Rate (per customer or general Ratio), then formulize the ratio with the value of each customer per purchase. Depending on the churn rate, the total value of business somehow can be predicted and it will not be efficient much by using this technique. This technique, rather than predicting each customer of value, give a general idea of the business what will be the total revenue with the customer. How about is it changing the methodology, rather than using the general churn rate which is applied for each customer, predicting customers of the selected future time period of possible order dates by using their historical transactions? If we can predict the exact date of each customer by the historic time difference of each customer, we are able to predict the future value of each order per customer.
-
Prediction of Next Purchase (Frequency) per Customer Model
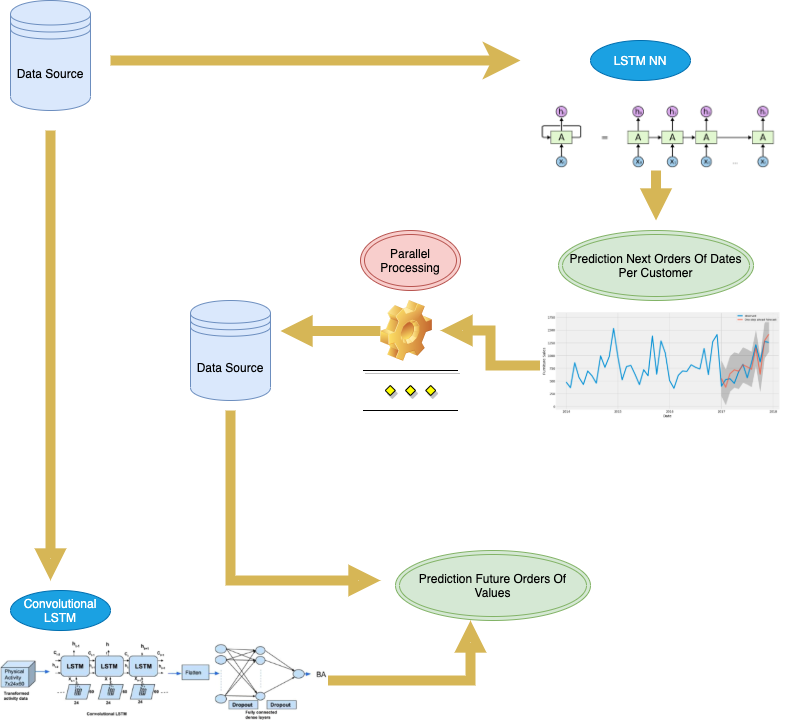
Each customer of historical purchases of date differences is calculated. There will be accepted patterns related to customers ' behaviors. Some Users might have a pattern of every Monday. Some will have Mondays -Wednesdays- Fridays. there must be an individual predictive model for each customer, and this must be the Time Series model per each customer of historical frequency. However, it is not an efficient way and there will be a computational cost here. In that case, Deep Learning can handle this problem with LSTM NN (check next_purchase_model.py). There must be a model that each customer of frequency values are able to be predicted.
-
Prediction Of Customer Value (Value) per Customer Model
Customer future values of prediction are also crucial to reach the final CLV calculation. Once frequency values are calculated per customer, by historical users' of purchase values can be predicted via using Deep Learning. At this process, there is a built-in network (check purchase_amount.py) which is created by using 1 Dimensional Convolutional LSTM NN.
-
Combining Of Next Purchase Model & Purchase Amount Prediction Model
Without predicting the frequency of users, we can not be sure when the customer will have a purchase. So, by using the next purchase model, customers of future purchase dates have to be predicted. Before predicting a date, the algorithm makes sure the predicted future order of dates is in selected time period.
last purchased date from raw data < predicted purchase date < last purchased date from raw data + time period
This time period must be assigned when the process is initialized. The time period will have a range between the last transaction date of the dataset and the last transaction date + time period. It can be detected the users' purchases of dates and the next process will be predicting each purchase of values by using the Purchase Amount model.
-
CLV Prediction Process Pipeline
Key Features
- Allows you to predict your business of customers values individually.
- Predicts customers of next purchase dates.
- Predicts customers of next purchase amounts.
- Dashboard for visualization predicted values.
- Schedule training pr prediction processes periodically.
Running Platform
-
CLV Prediction Parameters
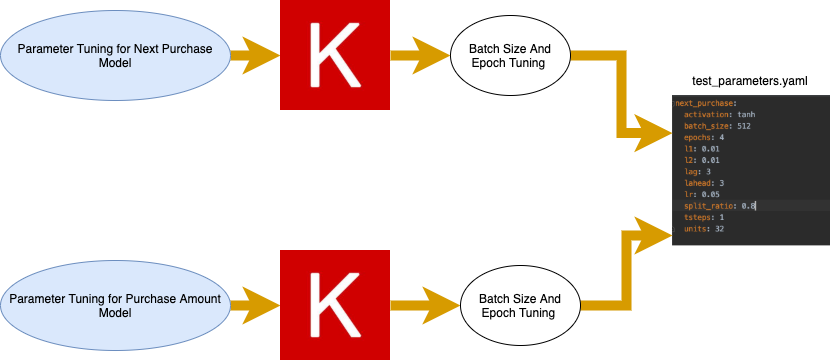
job : Train, Prediction. train process is related to creating a model; the next steps are going to be the Next Purchase Model and Purchase Amount Model. Each model of the hyper parameter tuning process will be initialized before the model has been initialized. Once, the hyperparameter has been progressed tunned network parameters are stored in test_paramters.yaml where it is in export_path. When a model has been run repeatedly (or periodically), the model has been check whether it has been already built during the ***time_period. If there are stored models in export_path, the latest model is imported and move on to the next process without a run for building the model. When the *prediction process is triggered, first, the next purchase per customer is predicted then, the purchase amount is predicted related to the next purchase prediction.
order_count : It allows us to create a feature set of the purchase amount model. (Check Why do we need order count as a feature at Purchase Amount Model? for details). if it is not assigned (it is not a required argument in order to initialize the clv prediction), the platform handles it to decide the optimum order count.
customer_indicator : This parameter indicates which column represents a unique customer identifier on given data.
amount_indicator : This parameter indicates which column represents purchase value (integer, float ..) on the given data.
time_indicator : This parameter indicates which column represents order checkout date with date format (timestamp) (YYYY/MM/DD hh:mm:ss, YYYY-MM-DD hh:mm:ss, YYYY-MM-DD) on given data.
date : This allows us to query the data with a date filter. This removes data that occurs after the given date. If the date is not assigned there will be no date filtering. date arguments are filtering related to time_indicator column, make sure it is querying with the accurate format. If clv prediction is running with schedule service, periodically given date is updated and filter with an updated given date. If the date is not assigned when clv prediction is scheduling, the date will be the current date.
data_source : The location where the data is stored or the query (check data source for details).
data_query_path : Type of data source to import data to the platform (optional Ms SQL, PostgreSQL, AWS RedShift, Google BigQuery, csv, json, pickle).
connector : if there is a connection parameters as user, pasword, host port, this allows us to assign it as dictionary format (e.g {"user": ***, "pw": ****}).
export_path : Export path where the outputs are stored. created models (.json format), tunned parameters (test_parameters.yaml), schedule service arguments (schedule_service.yaml), result data with predicted values per user per predicted order (.csv format) are willing to store at given path.
time_period : A period of time which is willing to predict. Supported time periods month, hour, week, 2*week (Required).
time_schedule : A period of time which handles for running clv_prediction train or prediction process periodically. Supported schedule periods day, year, month, week, 2*week.
Data Source
Here is the data source that you can connect with your SQL queries:
-
Ms SQL Server
-
PostgreSQL
-
AWS RedShift
-
Google BigQuery
-
.csv
-
.json
-
pickle
-
Connection PostgreSQL - MS SQL - AWS RedShift
data_source = "postgresql" connector = {"user": ***, "password": ***, "server": "127.0.0.1", "port": ****, "db": ***} data_main_path =""" SELECT customer_indicator, amount_indicator, time_indicator, FROM table """ -
Connection Google BigQuery
data_source = "googlebigquery" connector = {"data_main_path": "./json_file_where_you_stored", "db": "flash-clover-*********.json"} data_main_path =""" SELECT customer_indicator, amount_indicator, time_indicator, FROM tablee """ -
Connection csv - .json - .pickle
data_source = "csv"
data_main_path = "./data_where_you_store/***.csv"
Data Preparation
Each model has unique aggregation in order to prepare data to create model.
1. Next Purchase Model Data Preparation
-
Time difference of each order per customer is calculated. time diference is calcualted realted time_preiod.
a. time_period = hour, time_difference = minute
b. time_period = day, time_difference = hour
c. time_period = week, month, 2*week, time_difference = day
-
Normalized each time difference values related to Min-Max Normalization Method. Each customer of Min-Max Normalization individually.
-
Regarding of lahead paramter of LSTM model, data set is shaped per customer.
-
Iterativelly each customer of data set is collected individually. the process is parallelized according to CPU count.
-
When model data has been prepared per customer, it is splitted according to split ratio into the train and test data set (train_x, train_y, test_x, test_y).
| customers | lag 3 | lag 2 | lag 1 | y |
|---|---|---|---|---|
| user_1 | 0,4 | 0,8 | 1,7 | 1,2 |
| user_1 | 0,8 | 1,7 | 1,2 | 1,4 |
| user_1 | 1,7 | 1,2 | 1,4 | 1,6 |
| user_1 | 1,2 | 1,4 | 1,6 | 2,8 |
| user_1 | 1,4 | 1,6 | 2,8 | 2,9 |
| user_1 | 1,6 | 2,8 | 2,9 | 3,0 |
| user_2 | 5,4 | 5,8 | 5,7 | 5,2 |
| user_2 | 5,8 | 5,7 | 5,2 | 5,4 |
| user_2 | 5,7 | 5,2 | 5,4 | 5,6 |
| user_2 | 5,2 | 5,4 | 5,6 | 5,8 |
| user_2 | 5,4 | 5,6 | 5,8 | 5,9 |
| user_2 | 5,6 | 5,8 | 5,9 | 5,0 |
2. Purchase Amount Model Data Preparation
-
order_count parameter refers us for the model of the feature count.
-
previous orders of purchase amounts of each customer is collected from fow data
-
Regarding of lahead paramter of LSTM model, data set is shaped per customer.
-
Iterativelly each customer of data set is collected individually. the process is parallelized according to CPU count.
-
When model data has been prepared per customer, it is splitted according to split ratio into the train and test data set (train_x, train_y, test_x, test_y).
-
Why do we need order count as a feature at Purchase Amount Model?
-
Order count is also the feature number of the purchase amount model.
-
!!! Caution !!!
-
Order count must be inserted into the test_parameters.yaml in order not to allow for changing later on prediction.
-
Once the model is built with calculated order_count it must be predicted with the same order count.
-
-
!!! Why we need an order count of a decision? !!!
-
It is a crucial parameter for the purchase amount model.
-
The purchase amount is a 1 Dimensional Conv NN. It works with kernel sizes and they are related to feature size.
-
At the purchase amount model features are sequential orders.
-
For instance if we assign order count as 5, user_1, user_2, user_3, user_4 have 100, 101, 300, 2 orders.
The data set will be;
-
user_1: 95th, 96th, 97th, 98th, 99th, 100th orders
-
user_2: 96th, 97th, 98th, 99th, q00th, 101st orders
-
user_3: 295th, 296th, 297th, 298th, 299th, 300th orders
-
user_4: only have 2 orders first 9 orders will be 0 and this will affect the model process.
It is now crucial to have a minimum 0 assigned order as user_4
However, it is also a crucial point to get as much previous order count for make kernel size larger.
The order count must be optimized even sending to the platform as an argument. If this argument is not using, the platform hamdles for deciding order_count.
-
-
-
| customers | Last 5 | Last 4 | Last 3 | Last 2 | Last Order (y) |
|---|---|---|---|---|---|
| user_1 | 10,4 | 13,4 | 18,4 | 11,4 | 15,4 |
| user_2 | 50,8 | 52,8 | 54,8 | 56,8 | 58,8 |
| user_3 | 30,7 | 25,7 | 15,7 | 10,7 | 8,7 |
| user_4 | 20,2 | 23.5 | 26,2 | 27,2 | 29,2 |
| user_5 | 1,4 | 1,4 | 1,4 | 1,4 | 1,4 |
| user_6 | 12,6 | 30,6 | 12,6 | 30,6 | 12,6 |
-
Parameter Tuning
-
Parameters of networks (LSTM NN & ! Dimensional Conv NN) are tuned via Keras Turner Library. However, batch_size and epoch are tuned individually.
-
epoch hyper parameters are sorting as ascending and batch_size hyper parameters are sorting as descending. Each iteration sorted paramters are used and loss values are calculated. We aim here to capture the best of the minimum epoch and the best of the maximum batch_size.
-
epoch and batch_size are iteratively checking by loss values of last epoch by using Keras- TensorFlow API history. This iteration will be processed until the iteration is lower than parameter_tuning_trials.
-
If the last epoch of loss value is less than accept_threshold_for_loss_diff, then it is excepted as optimum epoch and batch_size.
-
-
Train
-
Next Purchase Model and Purchase Amount Model of the train process are progressed via tensorflow - Keras.
-
It is a Recurrent NN, LSTM NN.
-
Trained model stored at export_path with .json format.
-
.json trained file has a file name with time_preiod, name of the model, trained date (current date). e.g; trained_purchase_amount_model_20210101_month.json
-
Before initialize the training process previously-stored model are checked which have been stored at export_path The most recent trained must be picked. Model name and time_period also must be matched. e.g; recent model: trained_purchase_amount_model_20210101_month.json, model name: purchase_amount, time_period: month, current date 2020-01-30. This model trained 29 days before which is accepted range (accepted range 0 - 30 (one month)).
-
-
Prediction Process
-
First, the next purchase of dates is calculated related to prediction values from the next purchase model per customer individually. Next, the purchase model will predict the time difference of the next order. By using time difference it is possible to find the exact date of the purchase. If the purchase date is in the range between the last purchase transaction date of the raw data and the last purchase transaction date + time_period.
-
After the next purchased orders are predicted, the nest purchase of the values are predicted by the purchase amount mode for each user who has purchases related to the next purchase prediction result data.
-
Result data is stored at export_path. Once a previous result data stored not related to current time_preiod, but it is related to prevşous time_period*, it is merged with current result data.
-
Result data file name: result_data_month.csv
-
Running CLV Prediction
    customer_indicator = "user_id"
    amount_indicator = "transaction_value"
    time_indicator = "days"
    time_period = 'month'
    job = "train" # prediction
    date = '2021-01-01'
    order_count = 15
    data_source = "postgresql"
    data_query_path="""
                select user_id,
                       transaction_value,
                       days
                from purchases
    """
    export_path =  './data'
    connector = {"db": "c****s",
                 "password": "******",
                 "port": "5**3",
                 "server": "127.0.0.1",
                 "user": "*******"}

    from clv.executor import CLV
    clv = CLV(customer_indicator=customer_indicator,
              amount_indicator=amount_indicator,
              job=job,
              date=date,
              order_count=order_count,
              data_source=data_source,
              data_query_path=data_query_path,
              time_period=time_period,
              time_indicator=time_indicator,
              export_path=export_path,
              connector=connector)
    clv.clv_prediction()
Collecting Prediction Result Data
Once, prediction process has been initialized (job: 'prediction'), It can be collected via get_result_data. This data will be represented with raw data per customer of next purchase orders
    from clv.executor import CLV
    clv = CLV(customer_indicator=customer_indicator,
              amount_indicator=amount_indicator,
              date=date,
              order_count=order_count,
              data_source=data_source,
              data_query_path=data_query_path,
              time_period=time_period,
              time_indicator=time_indicator,
              export_path=export_path,
              connector=connector)
    results = clv.get_result_data()
| customers | Last 5 | Last 4 | Last 3 | Last 2 | Last Order (y) |
|---|---|---|---|---|---|
| user_1 | 10,4 | 13,4 | 18,4 | 11,4 | 15,4 |
| user_2 | 50,8 | 52,8 | 54,8 | 56,8 | 58,8 |
| user_3 | 30,7 | 25,7 | 15,7 | 10,7 | 8,7 |
| user_4 | 20,2 | 23.5 | 26,2 | 27,2 | 29,2 |
| user_5 | 1,4 | 1,4 | 1,4 | 1,4 | 1,4 |
| user_6 | 12,6 | 30,6 | 12,6 | 30,6 | 12,6 |
Dashboard for CLV Prediction
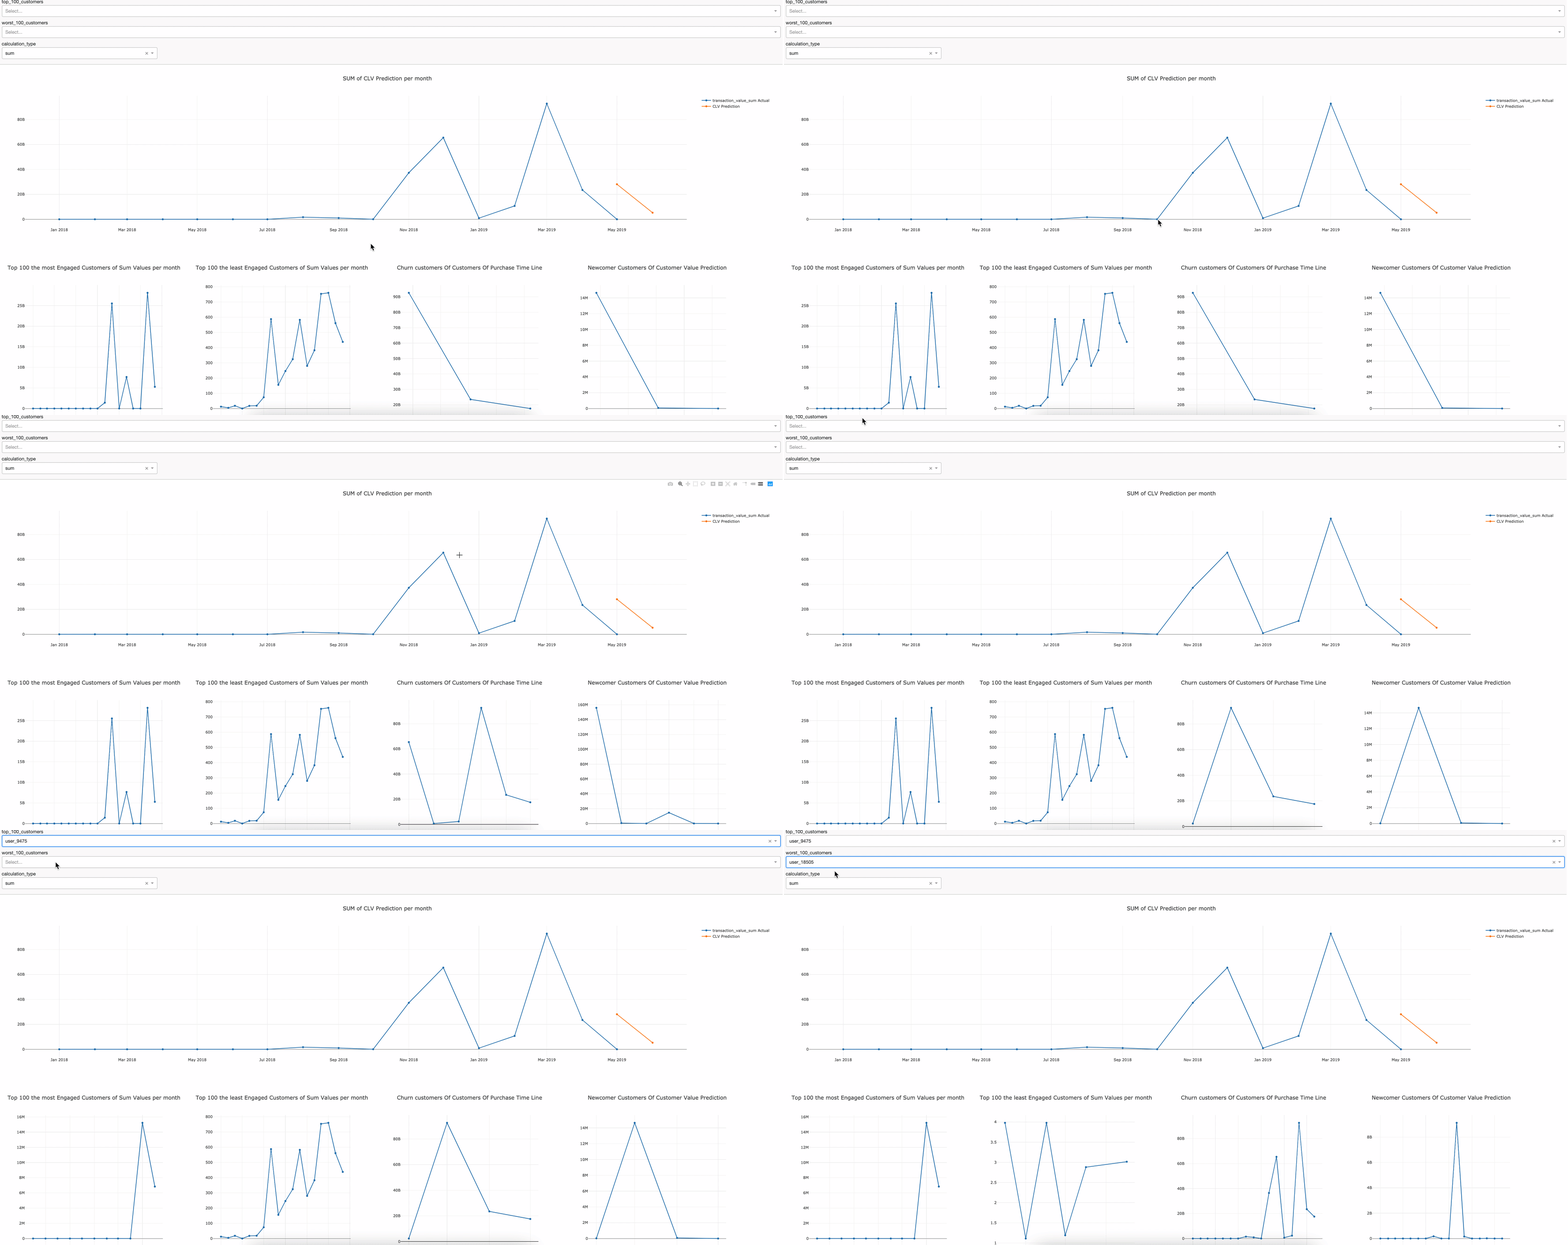
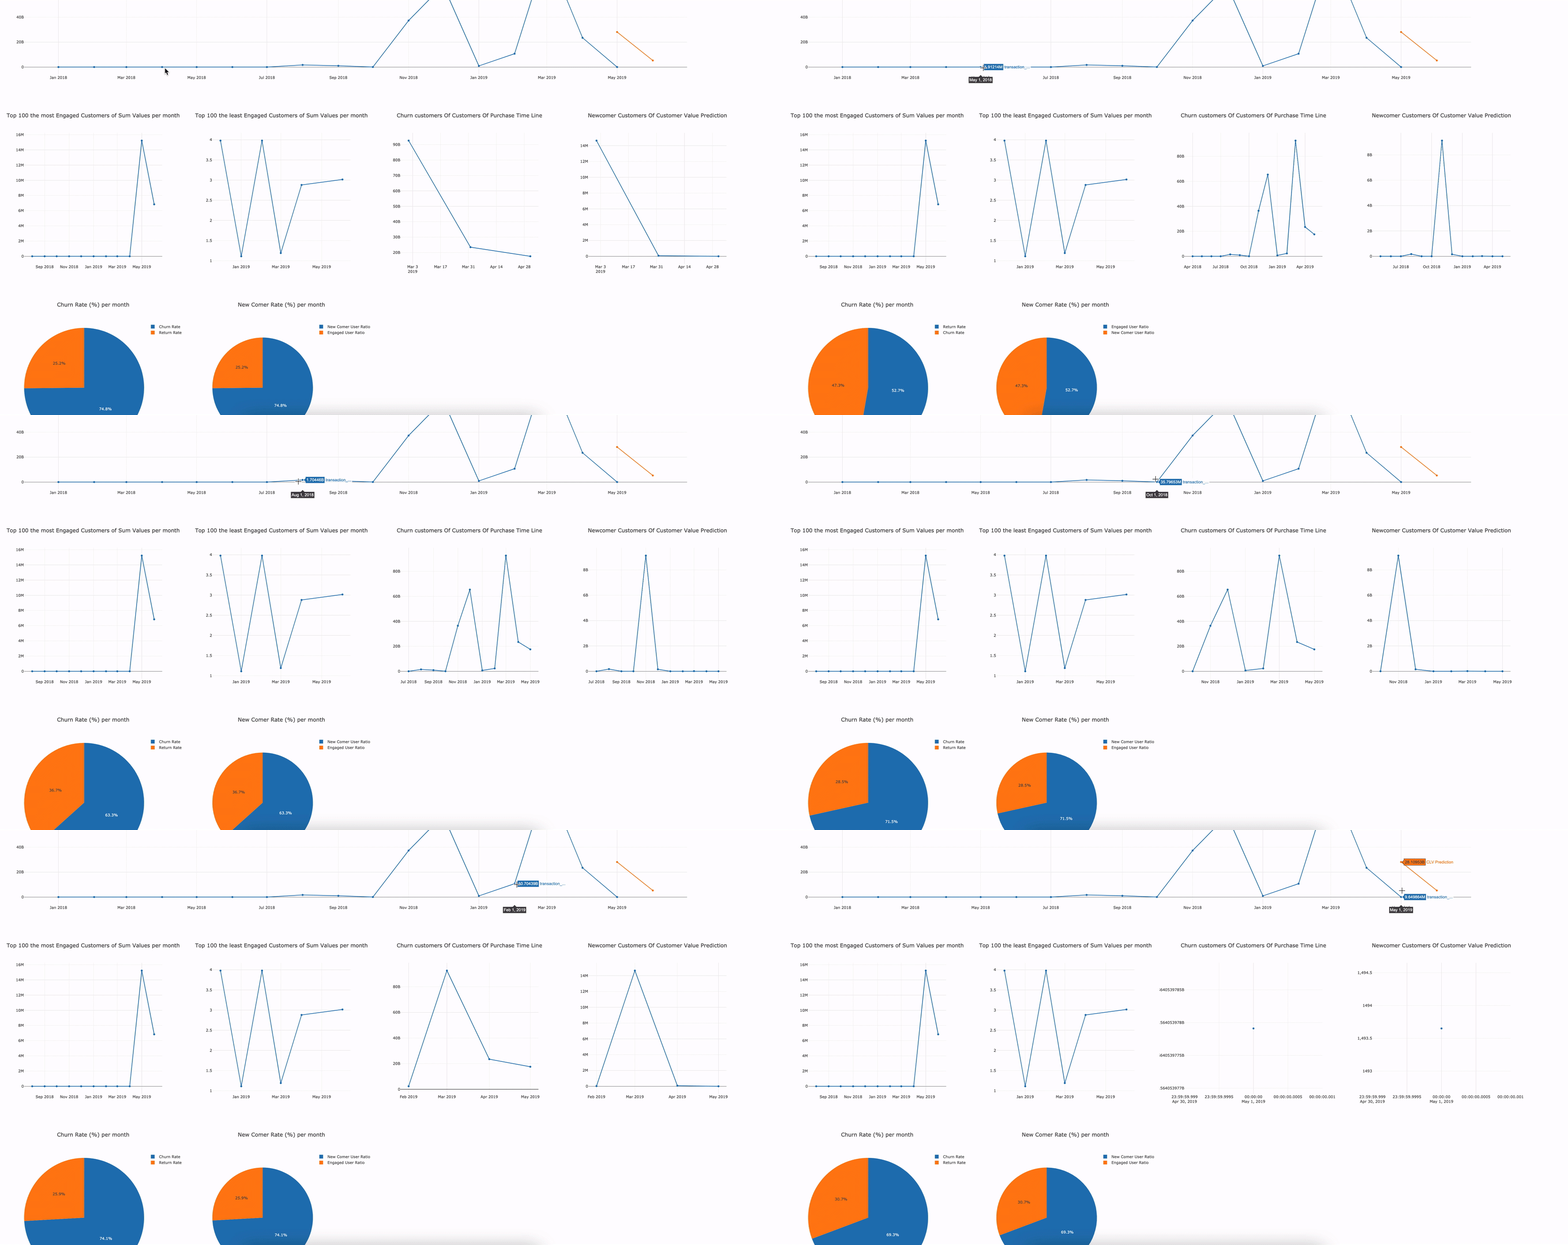
Here are examples of dashboard
-
How does it work?
from clv.executor import CLV clv = CLV(customer_indicator=customer_indicator, amount_indicator=amount_indicator, date=date, order_count=order_count, data_source=data_source, data_query_path=data_query_path, time_period=time_period, time_indicator=time_indicator, export_path=export_path, connector=connector) clv.show_dashboard() -
Dashboard of Components
1. CLV Prediction Time Line
Related to result_data.csv file, all previously calculated results are combined and showed in the line chart.

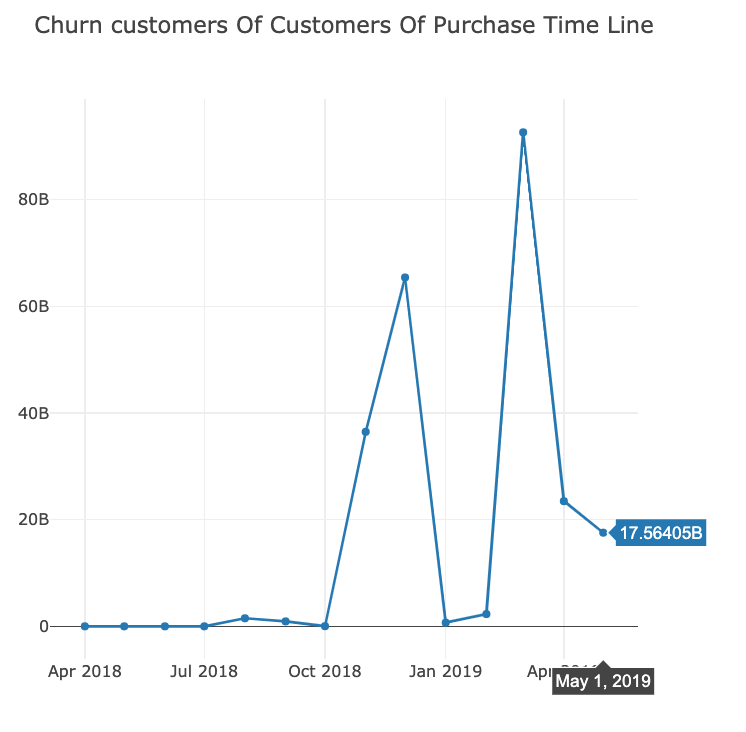
2. Churn Customers Of Purchase TimeLine
According to the selected date from CLV Prediction Time Line, the customers who have purchased before the selected date but never had an order in prediction time periods are detected. These are the churn customers of the selected date.
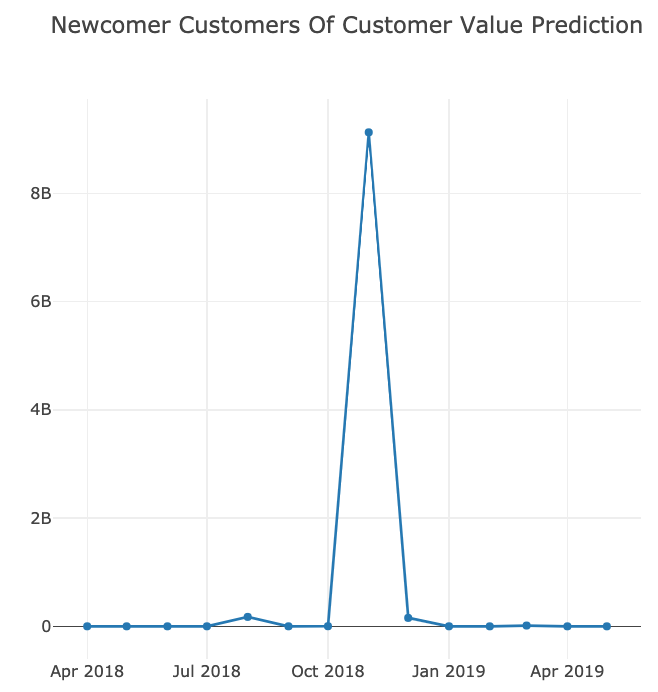
3. Newcomer Customers Of Purchase TimeLine
According to the selected date from CLV Prediction Time Line, the customers, who are newcomers at the selected date and haven`t purchased before the selected date, are detected. These are the churn customers of the selected date.
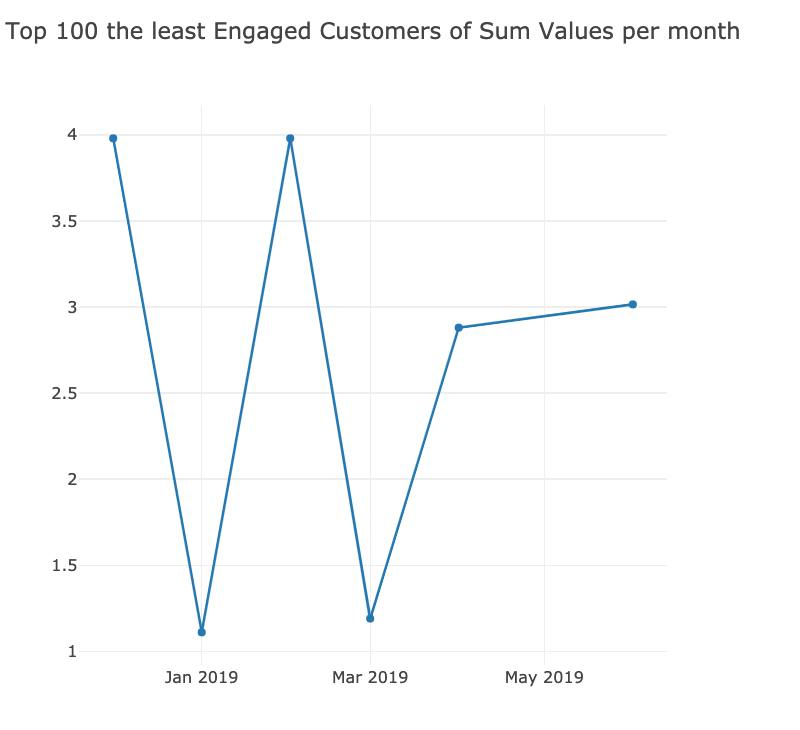
4. Top 100 the Least Engaged Customers Of Sum Values per month
The customers who have fewer purchase amounts than others of purchase amounts sum/mean values in the timeline. These customers are able to be selected individually from the filter, Worst Customer List.
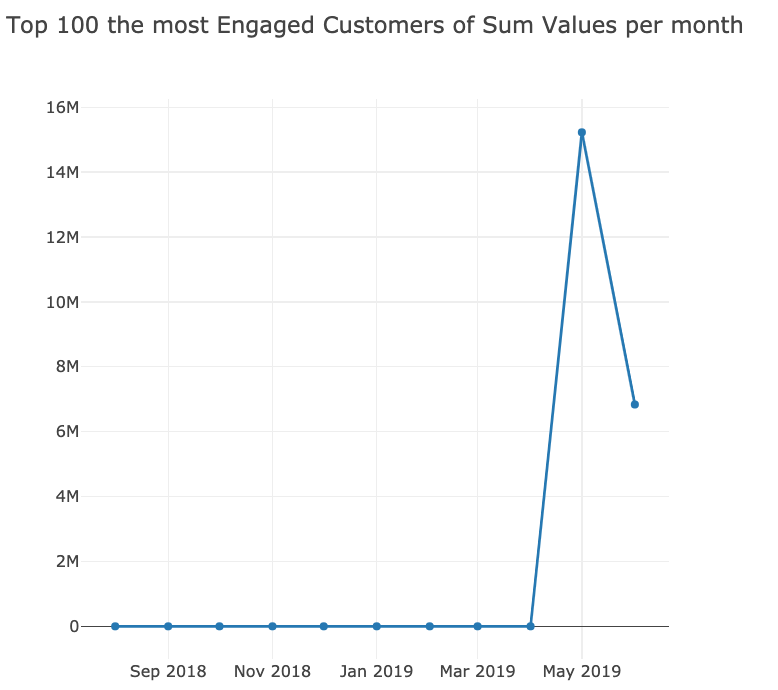
5. Top 100 the Most Engaged Customers Of Sum Values per month
The customers who have more purchase amounts than others of purchase amount sum/mean values in the timeline. These customers are able to be selected individually from the filter, Top Customer List.
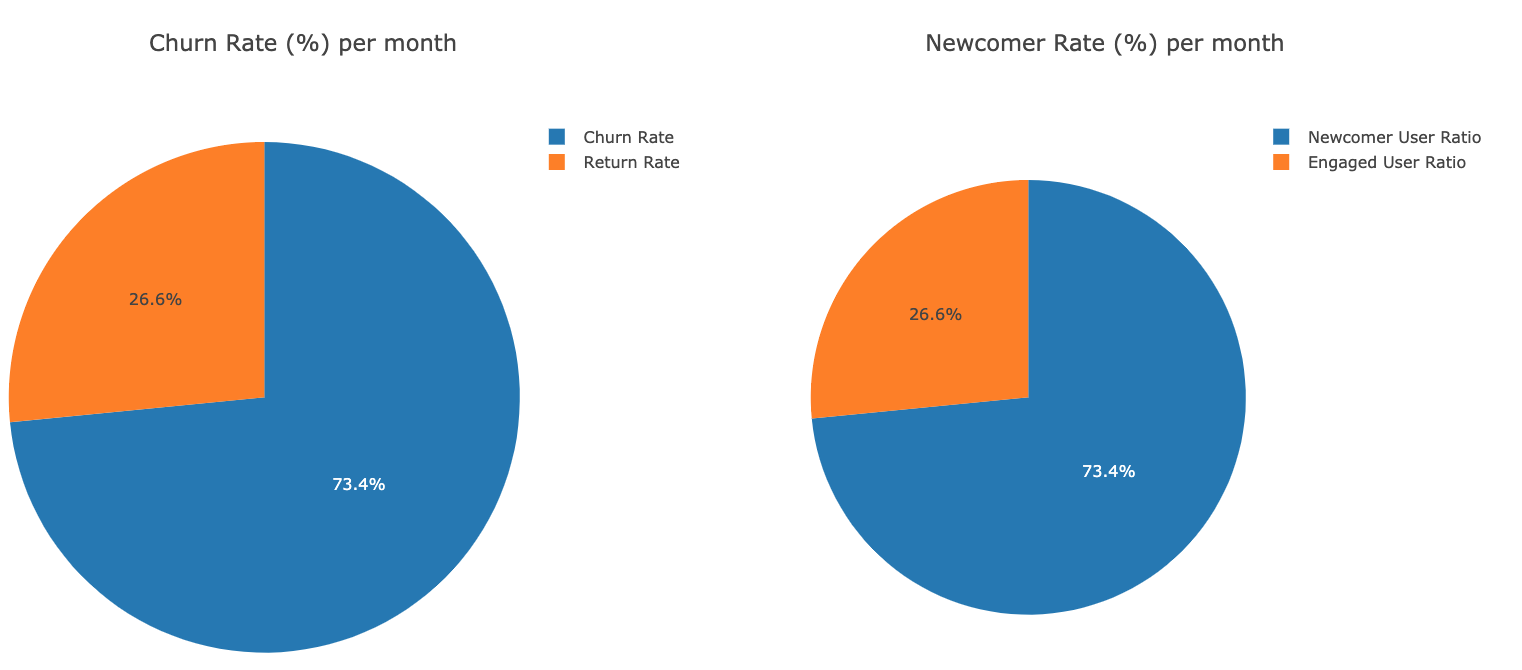
6. Churn Rate and Newcomer Rate per month
These pie charts refer to Newcomer and Churn Rate of the Business According to selected date in CLV Prediction Timeline.
Scheduling CLV Prediction
CLV prediction process is able to be run periodically by using schedule services. Both train and prediction models are allowed to be processed individually. Available periods are; Mondays, Tuesdays, ... Sundays, day, hour, week. It is possible to assign a schedule period by time_period argument.
    from clv.executor import CLV
    clv = CLV(customer_indicator=customer_indicator,
              amount_indicator=amount_indicator,
              date=date,
              order_count=order_count,
              data_source=data_source,
              data_query_path=data_query_path,
              time_period='hour',
              time_indicator=time_indicator,
              export_path=export_path,
              connector=connector)
    results = clv.schedule_clv_prediction()
Project details
Release history Release notifications | RSS feed
Download files
Download the file for your platform. If you're not sure which to choose, learn more about installing packages.


