

CMDBench
A quick and easy benchmarking tool for any command's CPU, memory and disk usage.
CLI and the library functionalities are both provided.
Note: This library is written in, heavily tested, and maintained for the Linux operating system primarily. But Windows and macOS are also supported. Create an issue in case you run into a problem.
Install
To install the library from PyPI, execute the following command in your terminal:
pip install cmdbench
Python compatibility: >=3.6
Table of contents
Quick Start: Command Line Interface
You can use the CLI provided by the python package to benchmark any command.
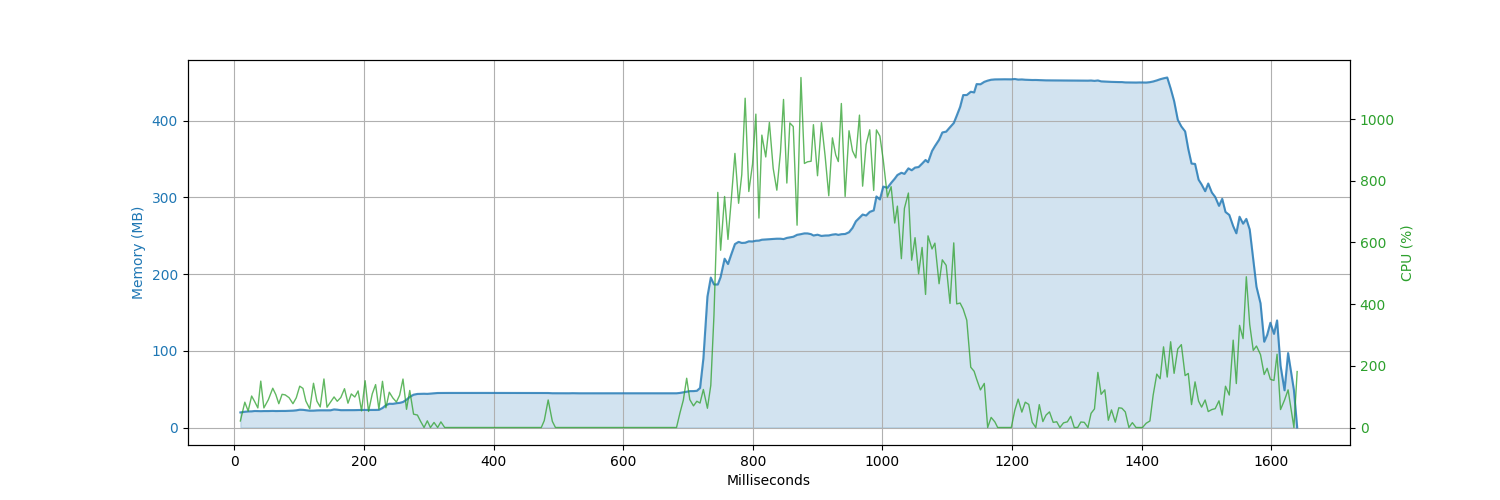
In the following demo, the command node test.js (a slightly modified version of test.js) is being benchmarked 10 times, average of resources are being printed and a plot for the command's cpu and memory usage is being saved to the file plot.png.

The output plot file plot.png for the demo will look like:
Quick Start: Library
Method 1: Easier
You can simply use the benchmark_command function to benchmark a command.
Benchmarks the command stress --cpu 10 --timeout 5 over 20 iterations. But prints only the first one from the benchmark results.
>>> import cmdbench
>>> benchmark_results = cmdbench.benchmark_command("stress --cpu 10 --timeout 5", iterations_num = 20)
>>> first_iteration_result = benchmark_results.get_first_iteration()
>>> first_iteration_result
{
  'cpu': {
    'system_time': 0.04,
    'total_time': 49.75,
    'user_time': 49.71,
  },
  'disk': {
    'read_bytes': 0,
    'read_chars': 5124,
    'total_bytes': 0,
    'total_chars': 5243,
    'write_bytes': 0,
    'write_chars': 119,
  },
  'memory': {
    'max': 2166784,
    'max_perprocess': 1060864,
  },
  'process': {
    'execution_time': 5.0,
    'stderr_data': '',
    'stdout_data': 'stress: info: [20773] dispatching hogs: 10 cpu, 0 io, 0 vm, 0 hdd\n\nstress: info: [20773] successful run
                    completed in 5s\n',
  },
  'time_series': {
    'cpu_percentages': array([  0. ,   0. , 824.1, ..., 889. , 998.3,   0. ])
    'memory_bytes': array([2166784, 2166784, 2166784, ..., 2166784, 2166784, 1060864])
    'sample_milliseconds': array([  39,   54,   65, ..., 4979, 4988, 4997])
  },
}
>>> first_iteration_result.process.execution_time
5.0
Method 2: More customizable
You can also create one or more BenchmarkResults objects, and add benchmark results to them over time.
So you are not forced to perform the benchmarking for the command consecutively when you simply can't.
Could be helpful when you are trying to benchmark multiple commands that need to be executed in a certain order consecutively or depend on each other.
>>> from cmdbench import benchmark_command, BenchmarkResults
>>> benchmark_results = BenchmarkResults()
>>> for _ in range(20):
...   new_benchmark_result = cmdbench.benchmark_command("stress --cpu 10 --timeout 5")
...   benchmark_results.add_benchmark_result(new_benchmark_result)
... # The for loop above is equivalent to: benchmark_results = cmdbench.benchmark_command("stress --cpu 10 --timeout 5", iterations_num = 20)
>>> benchmark_results.get_averages()
{
  'cpu': {
    'system_time': 0.012500000000000002,
    'total_time': 48.468,
    'user_time': 48.45550000000001,
  },
  'disk': {
    'read_bytes': 0.0,
    'read_chars': 5124.0,
    'total_bytes': 0.0,
    'total_chars': 5232.4,
    'write_bytes': 0.0,
    'write_chars': 108.4,
  },
  'memory': {
    'max': 2094080.0,
    'max_perprocess': 1020928.0,
  },
  'process': {
    'execution_time': 5.0,
    'stderr_data': None,
    'stdout_data': None,
  },
  'time_series': {
    'cpu_percentages': array([  0.        , 476.03157895, 794.66363636, ..., 976.05555556,
       188.97777778,   0.        ])
    'memory_bytes': array([2093924.84848485, 2096074.10526316, 2099013.81818182, ...,
       2090552.88888889, 1256561.77777778,  810188.8       ])
    'sample_milliseconds': array([  11.42424242,   21.73684211,   30.90909091, ..., 4986.44444444,
       4995.05555556, 5000.2       ])
  },
}
Usage IPython notebook
For a more comprehensive demonstration on how to use the library and the resources plot, check the provided ipython notebook.
Documentation
benchmark_command(command: str, iterations_num = 1, raw_data = False)
- Arguments
- command: Target command to process.
- iterations_num: Number of times to measure the program's resources.
- raw_data: Whether or not to show all different info from different sources like psutil and GNU Time (if available).
- Returns a BenchmarkResults object containing the related results.
benchmark_command_generator(command: str, interations_num = 1, raw_data = False)
- Arguments: Same as benchmark_command
- Returns a generator object allowing you to obtain a BenchmarkResults after each iteration of benchmarking until done (useful for monitoring the progress and recieving benchmarking data on the go).
BenchmarkResults: Class
- Methods:
get_first_iteration()
Returns the first iteration result in the benchmark results object.get_iterations()
Returns the result for all of the iterations in the benchmark results object.get_values_per_attribute()
Returns object containing lists for each type of value over different iterations.get_averages()
Returns the average for all types of value over different iterations. Also calculates the average of the time series data.get_statistics()
Returns different statistics (mean, stdev, min, max) for all types of values over different iterations.get_resources_plot(width: int, height: int)
Returns matplotlib figure object of CPU and Memory usage of target process over time which can be viewed in an ipython notebook or be saved to an image file.add_benchmark_result(adding_result: BenchmarkResults)
Adds another BenchmarkResults object's benchmark results iterations' data to the current object.
BenchmarkDict: Class(defaultdict)
A custom internal dictionary class used to represent the data for an iteration.
Data inside objects from this class are accessible through both dot notation obj.key and key access obj["key"]
Notes
Windows
When benchmarking on windows, you will need to wrap your main code around the if __name__ == '__main__': statement.
MacOS
MacOS does not allow process-specific disk usage information collection, therefore disk usage will not be reported on macOS when you perform benchmarking.
1 maintainer

Metadata
1 maintainer
Release files for cmdbench 0.1.22
For a detailed explanation of source distributions (sdists) and built distributions (wheels), please see the package formats documentation.
Source distribution (sdist)
| File | Size | Uploaded | |
|---|---|---|---|
| cmdbench-0.1.22.tar.gz | 18.8 kB | Details |
Built distribution (wheel)
| File | Interpreter | ABI | Platform | Reset |
|---|---|---|---|---|
| cmdbench-0.1.22-py3-none-any.whl | Python 3 | none | any | Details |
Total release size: 37.2 kB
Release files / cmdbench-0.1.22.tar.gz
| Download URL | cmdbench-0.1.22.tar.gz |
|---|---|
| Size | 18.8 kB |
| Tags | Source |
|
SHA-256 checksum How to use checksums |
c072af38ad3e0d6275eaade083d6a9d10c909611f1310d4481900d6cf48b124c
|
|
BLAKE2b-256 checksum How to use checksums |
db116382f33465e50332fd03c6e85c7fbbfe11cb11a2fa8acb34b0ba8427a521
|
| Upload date | |
|
Uploaded using Trusted Publishing? What is trusted publishing? |
Yes |
| Uploaded via |
twine/5.1.1 CPython/3.12.7
|
Provenance
Provenance describes where a file came from. On PyPI, provenance is shared via attestations, which provide a verifiable record of the build or publishing details. View details, limitations and caveats.


PyPI Publish Attestation
PyPI verified that this artifact, at this checksum, originated from the publisher listed below.
Signed by GitHub Actions, verified by PyPI on Nov 20, 2024.
Transparency logRelease files / cmdbench-0.1.22-py3-none-any.whl
| Download URL | cmdbench-0.1.22-py3-none-any.whl |
|---|---|
| Size | 18.3 kB |
| Tags | Python 3 |
|
SHA-256 checksum How to use checksums |
e2f43facf83e93ee8c4b0173dd317fbd6c5a0c4fc5142059f8c24eaa3bace133
|
|
BLAKE2b-256 checksum How to use checksums |
924e43bc8915ef146a1e444583169e112706c4ef3fda5bea65eca688388c1113
|
| Upload date | |
|
Uploaded using Trusted Publishing? What is trusted publishing? |
Yes |
| Uploaded via |
twine/5.1.1 CPython/3.12.7
|
Provenance
Provenance describes where a file came from. On PyPI, provenance is shared via attestations, which provide a verifiable record of the build or publishing details. View details, limitations and caveats.
PyPI Publish Attestation
PyPI verified that this artifact, at this checksum, originated from the publisher listed below.
Signed by GitHub Actions, verified by PyPI on Nov 20, 2024.
Transparency log













