
codoniser
visualise codon usage and codon usage correlation
Description
codoniser calculates and visualises codon usage and correlation.
It produces tables of the raw data and (nearly) publication ready figures in SVG format.
Below you can find information for installing and using codoniser.
Installation
You can install codoniser with pip.
Either use the PyPI installation: pip install codoniser.
Or, clone this repository and install manually.
codoniser requires only Python dependencies, which should be installed automatically.
Usage
codoniser takes fasta nucleic acid files (.fna) as positional input. This file should contain the DNA sequences of all ORFs from the source genome.
Be careful to ensure that you have not included pseudogenes or other none-CDS sequences as this will interfer with the analysis (and probably cause an error!).
Example input can be found, here.
codoniser currently offers three analyses:
-bwill plot a bar chart of the codon usage. You can plot one, or many genomes.-pwill plot a heatmap of the codon usage correlation (Pearsons's Rank)between the genomes. You must plot at least three genomes.-swill plot a heatmap of the codon usage correlation (Spearman's rank) between the genomes. You must plot at least three genomes.
Therefore, to run all three analysis you can run, for example:
codoniser -b -p -s *.fna
Output
codoniser produces a number of tables and figures as output.
The example outputs can be found, here.
Bar chart
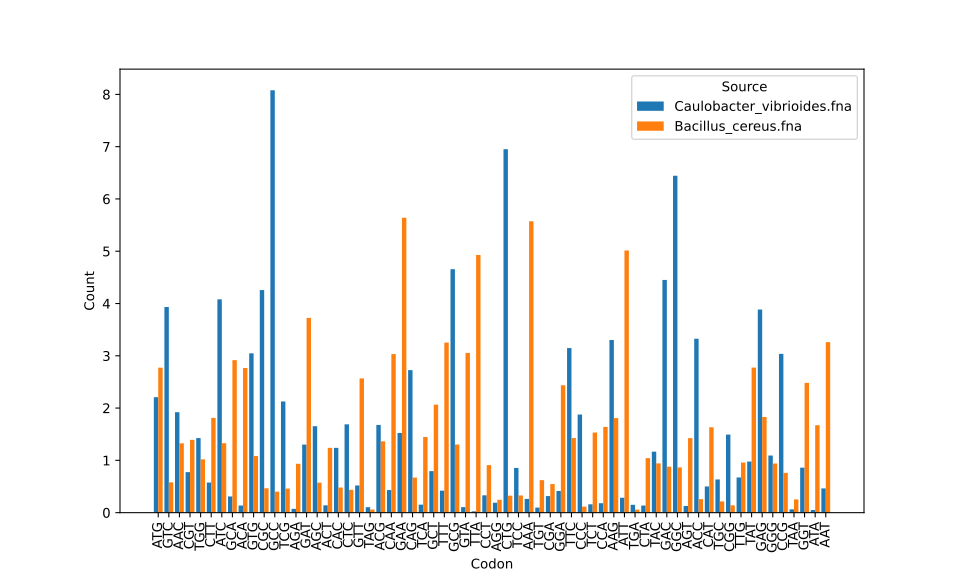
codoniser can produce simple bar charts. It will produce an SVG for both the raw counts and the percantage usage.
The below example is comparing the codon usage of Bacillus cereus and Caulobacter vibrioides, using the command:
codoniser -s Bacillus_cereus.fna Caulobacter_vibrioides.fna
Spearman's and Pearson's Rank
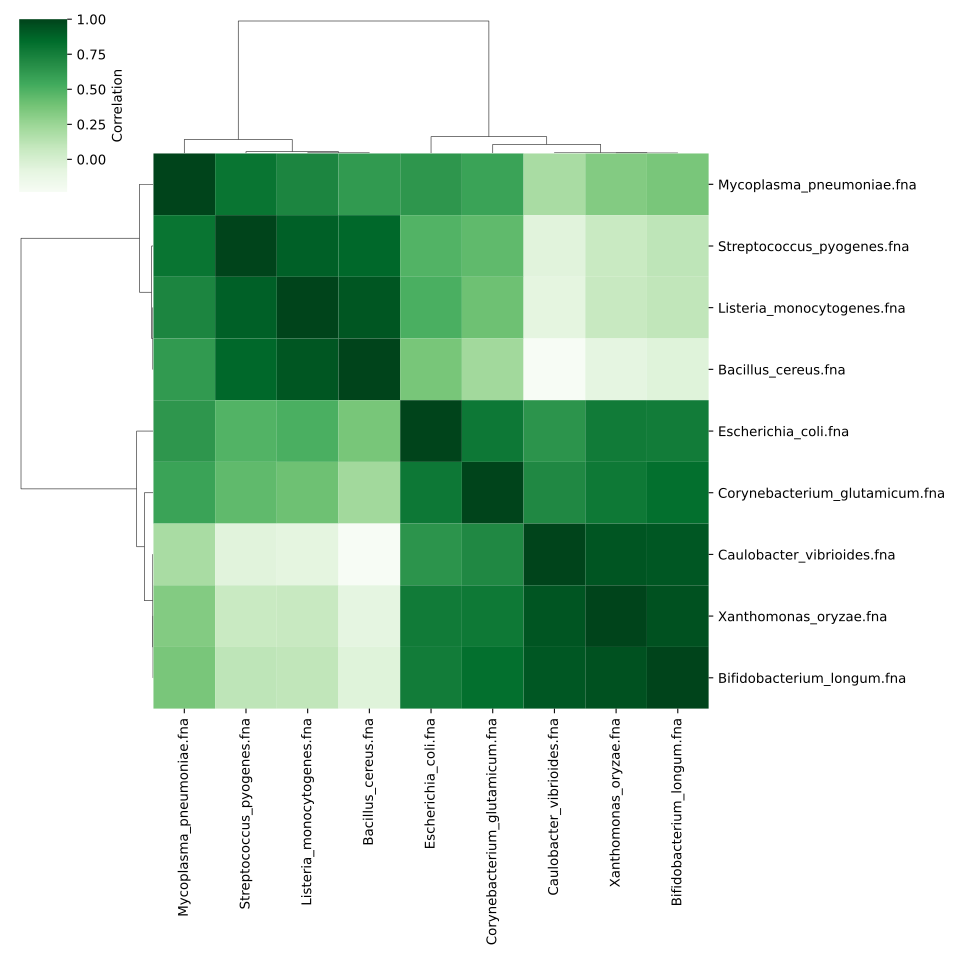
codoniser can analyse the codon usage correlations and produce heatmaps to visualise there relationships. It will provide the correlation matrix, the correlation p-values, the codon counts, and the rank data separate .csv files. It will also provide a .svg image of the heatmap. Below is the SVG produced by using the example data from this repository. You can easily see the codon bias between the low-GC and the high-GC organisms. It was generated with the command:
codoniser -s *.fna
Citation
Coming soon...
Version History
- 1.0.0
- Initial release
- 1.0.1
- Add skip-malformed-cds parameter for skipping pseudogenes etc.
1 maintainer

Release files for codoniser 1.0.1
For a detailed explanation of source distributions (sdists) and built distributions (wheels), please see the package formats documentation.
Source distribution (sdist)
| File | Size | Uploaded | |
|---|---|---|---|
| codoniser-1.0.1.tar.gz | 21.4 kB | Details |
Built distribution (wheel)
| File | Interpreter | ABI | Platform | Reset |
|---|---|---|---|---|
| codoniser-1.0.1-py3-none-any.whl | Python 3 | none | any | Details |
Total release size: 43.9 kB
Release files / codoniser-1.0.1.tar.gz
| Download URL | codoniser-1.0.1.tar.gz |
|---|---|
| Size | 21.4 kB |
| Tags | Source |
|
SHA-256 checksum How to use checksums |
7900c81cdd81cb083760ae2f85fdbebfe065a54a7e33f9322dd06bfcab717916
|
|
BLAKE2b-256 checksum How to use checksums |
71205ab0dc10a5b5eccdf07144fffefa08e0d484a1627abac02fc41595a75d5a
|
| Upload date | |
|
Uploaded using Trusted Publishing? What is trusted publishing? |
No |
| Uploaded via |
twine/6.1.0 CPython/3.10.12
|
Release files / codoniser-1.0.1-py3-none-any.whl
| Download URL | codoniser-1.0.1-py3-none-any.whl |
|---|---|
| Size | 22.5 kB |
| Tags | Python 3 |
|
SHA-256 checksum How to use checksums |
8d0a246d3e837391de75374b43525ce931df6c0f96f59bc2d9229552e537135f
|
|
BLAKE2b-256 checksum How to use checksums |
56a4ecccfe5110e9b42c4a73cebaae08df741b844cfb3b95617fa4464c2ad5c6
|
| Upload date | |
|
Uploaded using Trusted Publishing? What is trusted publishing? |
No |
| Uploaded via |
twine/6.1.0 CPython/3.10.12
|














