Colormap for 2D vectors

Project description
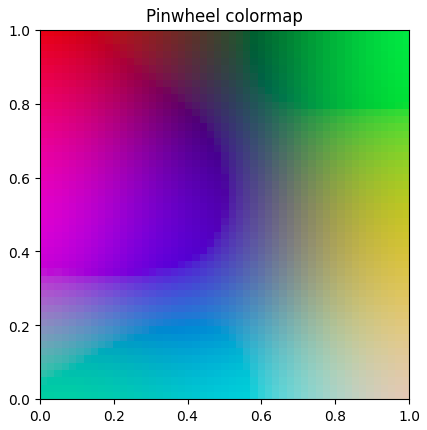
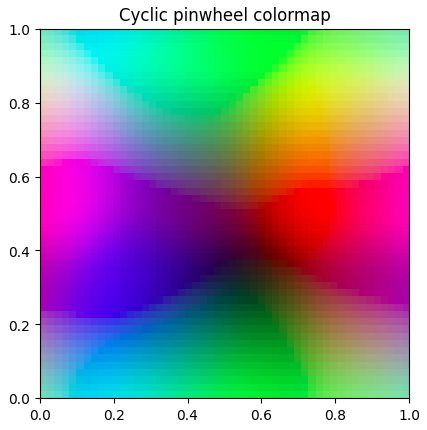
2D Colormap
matplotlib provides many colormaps that map scalars to colors. However, it does not provide such colormaps for 2D vectors. Representing 2D vectors as colors may be helpful when dealing with complex numbers or 2D coordinates. This library provides 2 colormaps for this purpose including a cyclic one.
Installation
pip install colormap2d
Usage
import numpy as np
import colormap2d

some_2d_vectors = np.random.rand(5, 2)

# Random 2D vectors between 0 and 1:
# array([[0.91270668, 0.60020465],
#        [0.51569033, 0.79642031],
#        [0.36533928, 0.31441287],
#        [0.41346207, 0.45163162],
#        [0.99135696, 0.05691322]])

colormap2d.pinwheel(some_2d_vectors)

# RGBA float values between 0 and 1 (default)
# array([[0.69019608, 0.6627451 , 0.24705882, 1.        ],
#        [0.25490196, 0.74509804, 0.82352941, 1.        ],
#        [0.41960784, 0.2       , 0.79215686, 1.        ],
#        [0.18823529, 0.29803922, 0.20392157, 1.        ],
#        [0.24705882, 0.24705882, 0.66666667, 1.        ]])

colormap2d.pinwheel(some_2d_vectors, mode="RGB", dtype=np.uint8)
# RGB integers between 0 and 255:
# array([[166, 179,  50],
#        [ 50,  66,  94],
#        [ 63,  98, 212],
#        [ 66,  66, 196],
#        [222, 199, 169]], dtype=uint8)
Behind the scene
The colormap data has been created using Self-Organizing Maps.


Download files
Download the file for your platform. If you're not sure which to choose, learn more about installing packages.
Source Distribution
Built Distribution
Filter files by name, interpreter, ABI, and platform.
If you're not sure about the file name format, learn more about wheel file names.
Copy a direct link to the current filters
File details
Details for the file colormap2d-0.2.0.tar.gz.
File metadata
- Download URL: colormap2d-0.2.0.tar.gz
- Upload date:
- Size: 24.3 kB
- Tags: Source
- Uploaded using Trusted Publishing? Yes
- Uploaded via: pdm/2.10.1 CPython/3.10.12
File hashes
| Algorithm | Hash digest | |
|---|---|---|
| SHA256 |
4aded6fc45f40b7c573433e78da2af92f65068717440d04270f18c7a6f10587f
|
|
| MD5 |
46971dccdc172ef0303d6ec9c5f4d28f
|
|
| BLAKE2b-256 |
40d612843d9e86c5b73e8d6e63714e3d916763ab1daf292ab7f390ff3a486929
|
File details
Details for the file colormap2d-0.2.0-py3-none-any.whl.
File metadata
- Download URL: colormap2d-0.2.0-py3-none-any.whl
- Upload date:
- Size: 23.1 kB
- Tags: Python 3
- Uploaded using Trusted Publishing? Yes
- Uploaded via: pdm/2.10.1 CPython/3.10.12
File hashes
| Algorithm | Hash digest | |
|---|---|---|
| SHA256 |
d2a6d3d0a51862a0eedad2504f56dc09f9222235078719711e4658025a383da4
|
|
| MD5 |
a5102d8939aecb7de6f005ff1d3593c4
|
|
| BLAKE2b-256 |
871dd537d7662ffc40aa290c7f35c1e835361e31fee1ca60d6113890b6574f04
|


