Collection of colormaps or color palettes for Python

Project description
Colormaps
Colormaps is a library of collection of colormaps or color palettes for Python. It's written in Python with matplotlib and numpy as dependencies. You can use Colormaps to customize matplotlib plots.
Colormaps has colormaps or color palettes from:
- cartocolors
- cmocean
- colorbrewer
- cubehelix
- ncar ncl
- scientific
- tableau
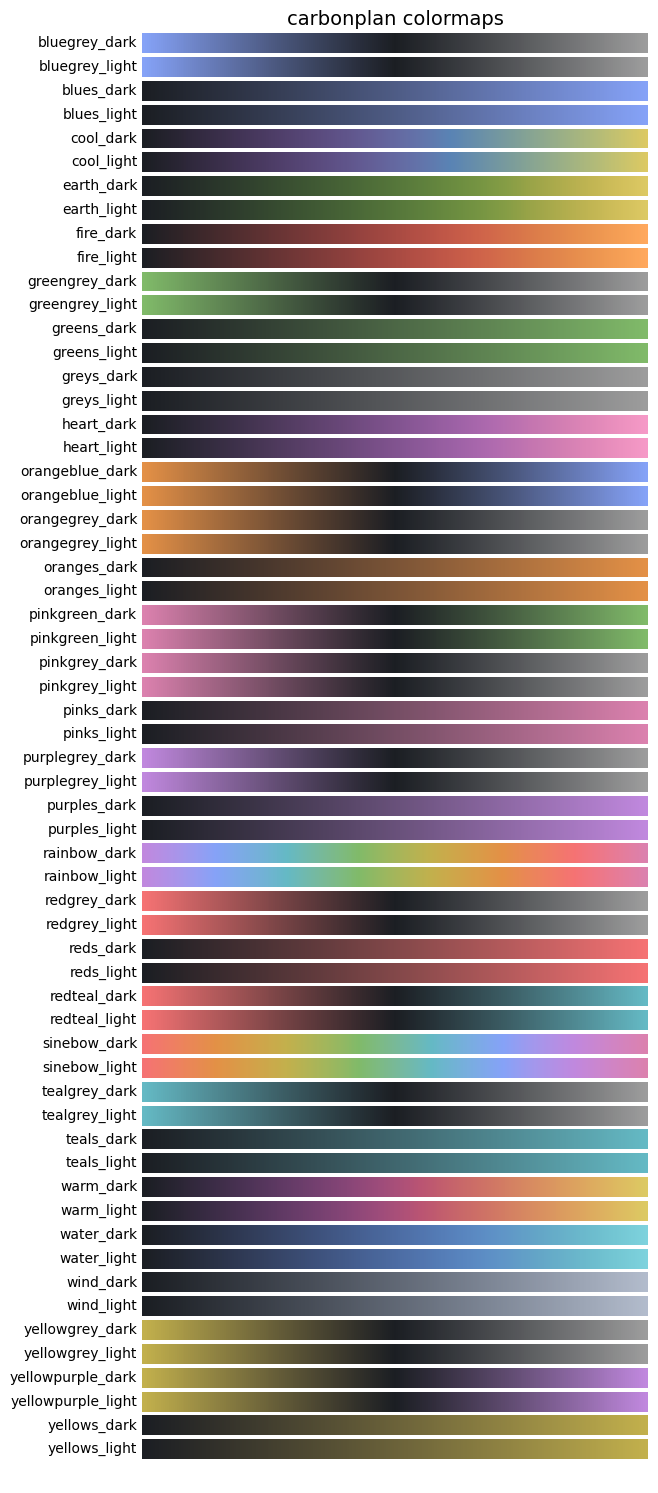
- carbonplan
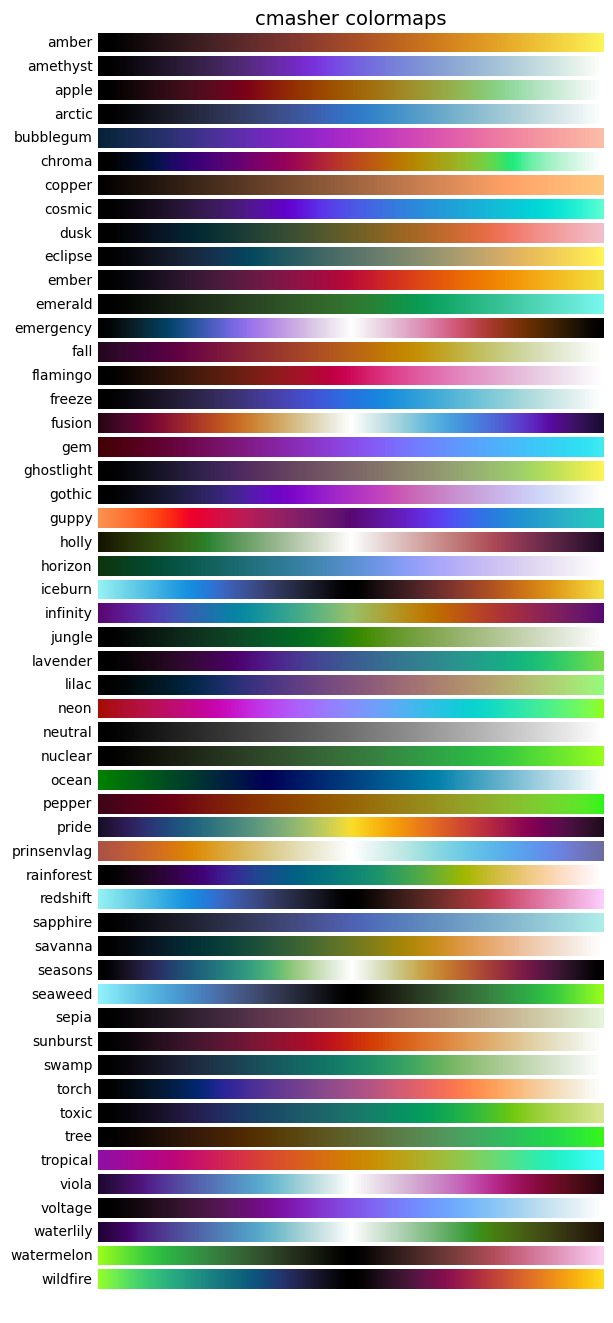
- cmasher
may be more
Docs: https://pratiman-91.github.io/colormaps/
Getting started
Dependencies
Python with:
- matplotlib
- numpy
Installation
pip install colormaps
or using conda
conda install colormaps -c conda-forge`
or using mamba
mamba install colormaps
or you can also use GitHub repo
git clone https://github.com/pratiman-91/colormaps.git
cd colormaps
python setup.py install
Using Colormaps
- Importing Colormaps
import colormaps as cmaps
cmaps.drought_severity

cmaps.ice

- Reverse the colormap
cmaps.ice_r

- Getting discrete number of levels
cmaps.ice.discrete(10)

- Shifting the colormap
cmaps.ice.shift(0.5)

- Shifting and then discrete levels
cmaps.ice.shift(0.5).discrete(10)

- Discrete levels then cut the colormap from left side
cmaps.ice.discrete(11).cut(0.25, 'left')

- Concatenate two or more colormaps
from colormaps.utils import concat
concat1 = concat(["ice", "BkBlAqGrYeOrReViWh200"])

- Concatenate two or more colormaps based on ratio
from colormaps.utils import concat
concat2 = concat([cmaps.ice, cmaps.BkBlAqGrYeOrReViWh200], ratios=[0.25,0.75])

- Concatenate two or more colormaps with granular support
from colormaps.utils import concat
concat3 = concat(
        ["ice", "thermal"],
        ratios=[0.4, 0.6],
        trim=[0.1, 0.05],
        discrete=128,
        name="my_concat"
    )

- Matplotlib usage example
import matplotlib.pyplot as plt
import colormaps as cmaps
import numpy as np

x = y = np.arange(-3.0, 3.01, 0.05)
X, Y = np.meshgrid(x, y)

sigmax = sigmay = 1.0
mux = muy = sigmaxy=0.0

Xmu = X-mux
Ymu = Y-muy

rho = sigmaxy/(sigmax*sigmay)
z = Xmu**2/sigmax**2 + Ymu**2/sigmay**2 - 2*rho*Xmu*Ymu/(sigmax*sigmay)
denom = 2*np.pi*sigmax*sigmay*np.sqrt(1-rho**2)
Z = np.exp(-z/(2*(1-rho**2))) / denom

plt.pcolormesh(X,Y,Z,cmap=cmaps.cubehelix3_16_r)
plt.colorbar()
- Using concat in matplotlib
# Create sample data
X = np.linspace(-np.pi, np.pi, 100)
Y = np.linspace(-np.pi, np.pi, 100)
X, Y = np.meshgrid(X, Y)
Z = np.sin(X) * np.cos(Y)

# Plot with a colormap
fig, axes = plt.subplots(1, 2, figsize=(10, 4))

# Using ice colormap
im1 = axes[0].pcolormesh(X, Y, Z, cmap=cmaps.ice, shading='auto')
axes[0].set_title("Using cmaps.ice")
plt.colorbar(im1, ax=axes[0])

# Using a custom concatenated colormap
custom_cmap = concat(["thermal", "ice"], ratios=[0.4, 0.6])
im2 = axes[1].pcolormesh(X, Y, Z, cmap=custom_cmap, shading='auto')
axes[1].set_title("Using concat(['thermal', 'ice'])")
plt.colorbar(im2, ax=axes[1])
- Register maps with matplotlib
_ = cmaps.ice      # registers "ice" with matplotlib
_ = cmaps.thermal  # registers "thermal" with matplotlib

X = np.linspace(-np.pi, np.pi, 100)
Y = np.linspace(-np.pi, np.pi, 100)
X, Y = np.meshgrid(X, Y)
Z = np.sin(X) * np.cos(Y)

fig, axes = plt.subplots(1, 2, figsize=(10, 4))

im1 = axes[0].pcolormesh(X, Y, Z, cmap="ice", shading='auto')
axes[0].set_title('cmap="ice" (registered by colormaps)')
plt.colorbar(im1, ax=axes[0])

im2 = axes[1].pcolormesh(X, Y, Z, cmap="thermal", shading='auto')
axes[1].set_title('cmap="thermal" (registered by colormaps)')
plt.colorbar(im2, ax=axes[1])

plt.tight_layout()
- Register collections with matplotlib
# Register a single collection up front
cmaps.register_collection('cmocean')

# Now use by string name without prior attribute access
X = np.linspace(0, 1, 100)
Y = np.linspace(0, 1, 100)
X, Y = np.meshgrid(X, Y)
Z = np.sin(np.pi * X) * np.cos(np.pi * Y)

fig, axes = plt.subplots(1, 2, figsize=(10, 4))
im1 = axes[0].pcolormesh(X, Y, Z, cmap="ice", shading='auto')
axes[0].set_title('cmap="ice" via register_collection("cmocean")')
plt.colorbar(im1, ax=axes[0])

cmaps.register_all()

im2 = axes[1].pcolormesh(X, Y, Z, cmap="amber", shading='auto')
axes[1].set_title('cmap="amber" via register_all()')
plt.colorbar(im2, ax=axes[1])

plt.tight_layout()
Finding Colormaps
Colormaps are pre-built and loaded at the time of importing.
- Show different collections
from colormaps.utils import show_cmaps_collection
show_cmaps_collection(collection='cmasher')
- Show all collections
from colormaps.utils import show_cmaps_all
show_cmaps_all()
This is just a sample! You will get a long list of all possible colormap collections.


Download files
Download the file for your platform. If you're not sure which to choose, learn more about installing packages.
Source Distribution
Built Distribution
Filter files by name, interpreter, ABI, and platform.
If you're not sure about the file name format, learn more about wheel file names.
Copy a direct link to the current filters
File details
Details for the file colormaps-0.5.0.tar.gz.
File metadata
- Download URL: colormaps-0.5.0.tar.gz
- Upload date:
- Size: 484.5 kB
- Tags: Source
- Uploaded using Trusted Publishing? No
- Uploaded via: twine/6.1.0 CPython/3.13.7
File hashes
| Algorithm | Hash digest | |
|---|---|---|
| SHA256 |
001e5c6cab426f88cc69a9dba1963c54a4292d7a63f37915be348b12aa27ef60
|
|
| MD5 |
9bb48bee1ab17aa6f9694dd6acb06d82
|
|
| BLAKE2b-256 |
bb023a5e2673f18f0a9d73c6ed69b34cf082e25b78755226df6af50484afe2df
|
File details
Details for the file colormaps-0.5.0-py3-none-any.whl.
File metadata
- Download URL: colormaps-0.5.0-py3-none-any.whl
- Upload date:
- Size: 688.7 kB
- Tags: Python 3
- Uploaded using Trusted Publishing? No
- Uploaded via: twine/6.1.0 CPython/3.13.7
File hashes
| Algorithm | Hash digest | |
|---|---|---|
| SHA256 |
8dc696714e06515b24e53bf066e98b35e84f14ec81155bcde60428c758da56a9
|
|
| MD5 |
9a583397b4912acf84da062f5f794953
|
|
| BLAKE2b-256 |
d5396cfdbf15dda96dabd9110e63c814cd44e25a8e928d47a3973d646ac90f58
|


