Comparing Sequential Forecasters

Project description
comparecast


Code and Python package accompanying our paper, Comparing Sequential Forecasters, published to Operations Research (2023). A preprint version is also available on arXiv.
In the paper, we derive anytime-valid and distribution-free inference procedures for comparing sequential forecasters that each make a prediction over a sequence of events.
This accompanying package, named comparecast, includes implementations of:
- confidence sequence (CS): a sequence of confidence intervals that estimate the average score difference between forecasters A and B (which may vary over time);
- e-process: a sequence of evidences against the null hypothesis that forecaster A scores no better than forecaster B on average.
Confidence sequences can be continuously monitored without having to worry about "sampling to a foregone conclusion," which happens when using a standard, fixed-time confidence interval and repeatedly peeking at the data. E-processes also allow peeking at the data before deciding when to stop the experiment ("anytime-valid"). See here for an overview of these methods, or here for a standalone implementation of confidence sequences.
In the plot below, we plot the 95% (empirical-Bernstein) CS and its corresponding e-processes (one for each forecaster) for comparing the probability forecasts of FiveThirtyEight and Vegas odds on all Major League Baseball games from 2010 to 2019. The average Brier score slightly favors Vegas odds over time, and the CS closely tracks this average score and represents the uncertainty in estimating the score while accounting for the randomness of data.
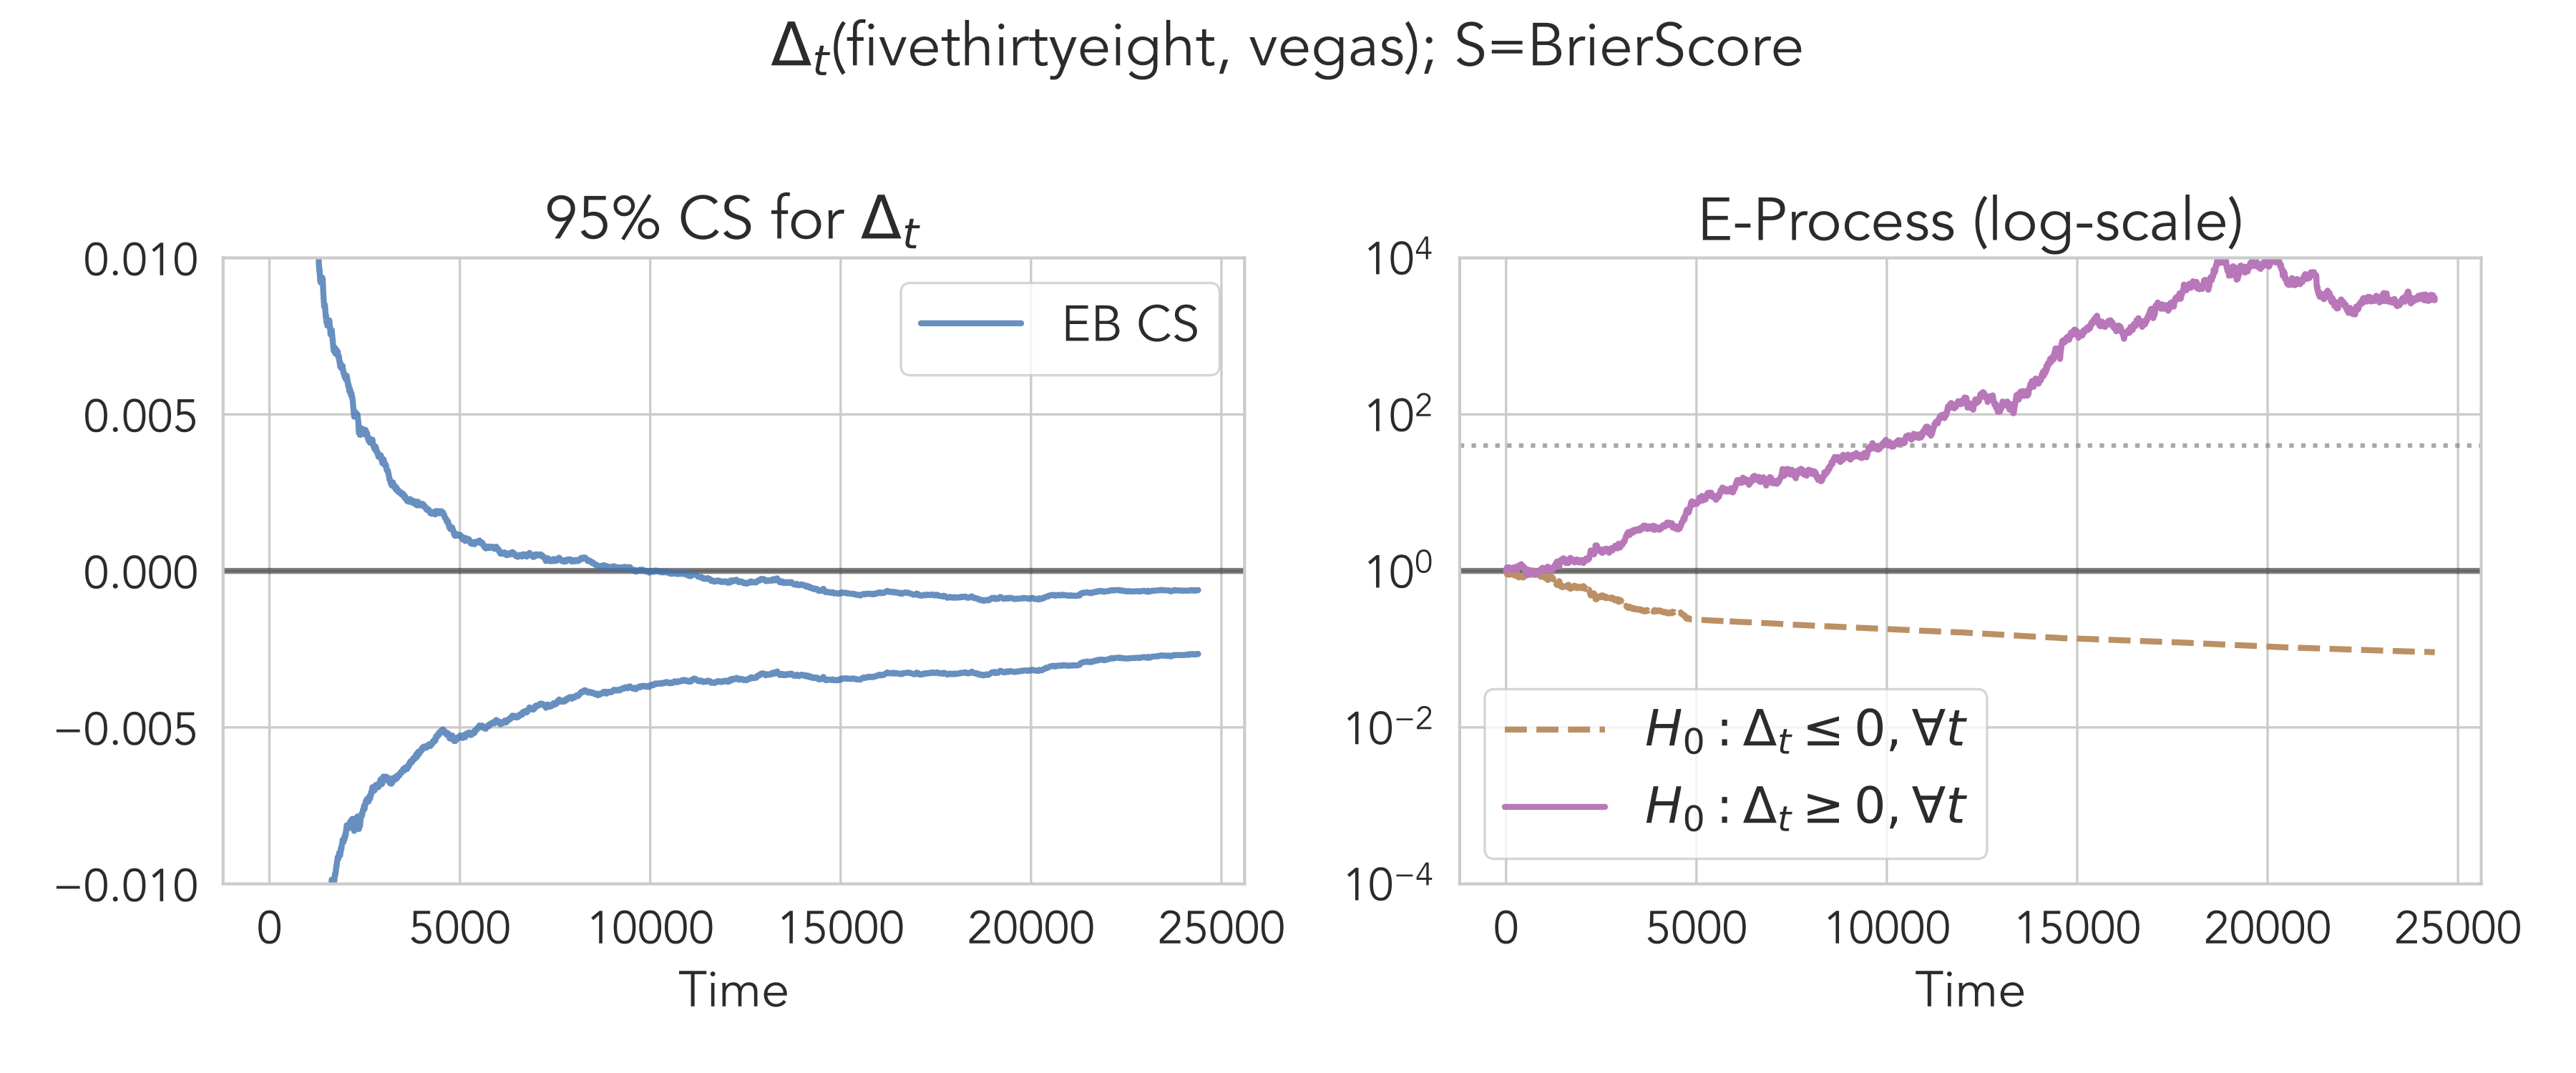
See nb_comparecast_baseball.ipynb for the code that generated this plot.
Installation
Requires Python 3.7+.
From pip:
pip install --upgrade pip
pip install --upgrade pandas seaborn tqdm confseq
pip install --upgrade comparecast
From source:
git clone https://github.com/yjchoe/ComparingForecasters
cd ComparingForecasters

pip install --upgrade pip
pip install -r requirements.txt
pip install -e .
Data Sources
See data/README.md.
Sample Usage
Also see experiment notebooks below.
Python
The following sample code generates some simulated data and forecasters.
Then, it computes the CS and the e-processes for comparing two of these forecasters,
and saves the relevant plots inside the plots/test directory.
import comparecast as cc

# Generate/retrieve synthetic data
data = cc.data_utils.synthetic.get_data("default", size=1000)

# Calculate, save, and plot the forecasts
forecasters = ["k29_poly3", "laplace", "constant_0.5"]
data = cc.forecast(data, forecasters, out_file="data/test.csv")
cc.plot_forecasts(data, forecasters, plots_dir="plots/test")

# Compare forecasts using confidence sequences & e-values
results = cc.compare_forecasts(
    data,
    "k29_poly3",
    "laplace",
    scoring_rule="brier",
    alpha=0.05,
    compute_cs=True,
    compute_e=True,
)
# returns a pandas DataFrame
results.tail(5)
#      time       lcb       ucb         e_pq      e_qp
# 995   996  0.012868  0.072742  2025.725774  0.021684
# 996   997  0.013050  0.072879  2157.262456  0.021672
# 997   998  0.012635  0.072492  1886.687861  0.021596
# 998   999  0.012824  0.072637  2013.209084  0.021583
# 999  1000  0.012447  0.072275  1783.204679  0.021519


# Draw a comparison plot and save in plots/test/*.pdf
results, axes = cc.plot_comparison(
    data,
    "k29_poly3",
    "laplace",
    scoring_rule="brier",
    alpha=0.05,
    baselines=("h", "acs"),
    plot_e=True,
    plot_width=True,
    plots_dir="plots/test",
)
Command Line Interface
(Clone this repo first.)
# Generate synthetic data and forecasts
python3 forecast.py -d default -n 1000 -f all \
    -o forecasts/test.csv -p plots/test

# Compare forecasts and plot results
python3 plot_comparisons.py -d forecasts/test.csv \
    -p k29_poly3 -q laplace --baselines h acs -o plots/test

# Compare 538 and vegas forecasters
python3 plot_comparisons.py -d forecasts/mlb_2010_2019.csv \
    -p fivethirtyeight -q vegas --baselines acs -o plots/test/mlb_2010_2019 \
    --ylim-scale 0.01
Experiments
Main experiments (appearing in the main paper):
nb_comparecast_synthetic.ipynb: Experiments on synthetic data and forecasts. Includes comparison with a fixed-time CI. Section 5.1 in our paper.nb_comparecast_scoringrules.ipynb: Experiments on synthetic data and forecasts using different scoring rules. Section 5.1 (Figure 4) in our paper.nb_comparecast_baseball.ipynb: Experiments on Major League Baseball forecasts, leading up to the 2019 World Series. Section 5.2 in our paper.nb_comparecast_weather.ipynb: Experiments on postprocessing methods for ensemble weather forecasts. Includes e-value comparison with Henzi & Ziegel (2021). Section 5.3 in our paper.
Additional experiments (some appearing in the E-Companion/Appendix of our paper):
nb_comparecast_dmgw_miscoverage.ipynb: Validity comparison with classical comparison methods (DM & GW).nb_comparecast_comparison_with_dm_power.ipynb: "Power" comparison with classical comparison methods (DM & GW).nb_comparecast_weather_eda.ipynb: Exploratory plots on the ensemble weather forecast dataset.nb_iid_mean.ipynb: Comparison of uniform boundaries on the mean of IID data. Partly reproduces Figure 1 from Howard et al. (2021).nb_cgf_convexity.ipynb: Illustration of the Exponential CGF-like function.nb_eprocess_ville.ipynb: Illustrating some properties of (sub-exponential) e-/p-processes in the context of game-theoretic statistical inference. Not used in our paper.
Code License
MIT
Authors
References
If you use parts of our work, please cite our paper as follows:
Text:
Choe, Y. J., & Ramdas, A. (2023). Comparing sequential forecasters. Operations Research. https://doi.org/10.1287/opre.2021.0792
BibTeX:
@article{choe2023comparing,
  title={Comparing sequential forecasters},
  author={Choe, Yo Joong and Ramdas, Aaditya},
  journal={Operations Research},
  year={2023},
  doi={https://doi.org/10.1287/opre.2021.0792},
  publisher={INFORMS}
}


Download files
Download the file for your platform. If you're not sure which to choose, learn more about installing packages.
Source Distribution
Built Distribution
Filter files by name, interpreter, ABI, and platform.
If you're not sure about the file name format, learn more about wheel file names.
Copy a direct link to the current filters
File details
Details for the file comparecast-1.0.0.tar.gz.
File metadata
- Download URL: comparecast-1.0.0.tar.gz
- Upload date:
- Size: 42.9 kB
- Tags: Source
- Uploaded using Trusted Publishing? No
- Uploaded via: twine/4.0.2 CPython/3.9.10
File hashes
| Algorithm | Hash digest | |
|---|---|---|
| SHA256 |
ea314f43e2adb6c3cf14fcba7c01c7440a8bcadcce4075828d5221f75e2bbac7
|
|
| MD5 |
d734a41b16922af2fb5e3ee312593364
|
|
| BLAKE2b-256 |
157c65e841c18a27bd39b8ef3bcce0cc327c18bf16baf4c5cfd2fa24c9e8f702
|
File details
Details for the file comparecast-1.0.0-py3-none-any.whl.
File metadata
- Download URL: comparecast-1.0.0-py3-none-any.whl
- Upload date:
- Size: 45.8 kB
- Tags: Python 3
- Uploaded using Trusted Publishing? No
- Uploaded via: twine/4.0.2 CPython/3.9.10
File hashes
| Algorithm | Hash digest | |
|---|---|---|
| SHA256 |
2e6f7979e5593c04fd2b490823445f3c6bb2e8a8b878a2ee84ea14705d683094
|
|
| MD5 |
1f09aca8d2dc09d400ee90249d3c1354
|
|
| BLAKE2b-256 |
3250e3873567e5f1f467da8626b7a537d70804c585b95a3f537aa5b6faf7dfe0
|


