
ML analysis

Project description


In January 2024, I defended my doctoral thesis in computational toxicology, and since then, I have been contemplating how to contribute to the community with code that can simplify calculations needed according to the specific problem. Over these years, among many other things, I have worked on topics related to interpretability, visualization of chemical space, and combining the outputs of different models. In all cases, the problem was common: I often needed a lot of code for tasks that were part of my daily routine. That's why I decided to create comptox_analysis.
Installation
Dependencies
comptox_analysis requires:
- rdkit=2023.09.6
- bokeh=3.1.1
- scikit-learn
- matplotlib
- numpy
- pandas
User installation
The easiest way to install comptox_analysis is using pip:
pip install comptox_analysis
Example of Usage for Interpretability using highlighter
Imagine you obtain the feature importance, which in this case are fingerprints, using a ML or DL model, and you want to highlight the most important fingerprints for each molecule. To carry out this task, we first load the necessary libraries and the dataset, build a Random Forest model as an example, and then extract the feature importance.
# Import library
from comptox_analysis.highlighting.highlighting_atoms import highlighter
from rdkit import Chem
from rdkit.Chem import PandasTools
from rdkit.Chem.AllChem import GetMorganFingerprintAsBitVect
import numpy as np
import pandas as pd
from sklearn.ensemble import RandomForestRegressor

df=PandasTools.LoadSDF('caco2.sdf',smilesName='Smiles')

def fingerprints_inputs2(dataframe):
        X=np.array([GetMorganFingerprintAsBitVect(mol,radius=2,nBits=2048,useFeatures=True) for mol in [Chem.MolFromSmiles(m) for m in list(dataframe.Smiles)]])
        y=dataframe.activity.astype('float')
        return X,y

X,y=fingerprints_inputs2(df)

model=RandomForestRegressor(random_state=46).fit(X,y)

columns=[f'fp_{i}' for i in range(2048)]

imp=pd.Series(data=model.feature_importances_,index=columns).sort_values(ascending=False)
imp[:10].plot.bar();
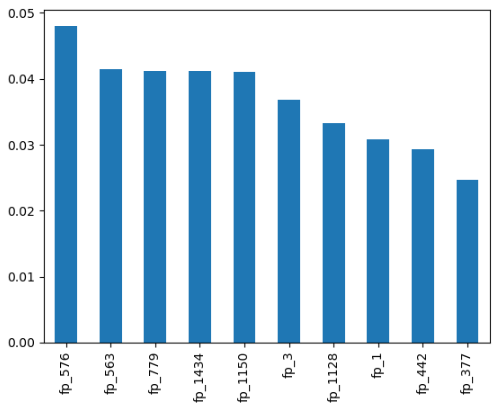
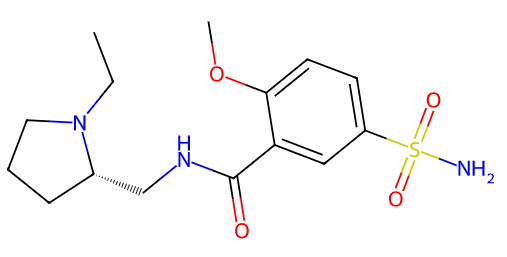
We are going to select compounds with two of the ten most important variables (in this case, we obtain a list with three compounds). Now, we render the image of the first compound using render_image function:
df_fp=pd.DataFrame(X,columns=columns)

indexes=df_fp[(df_fp.fp_576==1)&(df_fp.fp_779==1)].index.values

mols=df.loc[indexes,'Smiles'].tolist()

highlighter_instance=highlighter(mols)

highlighter_instance.render_image(number=0,indexes=False)
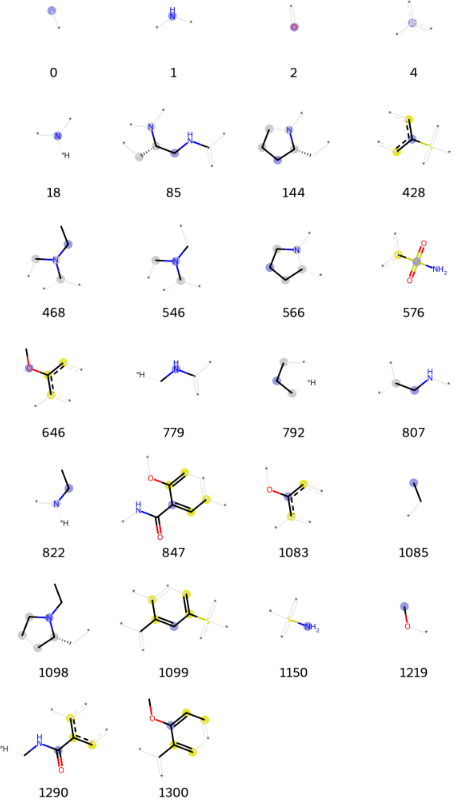
Also, you can visualize molecular fragments using fragmentation function:
highlighter_instance.fragmentation(n=26,number=0)[0]
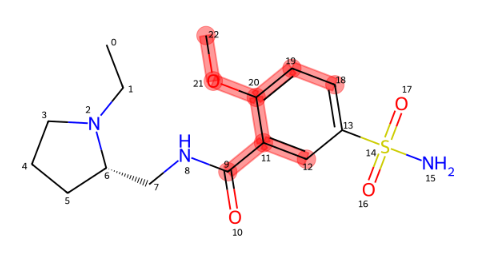
And now, using highlighting function, you will be able to observe the fragments that you want to highlight (the package supports both, rdkit and morgan fingerprints):
highlighter_instance = highlighter([mols[0]])

highlighter_instance.highlighting(type='morgan',fingerprint_numbers=[[1300]])
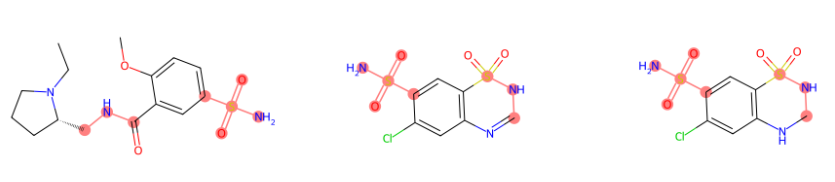
Also, it is possible to highlight multiple compounds (in this case we are highlighting the selected fingerprints as an example):
#for multiple compounds

highlighter_instance = highlighter(mols)

highlighter_instance.highlighting(fingerprint_numbers=[[576,779],[576,779],[576,779]])
Example of Usage for chemical space visualization
Another option which is included in this library is visualize the chemical space. It is supported the use of three kind of descriptor:
- molecular descriptor: Mollogp, molweight... (207 variables)
- Morgan fingerprints
- Rdkit fingerprints
If you select molecular descriptor, a Bokeh plot will display the results of a PCA. For any type of fingerprint, a parametric t-SNE is constructed, where the t-SNE output is trained using an MLPRegressor. With just one line of code, you can generate an interactive HTML visualization of the chemical space, including molecular structures that appear when hovering over each scatter point.
Both training and test sets can be visualized (if applicable), and the points on the graph can be color-coded according to the class each compound belongs to, supporting multi-class classification problems. Additionally, you can deselect compounds from specific classes by clicking on the corresponding legend in the plot.
plotter = chemical_space_plotter('cox2_train.sdf', 'cox2_test.sdf')
plotter.visualizer(type='molecular_descriptor', test=True, Save=True)
Release history Release notifications | RSS feed


Download files
Download the file for your platform. If you're not sure which to choose, learn more about installing packages.
Source Distribution
Built Distribution
Filter files by name, interpreter, ABI, and platform.
If you're not sure about the file name format, learn more about wheel file names.
Copy a direct link to the current filters
File details
Details for the file comptox_analysis-1.0.tar.gz.
File metadata
- Download URL: comptox_analysis-1.0.tar.gz
- Upload date:
- Size: 27.4 kB
- Tags: Source
- Uploaded using Trusted Publishing? No
- Uploaded via: twine/5.1.1 CPython/3.8.19
File hashes
| Algorithm | Hash digest | |
|---|---|---|
| SHA256 |
6a5a28687e3fd7c5499f9d3aa282dc4de689f1b31cfbd07ebf4239bb40fa9c11
|
|
| MD5 |
4b99cc986f61d8787cbc3790492c7bc4
|
|
| BLAKE2b-256 |
52f8140213c2a0d1c518063e422e3fe3ce2a65892907eacff4b39e9e4beb93ff
|
File details
Details for the file comptox_analysis-1.0-py3-none-any.whl.
File metadata
- Download URL: comptox_analysis-1.0-py3-none-any.whl
- Upload date:
- Size: 28.0 kB
- Tags: Python 3
- Uploaded using Trusted Publishing? No
- Uploaded via: twine/5.1.1 CPython/3.8.19
File hashes
| Algorithm | Hash digest | |
|---|---|---|
| SHA256 |
2f47c1bda136fedc78e1b96fa1b2c1fe9c066bf48a1b5cc006b566e3f69357cf
|
|
| MD5 |
1e18480490aa09b8cd0c36a621882685
|
|
| BLAKE2b-256 |
6bdb8d00b980c4ed6e79c6a892c900fdfa04d306e384dc11d05be76c1d5323dc
|






