
A Python engine to backtest, optimize, and graph trading strategies

Project description
Contango
Documentation · License



Contango is a python engine to backtest, optimize, create, and graph trading strategies with ease using Plotly. Strategies can be parameterized over tens of thousands of parameters to find the optimal regions while allowing unique strategies to be effortlessly compared amongst each other.
Features
- Event-driven engine - strategies react to
MarketDataEvent,OrderEvent,AcceptedFillEvent,PortfolioSnapshotEvent, and more, published through an event bus with explicit subscriber priorities. - Composable brokers & calendars - historical brokers (e.g.
Yfinance) fetch OHLCV data, calendars (e.g.NYSECalendar) define the trading dates, and a data repository caches everything so you're not re-polling the same bars every run. - Grid-search optimization - sweep a strategy over any number of parameters (
ResearchRunner/BacktestExperimentRunner), and get back aBacktestExperimentResultper combination with the raw execution data and metrics attached. - Built-in indicators & state machines - ATR, Bollinger Bands, EMA, RSI, SMA, VWAP, Wilder Average, plus state machines (e.g.
ABOVE/BELOW,BELOW_LOWER/BETWEEN_LOWER_AND_MIDDLE/etc.) so strategies can signal off of states instead of raw values. - Full metric suite - return, risk, drawdown, and trade metrics (sharpe, calmar, profit factor, expectancy, and more) generated automatically from a backtest's raw events.
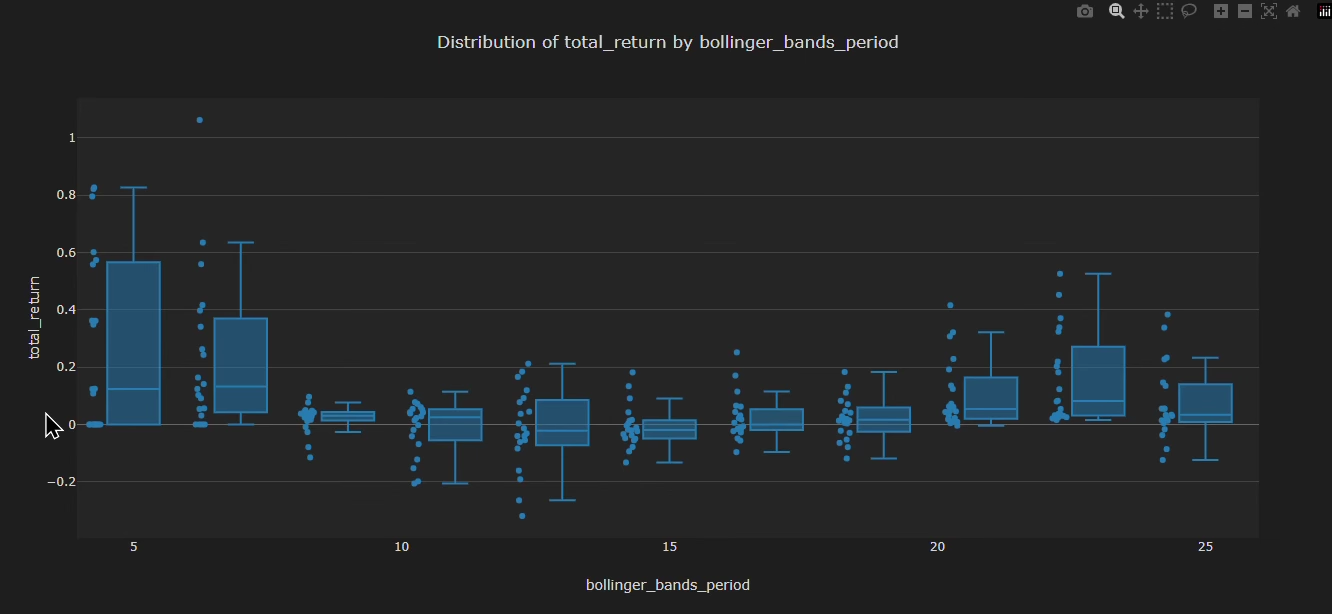
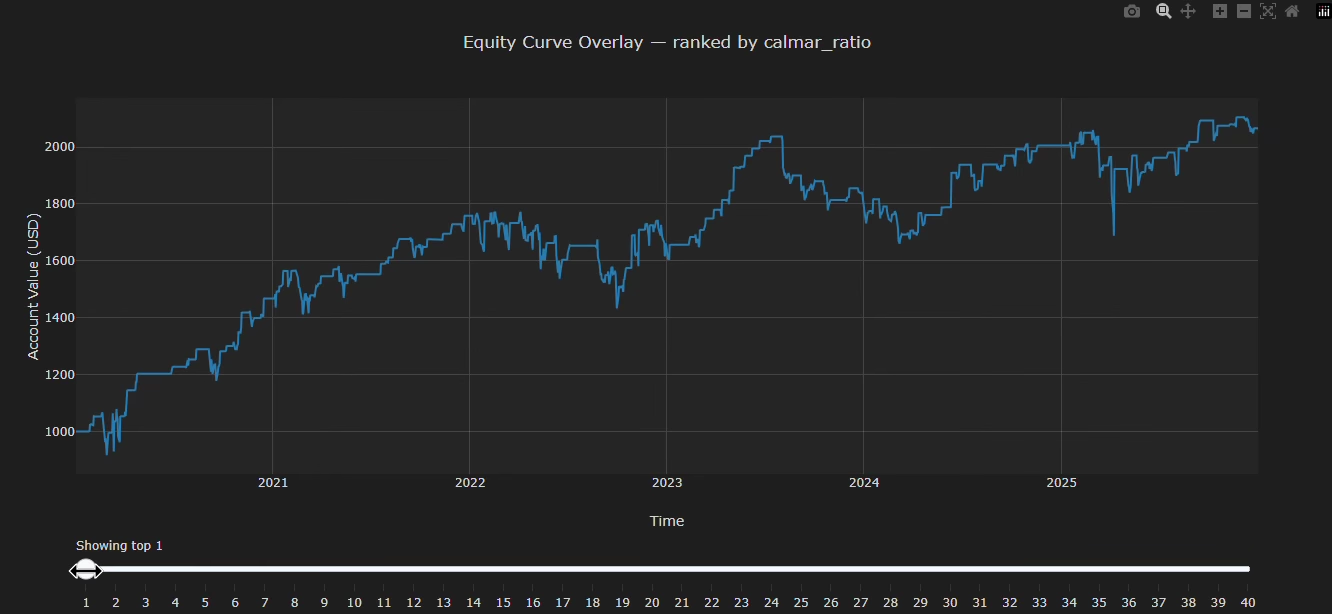
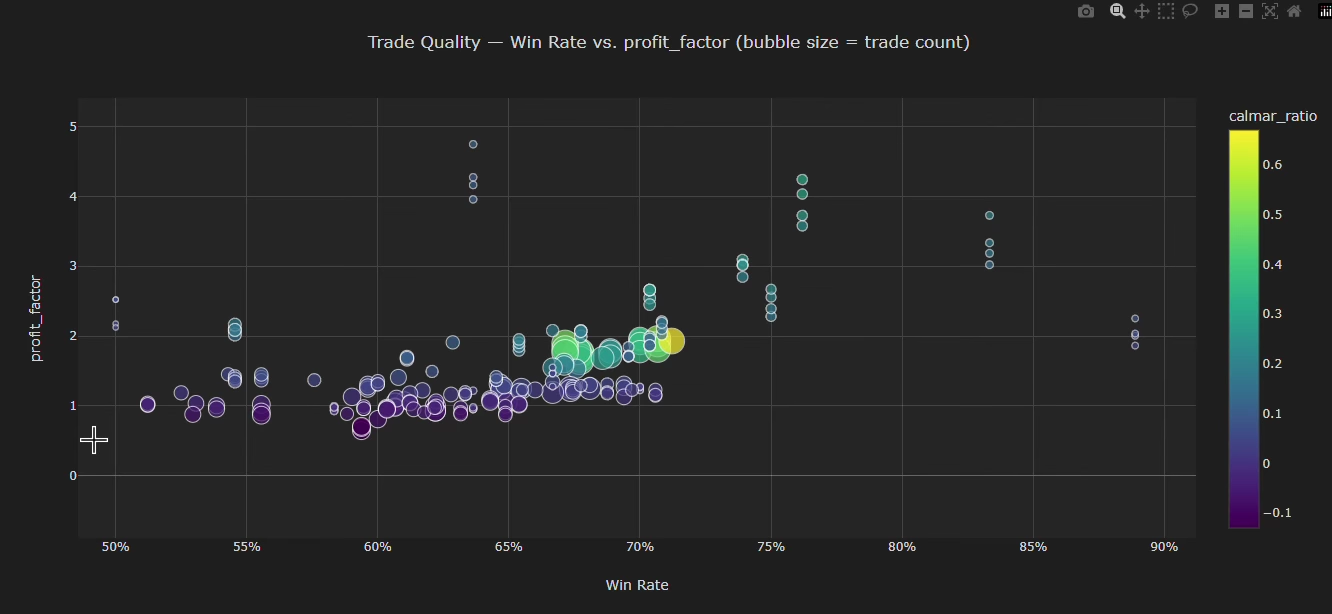
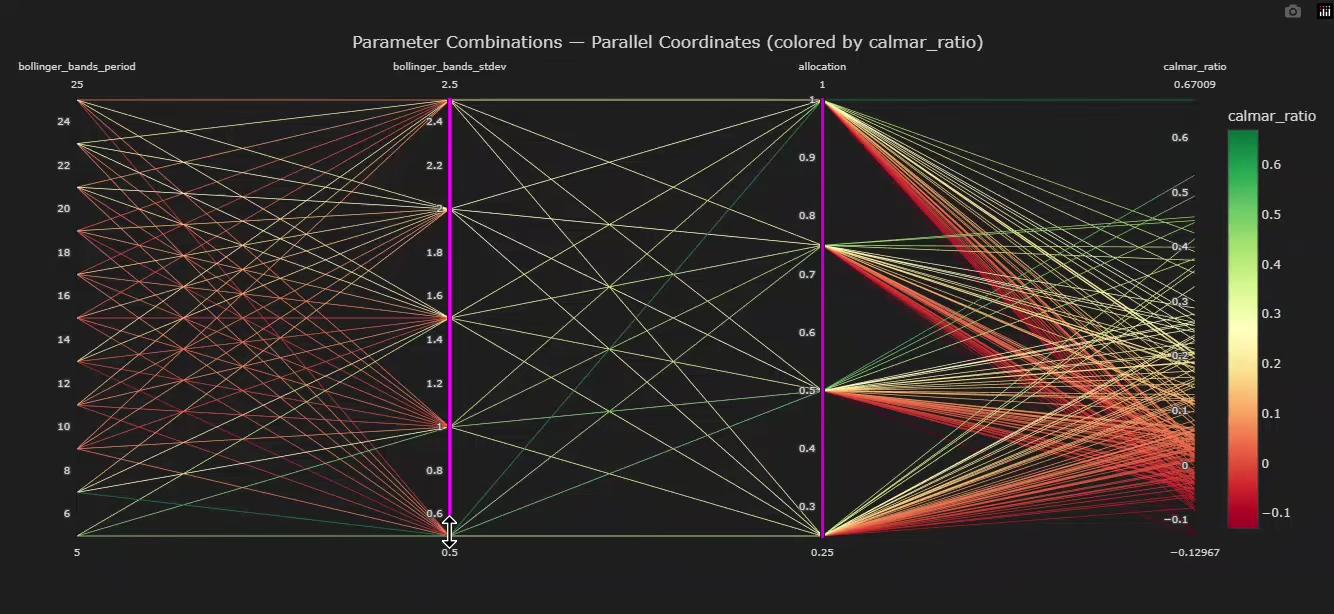
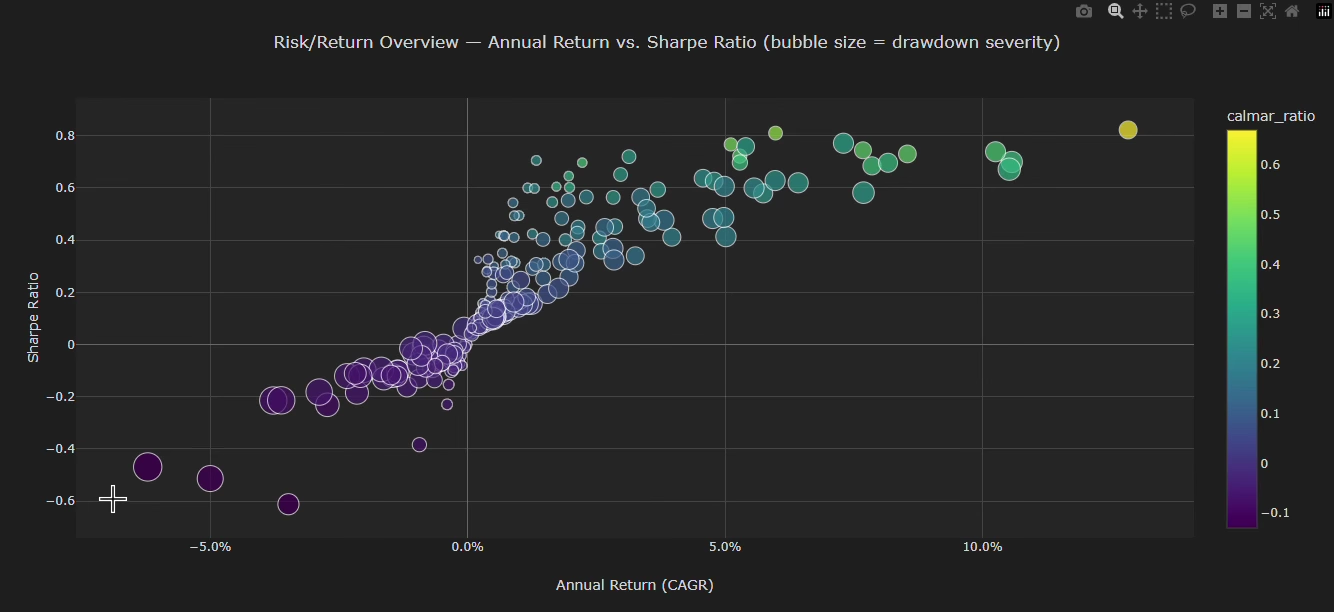
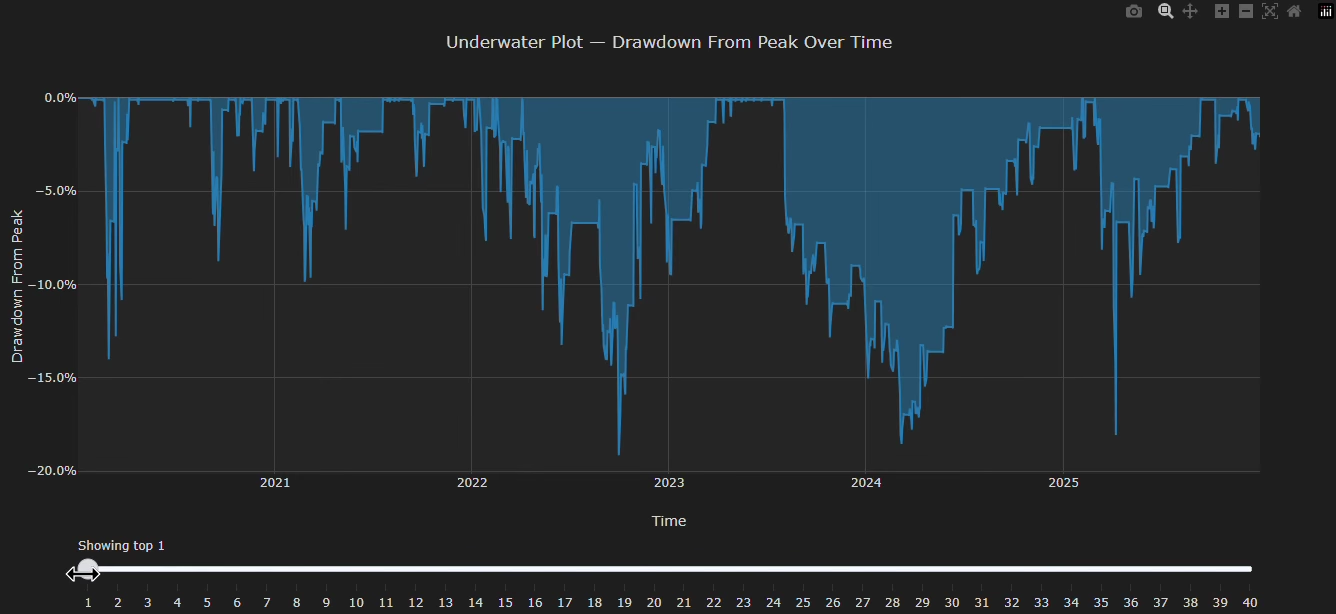
- Seven graph types - risk/return overview, parameter importance, parallel parameter combinations, pairwise heatmap grid, metric distribution, equity curve overlay, underwater drawdown, and trade quality scatter, all built to help you catch overfitting while determining the profitability and risk of your results (six of them are at the top of the README!).
Installation
Requires: Python 3.11+
pip install contango
See developer installation docs if you want to build the project without PyPI.
Quickstart
Run the demo
python -m contango.research.research_strategies.bollinger_band_mean_reversion.runner
This backtests the strategy across a grid of parameters and writes the generated graphs (as HTML files) to research/research_strategies/bollinger_band_mean_reversion/graphs/. They can be opened in the browser to explore the results - see Quickstart docs for a walkthrough of serving them locally (e.g. with the VSCode Live Server extension) if opening the files directly doesn't render them how you would expect.
Create a Strategy
class MyStrategy(Strategy):
    """
    A very simple strategy outline - not all logic is included.
    """
    def on_market_event(self, event: MarketDataEvent) -> None:
        # Strategy market logic here
        if should_buy:
            self.order_api.submit_order(event, "AAPL", quantity=3)
            self.order_api.submit_stoploss_order(event, "AAPL", quantity=-3, stoploss_price=...)
        elif should_sell:
            self.order_api.submit_order(event, "AAPL", quantity=-3)

        self.last_event = event

    def on_end(self) -> None:
        holding = self.portfolio_snapshot.position > 0

        if holding:
            self.order_api.submit_order(self.last_event, "AAPL", quantity=-self.portfolio_snapshot.position)
Run a strategy
def build_config() -> RunConfig[YfinanceConfig]:
    """
    Builds the backtest configuration for a Bollinger Band mean-reversion
    parameter sweep on AAPL daily bars, 2000-2026.
    """
    ticker = "AAPL"
    interval = Interval.DAY_1
    start = datetime(2020, 1, 1)
    end = datetime(2026, 1, 1)

    initial_cash = 1_000
    initial_position = 0
    fill_behavior = FillBehavior.INSTANT
    slippage = 0.001
    commission_per_unit = 0.0

    start_unix_ms = int(start.timestamp() * 1000)
    end_unix_ms = int(end.timestamp() * 1000)

    param_space: dict[str, list[int | float | str]] = {
        "bollinger_bands_period": list(range(5, 26, 2)),
        "bollinger_bands_stdev": [0.5, 1.0, 1.5, 2.0, 2.5],
        "allocation": [0.25, 0.5, 0.75, 1.0],
        "symbol": [ticker],
    }

    return RunConfig[YfinanceConfig](
        broker=Yfinance(NYSECalendar()),
        broker_config=YfinanceConfig(ticker, interval, start_unix_ms, end_unix_ms),
        strategy_factory=MyStrategy,
        param_space=param_space,
        initial_cash=initial_cash,
        initial_position=initial_position,
        fill_behavior=fill_behavior,
        slippage=slippage,
        commission_per_unit=commission_per_unit,
    )


if __name__ == "__main__":
    config = build_config()
    results = ResearchRunner.run(config, verbose_iterating=True)

    graph_dir = "research/research_strategies/my_strategy/graphs/"
    generate_report(results, graph_dir, rank_metric="calmar_ratio")
How it works
The codebase is divided into parts by responsibility:
-
Engine - defines events (
MarketDataEvent,OrderEvent, etc.), the event bus, theStrategybase class, and the order API. This is the shared information that every mode of trading (right now, just the backtester) uses, allowing logic to remain exactly the same between modes in the future. -
Backtester - a mode that iterates through OHLCV data and simulates fills, slippage, and commissions against a config, without touching a real broker. It currently does not support pyramiding, multiple tickers, or short trades - orders that violate that will be loudly rejected. This behavior will change in the future.
-
Brokers & calendars - historical brokers translate an external data provider's format (e.g. Yahoo Finance via
Yfinance) intoMarketDataEventinstances. Calendars define which timestamps are actually tradeable, which the data repository uses to only fetch what's missing instead of re-pulling everything. -
Optimizer - takes a strategy and a parameter space, runs the full backtest per combination (
BacktestExperimentRunner), and computes return/risk/drawdown/trade metrics for each one so that you can compare them without touching raw events yourself. See analysis docs for what each metric actually means. -
Graphing - turns those metrics into the seven generated graphs mentioned above. They're deliberately build to expose overfitting (outliers, noise, luck). Each graph exposes something entirely different, whether it be profitability, high-risk, or whether the strategy even has an edge in the first place. See graphing docs for how to read them.
Usage
See the documentation for everything not covered above - writing custom indicators, the full events reference, data repository internals, and much more.
Credits & acknowledgements
- Plotly powers all graph types.
- Historical data is sourced via Yahoo Finance.
Artificial intelligence usage
- Unit tests were developed with AI assistance - Claude Sonnet 5
- Code reviews were conducted by AI to help debug code - Claude Sonnet 5
Developers:

License
See LICENSE
Release history Release notifications | RSS feed

Download files
Download the file for your platform. If you're not sure which to choose, learn more about installing packages.
Source Distribution
Built Distribution
Filter files by name, interpreter, ABI, and platform.
If you're not sure about the file name format, learn more about wheel file names.
Copy a direct link to the current filters
File details
Details for the file contango-0.1.0.tar.gz.
File metadata
- Download URL: contango-0.1.0.tar.gz
- Upload date:
- Size: 86.3 kB
- Tags: Source
- Uploaded using Trusted Publishing? No
- Uploaded via: twine/7.0.0 CPython/3.11.15
File hashes
| Algorithm | Hash digest | |
|---|---|---|
| SHA256 |
de2711a1fb3950e76f06695c769eb87fb3cf5310c12bf7e970caa8765cca695f
|
|
| MD5 |
36d88338a52c9f067e62bb1a8081df3d
|
|
| BLAKE2b-256 |
2633f731bc2b3367e9fa5c02bc421d11619aa0ffa2753effd29c0b310882f96f
|
File details
Details for the file contango-0.1.0-py3-none-any.whl.
File metadata
- Download URL: contango-0.1.0-py3-none-any.whl
- Upload date:
- Size: 143.4 kB
- Tags: Python 3
- Uploaded using Trusted Publishing? No
- Uploaded via: twine/7.0.0 CPython/3.11.15
File hashes
| Algorithm | Hash digest | |
|---|---|---|
| SHA256 |
6ddc592c48427264abbef0fda7790f0f88db7c402b4946266343ba4733691093
|
|
| MD5 |
7771a9342450913f0b0987c3672a2b72
|
|
| BLAKE2b-256 |
7f562efbf9f22bf927556c4b25719ec5d42bda5ccfb51b4d7447f7cfb19d9e6b
|






