
corrplotpy 1.0.4




corrplotpy is a Python port of the R package
corrplot 0.95 (Wei & Simko, 2024b) on
matplotlib. corrplotpy has a Python function for each function in
corrplot, with the same argument names and defaults, and output that agrees
with R within the tolerances the Verification section reports. The one change
in syntax is that a dot in an R argument name is replaced with an underscore
in the Python implementation. The comparison document
has a style builder that writes the Python code or the R code for a plot and
shows every example of the corrplot vignette in Python and in R.
corrplot displays a correlation matrix with approximately 50 parameters,
seven symbols, four reordering algorithms, and a significance test in each
cell. matplotlib and seaborn draw a heatmap of a matrix, but neither
library draws the symbols, computes the orderings, or marks the cells that
fail a test. Two Python implementations have the corrplot name. The
Corrplot class of biokit (Cokelaer, 2021) draws eight symbols and orders by
a SciPy linkage, and the corrplot function of Louridas (2013) draws
ellipses and blanks cells by a p-value threshold. Neither implementation
follows the R argument list or reports agreement with R output, so switching
an analysis pipeline from R to Python has required writing the plot again,
and the new plot did not have the same formatting.
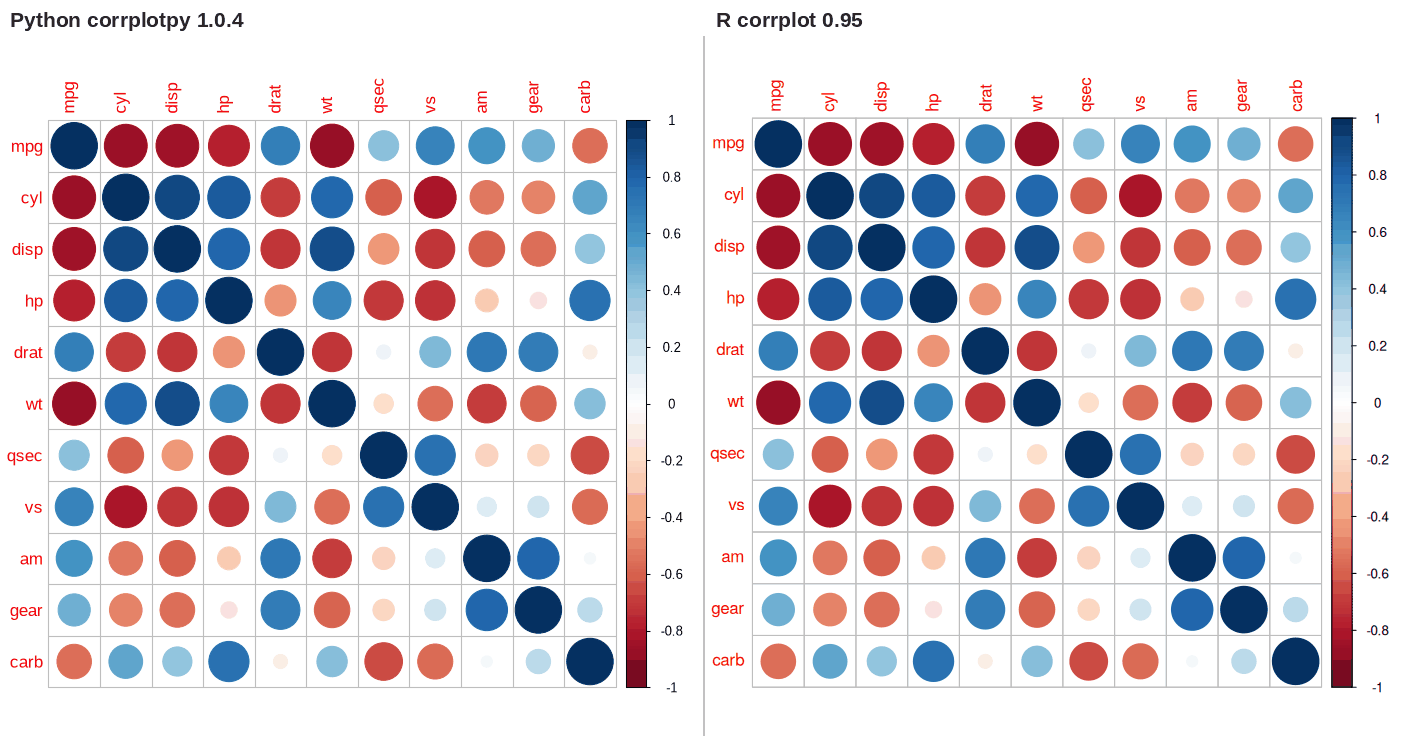
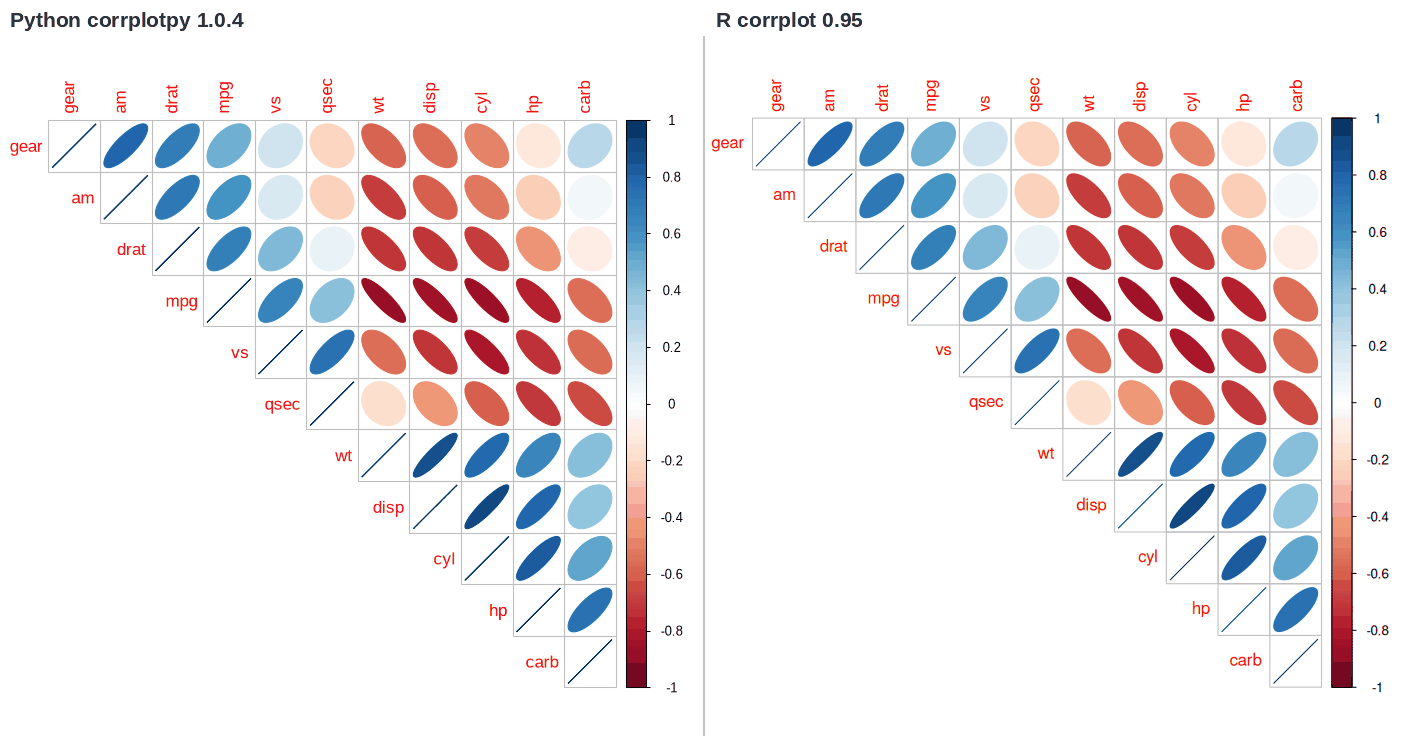
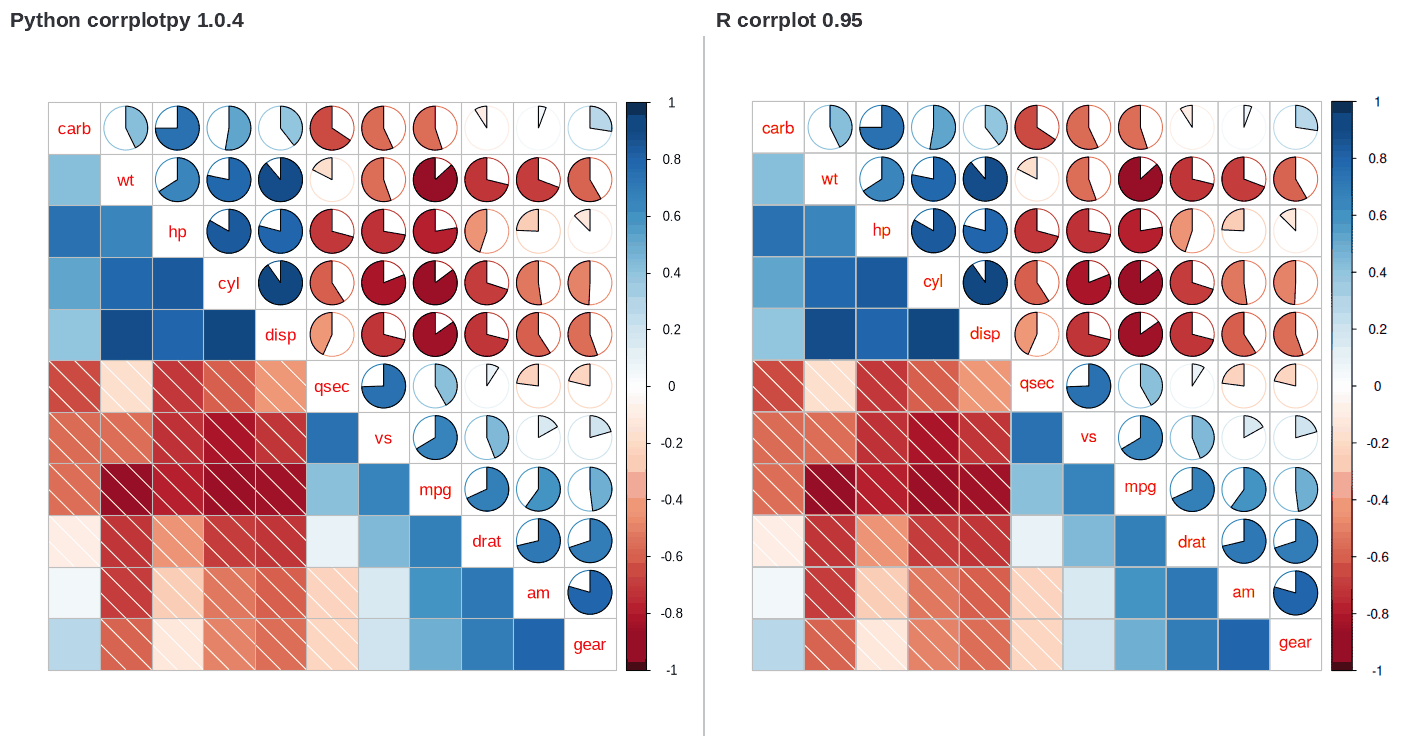
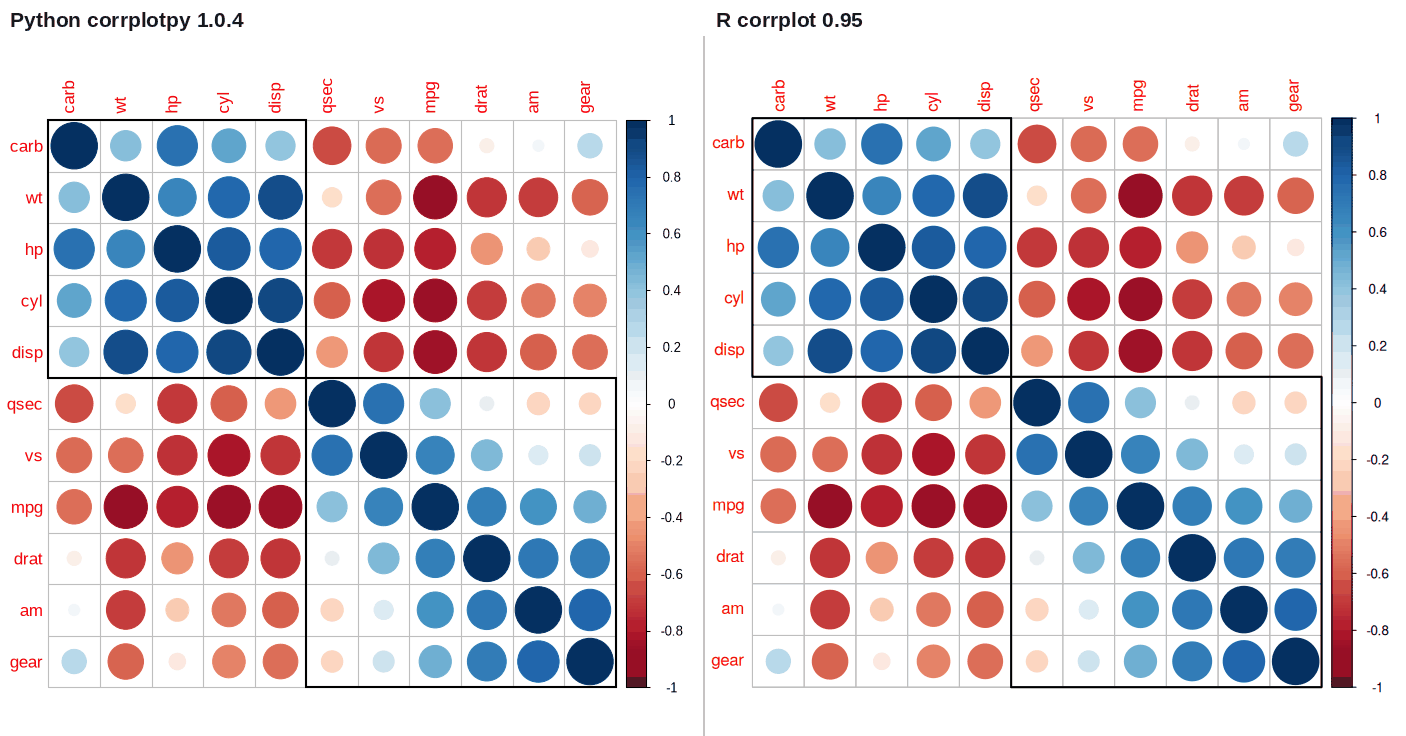
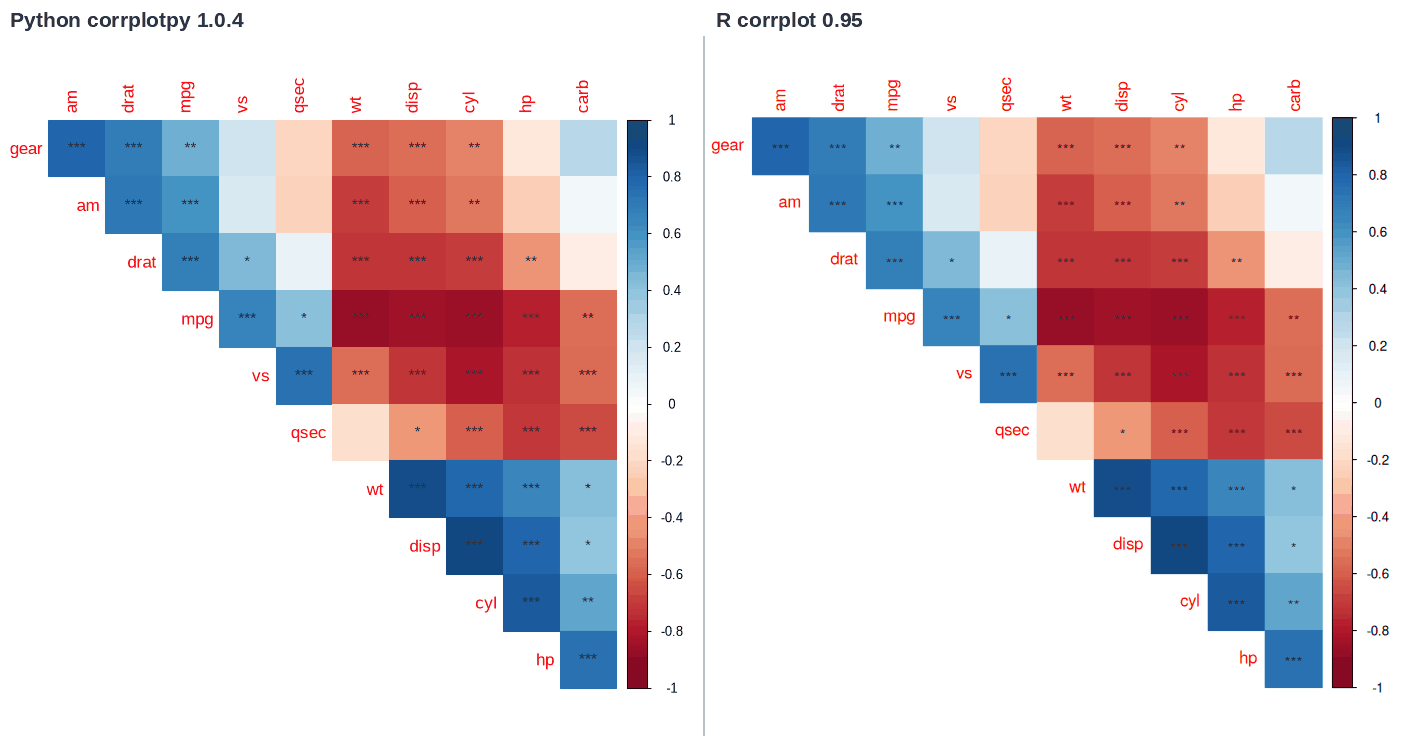
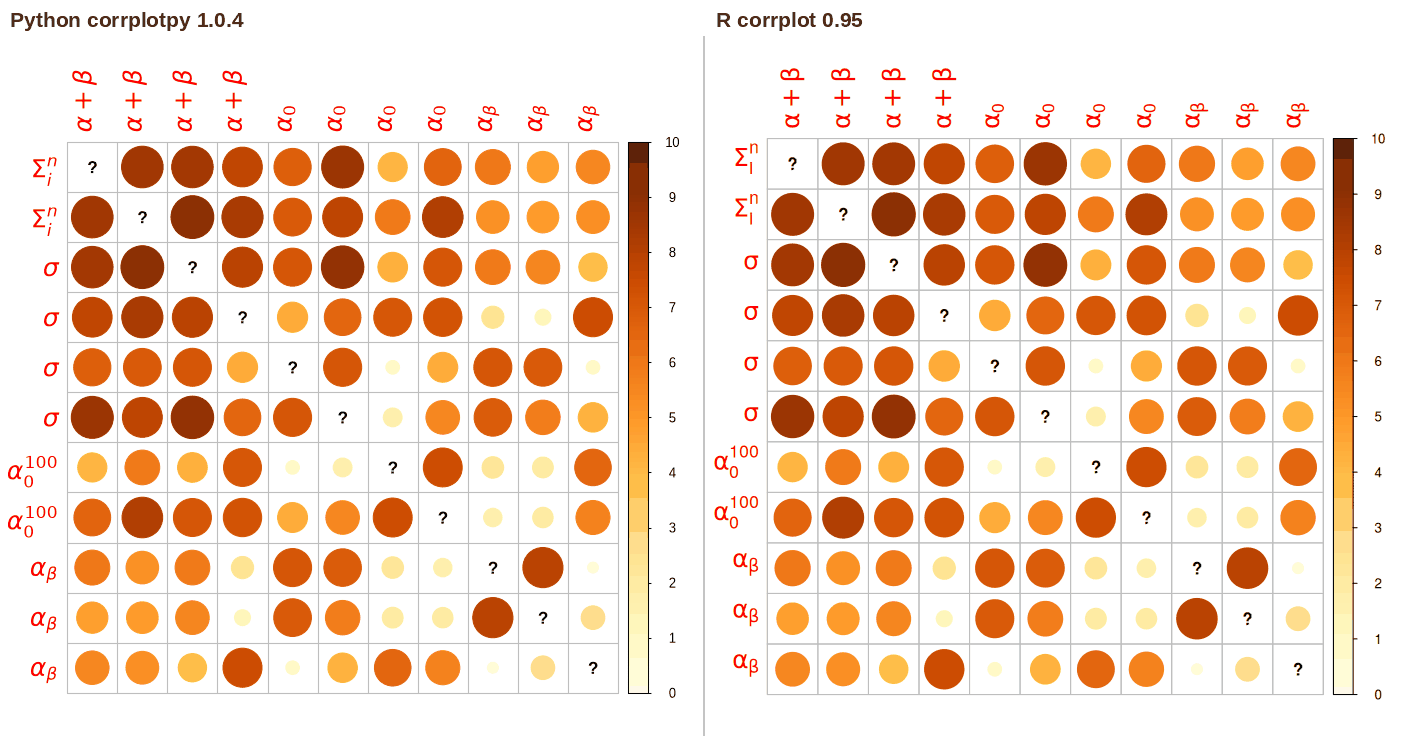
Every example in the comparison document was run in both languages at the same figure size, 7 by 7 inches at 100 dpi with a 12 point font. The comparison script placed the two plots side by side, added the labels and the divider, and reduced the combined PNG to a 192-color palette; neither plot was retouched or rescaled. The cell table each call returns was compared as well; the Verification section below reports the recorded agreement.
Install
pip install corrplotpy
The development version installs from the repository with
pip install git+https://github.com/rowanterra/corrplotpy.git, and a clone
installs with pip install -e ..
Dependencies: numpy 1.24 or later, scipy 1.10 or later, pandas 2.0 or later, and matplotlib 3.7 or later; CI tests those floors and the current releases.
Translating R code
Replace each dot in an argument name with an underscore.
| Python | R |
|---|---|
corrplot(M, method='ellipse') |
corrplot(M, method = 'ellipse') |
corrplot(M, tl_col='black') |
corrplot(M, tl.col = 'black') |
corrplot(M, p_mat=p, sig_level=0.01) |
corrplot(M, p.mat = p, sig.level = 0.01) |
corrplot(M, addCoef_col='grey20') |
corrplot(M, addCoef.col = 'grey20') |
corrplot_mixed(M, lower='number') |
corrplot.mixed(M, lower = 'number') |
cor_mtest(mtcars())['p'] |
cor.mtest(mtcars)$p |
res.corrPos |
res$corrPos |
R finds an argument name from a prefix, but Python does not. Write plotCI
and lowCI_mat in full, not plotC and lowCI.
corrplotpy provides nine corrplot-compatible entry points, one for each
public function of the R package, together with Python-specific helpers
(cor_test, color_ramp_palette, plotmath_to_mathtext, mtcars, and the
CorrplotResult class).
| Python | R | Function |
|---|---|---|
corrplot |
corrplot |
show a correlation matrix |
corrplot_mixed |
corrplot.mixed |
a different symbol in each half |
cor_mtest |
cor.mtest |
p-values and confidence limits |
corrMatOrder |
corrMatOrder |
AOE, FPC, hclust, and alphabet sequences |
corrRect |
corrRect |
rectangles by index, name, or corners |
corrRect_hclust |
corrRect.hclust |
rectangles around the clusters |
colorlegend |
colorlegend |
a color bar without a matrix |
COL1 |
COL1 |
sequential palettes |
COL2 |
COL2 |
diverging palettes |
compare/check_api.py reads the R argument list with formals() and compares
it with the Python signatures. The full table is in
docs/api_mapping.md.
Quick start
| Python | R |
|---|---|
from corrplotpy import (corrplot, corrplot_mixed, corrMatOrder,
                        corrRect, corrRect_hclust, colorlegend,
                        cor_mtest, COL1, COL2, mtcars)

M = mtcars().corr()
testRes = cor_mtest(mtcars(), conf_level=0.95)

corrplot(M, method='ellipse', order='AOE')
|
library(corrplot)
data(mtcars)
M <- cor(mtcars)
testRes <- cor.mtest(mtcars, conf.level = 0.95)

corrplot(M, method = 'ellipse', order = 'AOE')
|
corrplot() returns the three objects that R returns (.corr, the matrix in
the new order; .corrPos, one row for each cell; and .arg) together with
the matplotlib .fig and .ax and the .canvas that draws on the axes.
res.save('plot.png') writes the figure, with
options for format, resolution, size, and transparency; res.fig.savefig() is
the raw matplotlib call underneath.
Documentation
docs/comparison.html has two tabs. The first tab
shows how to use corrplotpy. A style builder writes the code for a plot (the
controls set the parameters, the preview shows the result, and the page writes
the Python code or the R code for that plot), and an anatomy figure numbers
each part of a corrplot with the parameter that changes that part. In the
second tab, the same examples are shown in Python and in R, to show that the
two packages agree for those examples. The examples come from the corrplot
vignette (Wei & Simko, 2024a), An Introduction to corrplot
Package.
A vignette is the long-form documentation that an R package contains.
docs/citation_audit.xlsx has one row for each reference in the document: the sentence that cites it, the full reference, the source consulted, a quote from it, and the verification status.
Examples
Six of the 40 pairs from the comparison document, which follows the corrplot vignette section by section. corrplotpy drew the left figure and R drew the right figure.
The default symbol
| Python | R |
|---|---|
corrplot(M) # by default, method='circle'
|
corrplot(M) # by default, method = 'circle'
|
Ellipses, upper triangle, AOE sequence
| Python | R |
|---|---|
corrplot(M, method='ellipse', order='AOE', type='upper')
|
corrplot(M, method = 'ellipse', order = 'AOE', type = 'upper')
|
A different symbol in each half
| Python | R |
|---|---|
corrplot_mixed(M, lower='shade', upper='pie', order='hclust')
|
corrplot.mixed(M, lower = 'shade', upper = 'pie', order = 'hclust')
|
Hierarchical sequence with cluster rectangles
| Python | R |
|---|---|
corrplot(M, order='hclust', addrect=2)
|
corrplot(M, order = 'hclust', addrect = 2)
|
Stars at three significance levels
| Python | R |
|---|---|
## add significant level stars
corrplot(M, p_mat=testRes['p'], method='color', diag=False,
         type='upper', sig_level=[0.001, 0.01, 0.05],
         pch_cex=0.9, insig='label_sig', pch_col='grey20',
         order='AOE')
|
## add significant level stars
corrplot(M, p.mat = testRes$p, method = 'color', diag = FALSE,
         type = 'upper', sig.level = c(0.001, 0.01, 0.05),
         pch.cex = 0.9, insig = 'label_sig', pch.col = 'grey20',
         order = 'AOE')
|
A matrix that is not a correlation matrix, with plotmath labels
| Python | R |
|---|---|
M2 = M.copy()
values = M2.values.copy()
np.fill_diagonal(values, np.nan)
M2 = pd.DataFrame(
    10 * np.abs(values),
    index=['$Sigma[i]^n']*2 + ['$sigma']*4 + ['$alpha[0]^100']*2
          + ['$alpha[beta]']*3,
    columns=['$alpha+beta']*4 + ['$alpha[0]']*4 + ['$alpha[beta]']*3)
corrplot(M2, is_corr=False, col_lim=(0, 10), tl_cex=1.5)
|
M2 <- M
diag(M2) <- NA
colnames(M2) <- rep(c('$alpha+beta', '$alpha[0]', '$alpha[beta]'),
                    c(4, 4, 3))
rownames(M2) <- rep(c('$Sigma[i]^n', '$sigma', '$alpha[0]^100',
                      '$alpha[beta]'), c(2, 4, 2, 3))
corrplot(10*abs(M2), is.corr = FALSE, col.lim = c(0, 10), tl.cex = 1.5)
|
Verification
Every number below comes from a file that a comparison script wrote with
R version 4.3.3 and corrplot 0.95 on 2026-09-03. The platform, locale,
and BLAS/LAPACK libraries are in docs/r_environment.json, and the scripts
stop if another corrplot version is loaded.
compare/run_vignette.py renders each figure of the comparison document in
both languages and compares the cell table for each example that returns one.
32 of the 40 figures return a table, and
32 of 32 agree, largest difference 5.1e-15
(docs/vignette_parity.json). The scripts do not compare the other
8 figures. Six end in a legend, rectangles, or text drawn
on an existing plot and return no table, and the ordering of the other two
comes from the seriation package.
compare/compare_values.py does the same for a second set of 24
examples: 24 of 24 agree, largest difference
7.8e-16 (docs/examples_parity.json).
compare/compare_tests.py runs cor_test() against R's cor.test() over
594 cases: sample sizes 5 to 100, three methods, three
alternatives, exact and asymptotic, with and without ties, with and without
the continuity correction. 594 of 594 agree within
1.0e-12; the largest p-value difference is 6.8e-14 and the
largest estimate difference is 8.9e-16 (docs/tests_parity.json).
compare/check_api.py reads each R argument list with formals() and compares
it with the Python signature: 90 named arguments, all present with
the same default; the 5 dots arguments become explicit keywords
(docs/api_mapping.md).
The 252 tests in tests/ use values recorded from R and do not need R;
252 of 252 passed in the run that wrote this file.
They cover palettes color by color, the linkages against R's leaf order,
p-values and statistics from the three test methods including ties and the
continuity correction, cell tables, symbol dimensions, input validation, the
save() method, and the code the style builder generates, which one test runs
through the package.
Five details required explicit handling to agree with R.
COL2('RdBu', 200) returns the 200 color codes that R returns because the
port truncates each channel where R truncates it, and rounding instead would
change many of the codes. With n palette colors numbered from 1 as in R, the
cell for r takes color min(n, floor((r + 1) / 2 * n) + 1).
The linkages of hclust needed a transform. R applies the Lance-Williams
equation to the distances for ward.D, median, and centroid; SciPy squares
the distances first. corrplotpy hands SciPy the square root of the distance for
those three, which reproduces R's merge sequence on the test matrices. R
accepts nine linkage names, of which ward and ward.D select the same
method.
cor_test follows R's cor.test. Pearson uses R's t statistic and Fisher z
interval. Kendall uses R's exact distribution below n = 50 without ties and
R's tie-corrected z statistic otherwise, with the continuity correction R
applies. Spearman uses exact enumeration through n = 9, the Edgeworth series
of Best and Roberts (1975) for 10 <= n <= 1290, and the t approximation above
that.
Symbol geometry is R's: radius 0.9 * sqrt(|r|) / 2 for the circle, side
sqrt(|r|) for the square, 99 points for the ellipse, R's angle and point
count for the pie, and R's dimensions for the marks on cells that fail the
test. R's pch symbols map to the nearest matplotlib markers.
Layout depends on text measurement. corrplotpy measures text in a
Helvetica-metric font, which is what the R device measures with, and the
comparisons here were rendered with Liberation Sans on both sides. corrplotpy
also widens the coordinate range to fill the plot area, as
plot.window(asp = 1) does. The font fallback is described under Differences
from R.
Differences from R
The AOE and FPC sequences can come out reversed. Both use the signs of the
first two eigenvectors, and LAPACK leaves those signs arbitrary, so the result
depends on the LAPACK build, in R as well. The default eigen_sign='lapack'
takes the signs LAPACK returns, as R does, and agreed with R in the recorded
environment. eigen_sign='max_abs' normalizes the signs, which removes the
reversal; a matrix with repeated eigenvalues can still order differently.
plotmath is translated to matplotlib mathtext, within limits. A label that
starts with :, =, or $ is treated as an R plotmath expression, and
corrplotpy.plotmath handles Greek names, subscripts, superscripts, sqrt,
frac, the font functions, and the usual operators. Other expressions stay as
plain text.
Python has no equivalent of R's dots argument. corrplotpy takes a keyword
argument for each parameter, and graphical parameters do not pass through to
text() or title(). Python also does not complete an argument name or an
argument value from a prefix, where R's match.arg accepts 'ell' for
'ellipse', so plotC becomes plotCI, lowCI becomes lowCI_mat, and
method='ellipse' is spelled out.
corrMatOrder always returns zero-based positions. For order='alphabet', R
returns names. The alphabetical order follows Python's string comparison; R's
follows the locale.
Text layout depends on the installed fonts. corrplotpy prefers a font with Helvetica metrics and takes the first it finds from Nimbus Sans, Helvetica, Arial, Liberation Sans, and FreeSans. Without one of those it falls back to an installed sans-serif font, usually DejaVu Sans, which is wider, so the space around the labels changes.
R's pch symbols are drawn with the nearest matplotlib marker, and text with
an adj value other than 0, 0.5, and 1 is centered. Both are close
approximations of the R output.
Rebuilding the comparison
R with corrplot 0.95 is necessary, and the seriation package for one section of the comparison document.
python compare/run_vignette.py     # make the figures of the document
python compare/compare_values.py   # compare the second example set
python compare/check_api.py --markdown docs/api_mapping.md
python compare/make_docs.py        # make this file and the document
pytest                             # R is not necessary
Releasing
Bump __version__ in corrplotpy/__init__.py and the version in
CITATION.cff, add a section to CHANGELOG.md, and rerun the three
comparison scripts with R so that the recorded evidence names the new
version (a test checks that docs/tests_parity.json was written by the
released version). Then run python compare/make_docs.py and publish a
GitHub release tagged vX.Y.Z. The publish workflow runs the checks in
docs/checks.md, builds the wheel and the sdist, and
uploads them to PyPI through trusted publishing, so no token is stored in
the repository. The sdist contains the package and the tests but not docs/ or
compare/, so the tests that read the comparison assets skip there.
THIRD_PARTY_NOTICES.md has the notices for the
stylesheet of the comparison document.
Citation
Terra, R. R. (2026). corrplotpy: Visualization of a correlation matrix in Python with a style builder (Version 1.0.4) [Computer software]. https://github.com/rowanterra/corrplotpy
@Manual{corrplotpy,
  title  = {corrplotpy: Visualization of a Correlation Matrix in Python with a Style Builder},
  author = {Rowan R. Terra},
  year   = {2026},
  note   = {Version 1.0.4},
  url    = {https://github.com/rowanterra/corrplotpy}
}
CITATION.cff has the same citation in the format GitHub reads. Please
also cite Wei and Simko (2024) for the R package where applicable.
License and credit
corrplotpy is a port of corrplot by Taiyun Wei and Viliam Simko (Wei & Simko, 2024b), with work
from Michael Levy, Yihui Xie, Yan Jin, Jeff Zemla, Moritz Freidank, Jun Cai,
and Tomas Protivinsky. The R package is MIT licensed and is at
github.com/taiyun/corrplot. corrplotpy
has the same license and keeps the original copyright notice with its own.
corrplotpy is not an official part of the R package.
The ellipse comes from the work of Murdoch and Chow (1996). The pie and the shade come from the work of Friendly (2002). The R package records the same credit.
The example data is mtcars (Henderson & Velleman, 1981) from R, so both
languages use the same numbers. Two examples use the Zoo data set (Forsyth,
1990) from the seriation package.
Claude (Anthropic, 2026a, 2026b), in sessions configured as Opus 5 and Fable 5.1, was used to audit and assist with the preparation of this package.
References
- Anderson, E., Bai, Z., Bischof, C., Blackford, S., Demmel, J., Dongarra, J., Du Croz, J., Greenbaum, A., Hammarling, S., McKenney, A., & Sorensen, D. (1999). LAPACK users' guide (3rd ed.). Society for Industrial and Applied Mathematics. https://netlib.org/lapack/lug/lapack_lug.html
- Anthropic. (2026a). Claude Fable 5.1 [Large language model]. https://www.anthropic.com/claude-fable-and-mythos-5-1
- Anthropic. (2026b). Claude Opus 5 [Large language model]. https://www.anthropic.com/news/claude-opus-5
- Bar-Joseph, Z., Gifford, D. K., & Jaakkola, T. S. (2001). Fast optimal leaf ordering for hierarchical clustering. Bioinformatics, 17(Suppl. 1), S22-S29. https://doi.org/10.1093/bioinformatics/17.suppl_1.S22
- Best, D. J., & Roberts, D. E. (1975). Algorithm AS 89: The upper tail probabilities of Spearman's rho. Journal of the Royal Statistical Society. Series C (Applied Statistics), 24(3), 377-379. https://doi.org/10.2307/2347111
- Cokelaer, T. (2021). biokit: Set of tools related to bioinformatics (Version 0.5.0) [Computer software]. https://github.com/biokit/biokit
- Forsyth, R. (1990). Zoo [Data set]. UCI Machine Learning Repository. https://doi.org/10.24432/C5R59V
- Friendly, M. (2002). Corrgrams: Exploratory displays for correlation matrices. The American Statistician, 56(4), 316-324. https://doi.org/10.1198/000313002533
- Hahsler, M., Hornik, K., & Buchta, C. (2008). Getting things in order: An introduction to the R package seriation. Journal of Statistical Software, 25(3), 1-34. https://doi.org/10.18637/jss.v025.i03
- Harris, C. R., Millman, K. J., van der Walt, S. J., Gommers, R., Virtanen, P., Cournapeau, D., Wieser, E., Taylor, J., Berg, S., Smith, N. J., Kern, R., Picus, M., Hoyer, S., van Kerkwijk, M. H., Brett, M., Haldane, A., del Rio, J. F., Wiebe, M., Peterson, P., ... Oliphant, T. E. (2020). Array programming with NumPy. Nature, 585(7825), 357-362. https://doi.org/10.1038/s41586-020-2649-2
- Harrower, M., & Brewer, C. A. (2003). ColorBrewer.org: An online tool for selecting colour schemes for maps. The Cartographic Journal, 40(1), 27-37. https://doi.org/10.1179/000870403235002042
- Henderson, H. V., & Velleman, P. F. (1981). Building multiple regression models interactively. Biometrics, 37, 391-411.
- Hollander, M., & Wolfe, D. A. (1973). Nonparametric statistical methods. John Wiley & Sons.
- Hunter, J. D. (2007). Matplotlib: A 2D graphics environment. Computing in Science & Engineering, 9(3), 90-95. https://doi.org/10.1109/MCSE.2007.55
- Kendall, M. G. (1938). A new measure of rank correlation. Biometrika, 30(1-2), 81-93. https://doi.org/10.1093/biomet/30.1-2.81
- Louridas, P. (2013). corrplot: Create a correlation plot, as in the corrplot R package [Computer software]. https://github.com/louridas/corrplot
- McKinney, W. (2010). Data structures for statistical computing in Python. In S. van der Walt & J. Millman (Eds.), Proceedings of the 9th Python in Science Conference (pp. 56-61). https://doi.org/10.25080/Majora-92bf1922-00a
- Murdoch, D. J., & Chow, E. D. (1996). A graphical display of large correlation matrices. The American Statistician, 50(2), 178-180. https://doi.org/10.1080/00031305.1996.10474371
- Murtagh, F., & Legendre, P. (2014). Ward's hierarchical agglomerative clustering method: Which algorithms implement Ward's criterion? Journal of Classification, 31(3), 274-295. https://doi.org/10.1007/s00357-014-9161-z
- Nuñez, J. R., Anderton, C. R., & Renslow, R. S. (2018). Optimizing colormaps with consideration for color vision deficiency to enable accurate interpretation of scientific data. PLOS ONE, 13(7), Article e0199239. https://doi.org/10.1371/journal.pone.0199239
- Qiu, Y. (2021). prettydoc: Creating pretty documents from R Markdown (Version 0.4.1) [Computer software]. https://CRAN.R-project.org/package=prettydoc
- R Core Team. (2024). R: A language and environment for statistical computing (Version 4.3.3) [Computer software]. R Foundation for Statistical Computing. https://www.R-project.org/
- Virtanen, P., Gommers, R., Oliphant, T. E., Haberland, M., Reddy, T., Cournapeau, D., Burovski, E., Peterson, P., Weckesser, W., Bright, J., van der Walt, S. J., Brett, M., Wilson, J., Millman, K. J., Mayorov, N., Nelson, A. R. J., Jones, E., Kern, R., Larson, E., ... SciPy 1.0 Contributors. (2020). SciPy 1.0: Fundamental algorithms for scientific computing in Python. Nature Methods, 17(3), 261-272. https://doi.org/10.1038/s41592-019-0686-2
- Wei, T., & Simko, V. (2024a). An introduction to corrplot package [Package vignette]. In R package 'corrplot' (Version 0.95). https://cran.r-project.org/web/packages/corrplot/vignettes/corrplot-intro.html
- Wei, T., & Simko, V. (2024b). R package 'corrplot': Visualization of a correlation matrix (Version 0.95) [Computer software]. https://github.com/taiyun/corrplot
1 maintainer

Download files
Download the file for your platform. If you're not sure which to choose, learn more about installing packages.
Source Distribution
Built Distribution
Filter files by name, interpreter, ABI, and platform.
If you're not sure about the file name format, learn more about wheel file names.
Copy a direct link to the current filters
File details
Details for the file corrplotpy-1.0.4.tar.gz.
File metadata
- Download URL: corrplotpy-1.0.4.tar.gz
- Upload date:
- Size: 115.2 kB
- Tags: Source
- Uploaded using Trusted Publishing? Yes
- Uploaded via:
twine/7.0.0 CPython/3.13.14
File hashes
| Algorithm | Hash digest | |
|---|---|---|
| SHA256 |
910b18180327613024b63bc44850c2821b83cc3401f295da0a3778f3ff1d7374
|
|
| MD5 |
d118267afe13dec791b4ae4dfafe9eec
|
|
| BLAKE2b-256 |
f31b8ebfb03b55a9d9ee60a062175676b9401271d9cfc46c53cfa18de2ae122a
|
Provenance
The following attestation bundles were made for corrplotpy-1.0.4.tar.gz:
Publisher:
publish.yml on rowanterra/corrplotpy
-
Statement:
-
Statement type:
https://in-toto.io/Statement/v1 -
Predicate type:
https://docs.pypi.org/attestations/publish/v1 -
Subject name:
corrplotpy-1.0.4.tar.gz -
Subject digest:
910b18180327613024b63bc44850c2821b83cc3401f295da0a3778f3ff1d7374 - Sigstore transparency entry: 2703499965
- Sigstore integration time:
-
Permalink:
rowanterra/corrplotpy@e143c375733f09855ae0fb4ef90f78383f02258f -
Branch / Tag:
refs/tags/v1.0.4 - Owner: https://github.com/rowanterra
-
Access:
public
-
Token Issuer:
https://token.actions.githubusercontent.com -
Runner Environment:
github-hosted -
Publication workflow:
publish.yml@e143c375733f09855ae0fb4ef90f78383f02258f -
Trigger Event:
release
-
Statement type:
File details
Details for the file corrplotpy-1.0.4-py3-none-any.whl.
File metadata
- Download URL: corrplotpy-1.0.4-py3-none-any.whl
- Upload date:
- Size: 69.0 kB
- Tags: Python 3
- Uploaded using Trusted Publishing? Yes
- Uploaded via:
twine/7.0.0 CPython/3.13.14
File hashes
| Algorithm | Hash digest | |
|---|---|---|
| SHA256 |
18c084b703bd7c62fd86244f140a3a15d9f0824dc4eb728a1ea4b7706231ccfc
|
|
| MD5 |
00a3fbc7f477d96a009b866e6d890c34
|
|
| BLAKE2b-256 |
cb7f00616c7b74666017452a3314caf2de35a5fc38653e96cbafb186ea5d90d1
|
Provenance
The following attestation bundles were made for corrplotpy-1.0.4-py3-none-any.whl:
Publisher:
publish.yml on rowanterra/corrplotpy
-
Statement:
-
Statement type:
https://in-toto.io/Statement/v1 -
Predicate type:
https://docs.pypi.org/attestations/publish/v1 -
Subject name:
corrplotpy-1.0.4-py3-none-any.whl -
Subject digest:
18c084b703bd7c62fd86244f140a3a15d9f0824dc4eb728a1ea4b7706231ccfc - Sigstore transparency entry: 2703500657
- Sigstore integration time:
-
Permalink:
rowanterra/corrplotpy@e143c375733f09855ae0fb4ef90f78383f02258f -
Branch / Tag:
refs/tags/v1.0.4 - Owner: https://github.com/rowanterra
-
Access:
public
-
Token Issuer:
https://token.actions.githubusercontent.com -
Runner Environment:
github-hosted -
Publication workflow:
publish.yml@e143c375733f09855ae0fb4ef90f78383f02258f -
Trigger Event:
release
-
Statement type:














