Visualize large-scale network graphs and machine learning embeddings


Project description
Cosmograph
The Cosmograph Widget brings the power of Cosmograph's GPU-accelerated force layout graph visualization right into your Jupyter notebooks. Built on top of Anywidget, this widget provides a seamless, interactive graph exploration experience directly within your data science workflow, making it easier than ever to visualize complex data relationships and embeddings.
✨ Key Features
- Interactive Visualization: Pan, zoom, select, and hover to explore large, complex network graphs right in your notebook.
- GPU-Acceleration: Powered by @cosmograph/cosmos, it delivers smooth interactions and rapid rendering of large-scale graphs.
- Seamless Integration: Embeds naturally into Jupyter notebooks, JupyterLab, and other notebook-based environments.
- Rich Configuration API: Fine-tune graph appearance, behavior, and layout parameters through easy-to-use Python APIs.
🚀 Installation
Note: You'll need python 3.10 or greater.
To install the Cosmograph widget, simply run:
pip install cosmograph
Once installed, you can start using it in your notebooks immediately.

🛠️ Quick Start
After installation, you can import and use the widget in any Python-based notebook environment:
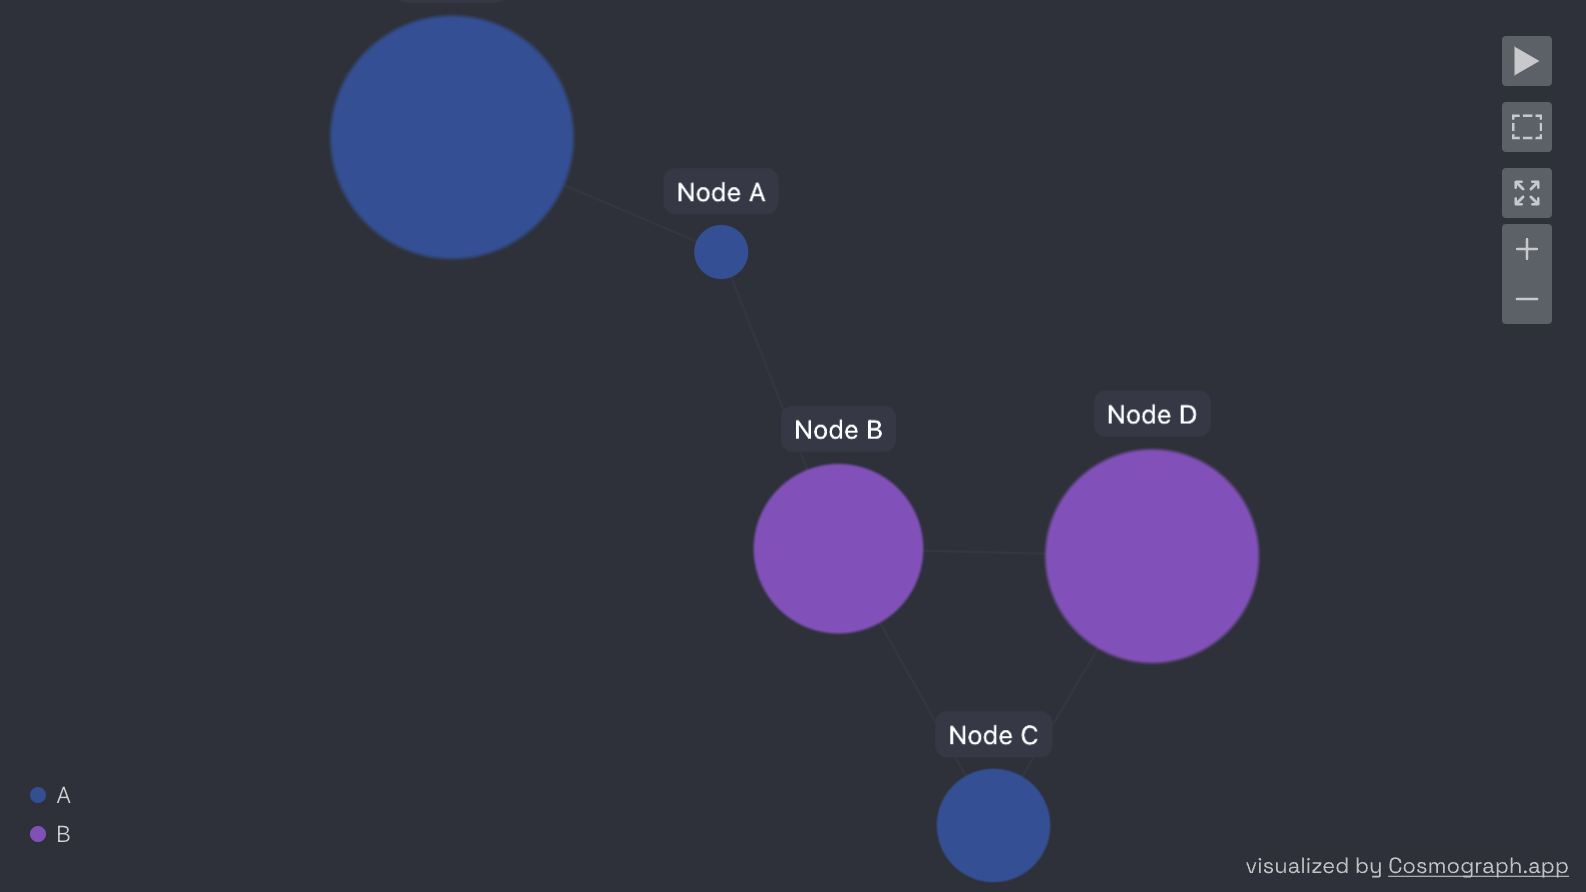
Tiny example
import pandas as pd
from cosmograph import cosmo

points = pd.DataFrame({
    'id': [1, 2, 3, 4, 5],
    'label': ['Node A', 'Node B', 'Node C', 'Node D', 'Node E'],
    'value': [10, 20, 15, 25, 30],
    'category': ['A', 'B', 'A', 'B', 'A']
})

links = pd.DataFrame({
    'source': [1, 2, 3, 1, 2],
    'target': [2, 3, 4, 5, 4],
    'value': [1.0, 2.0, 1.5, 0.5, 1.8]
})

widget = cosmo(
  points=points,
  links=links,
  point_id_by='id',
  link_source_by='source',
  link_target_by='target',
  point_color_by='category',
  point_label_by='label',
  point_size_by='value'
)
widget
The widget will render an interactive graph visualization inline, allowing you to explore and manipulate your data directly.
You also use the widget object to interact with the rendered graph.
widget.fit_view()  # recenter the view (often useful when you've lost your graph (or within your graph)
widget.selected_point_ids  # if you've selected some points and want to get info about the selection...
# etc.
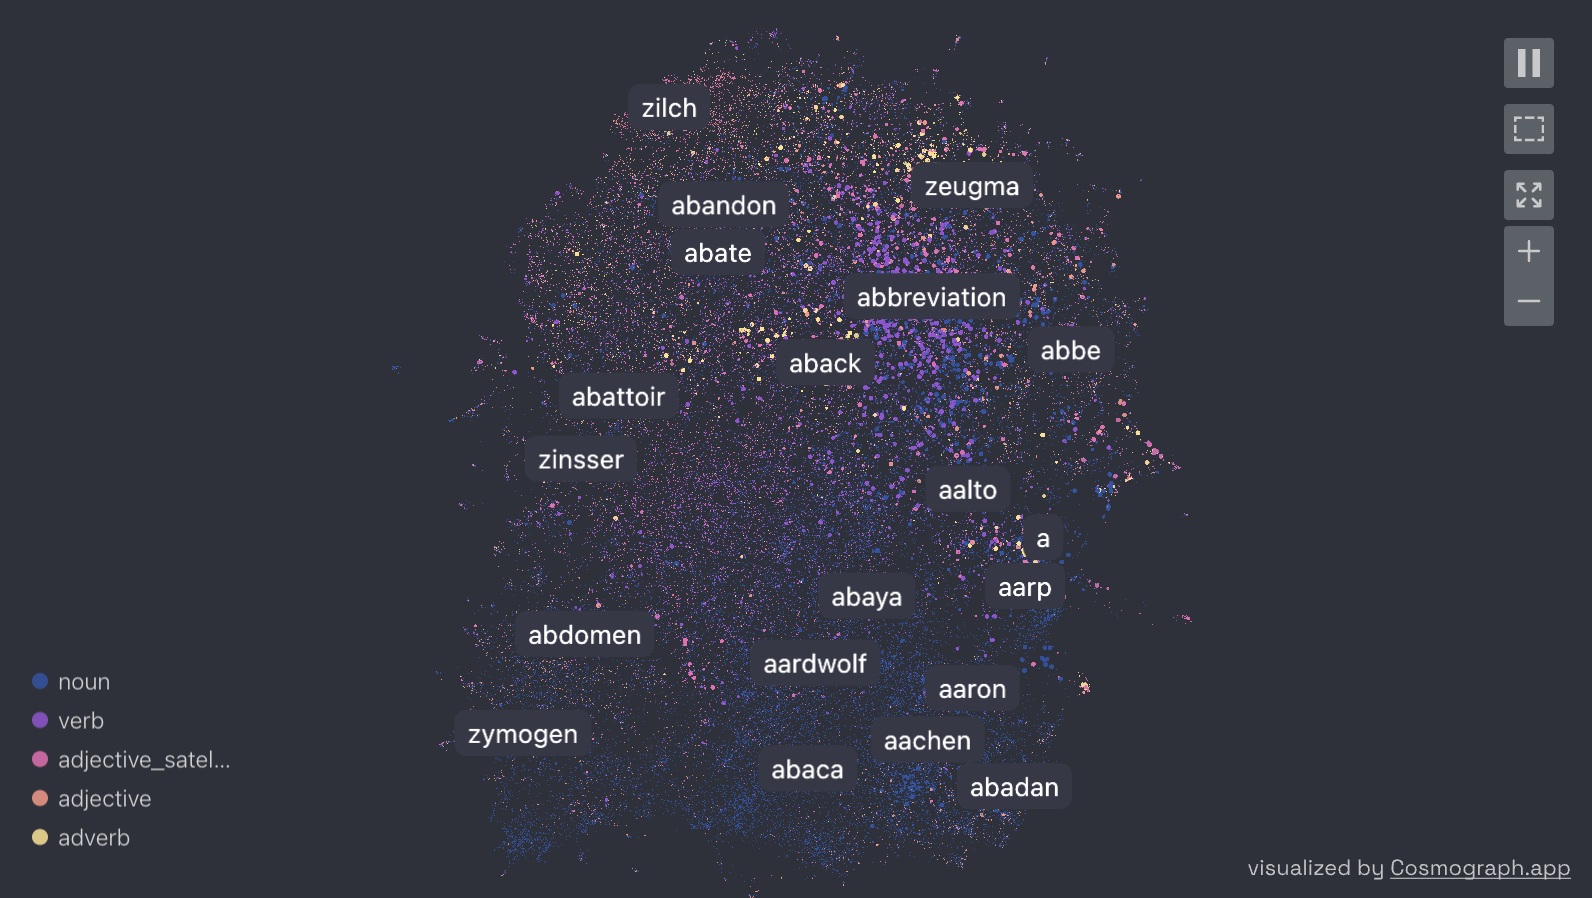
Nicer example
Let's download a big dataset of English words, plus some hyponym-hypernym relationships. (A hyponym-hypernym relationship is a “type-of” relationship where a hyponym is a more specific term (e.g., “dog”) and a hypernym is a broader term (e.g., “animal”).)
import pandas as pd
from cosmograph import cosmo

df = pd.read_parquet('https://www.dropbox.com/scl/fi/4mnk1e2wx31j9mdsjzecy/wordnet_feature_meta.parquet?rlkey=ixjiiso80s1uk4yhx1v38ekhm&dl=1')
hyponyms = pd.read_parquet('https://www.dropbox.com/scl/fi/pl72ixv34soo1o8zanfrz/hyponyms.parquet?rlkey=t4d606fmq1uinn29qmli7bx6r&dl=1')
Peep at the data:
print(f"{df.shape=}")
df.iloc[0]
print(f"{hyponyms.shape=}")
hyponyms.iloc[0]
Let's plot the data using the UMAP projection of the (OpenAI) embeddings of the words, coloring by "part-of-speech" and sizing by the usage frequency of the word.
g = cosmo(
    df,
    point_id_by='lemma',
    point_label_by='word',
    point_x_by='umap_x',
    point_y_by='umap_y',
    point_color_by='pos',
    point_size_by='frequency',
    point_size_scale=6,  # often have to play with this number to get the size right
    disable_point_size_legend=True
)
g
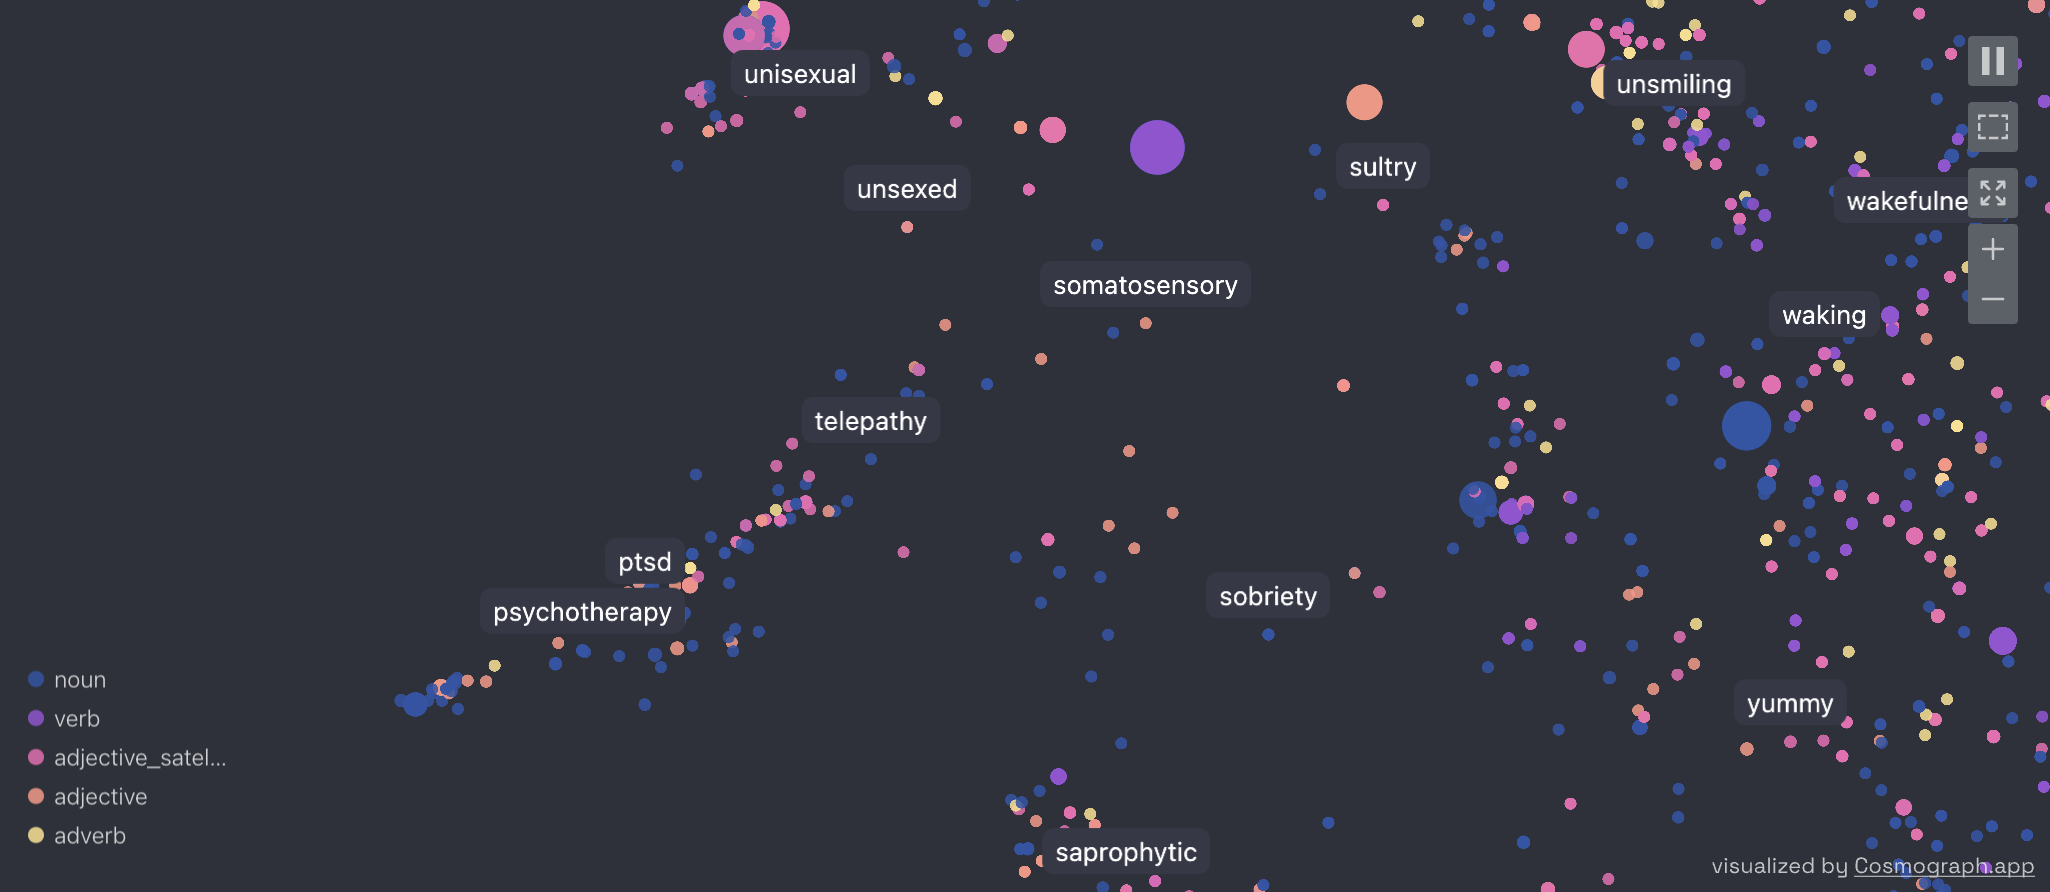
Zooming in a bit:
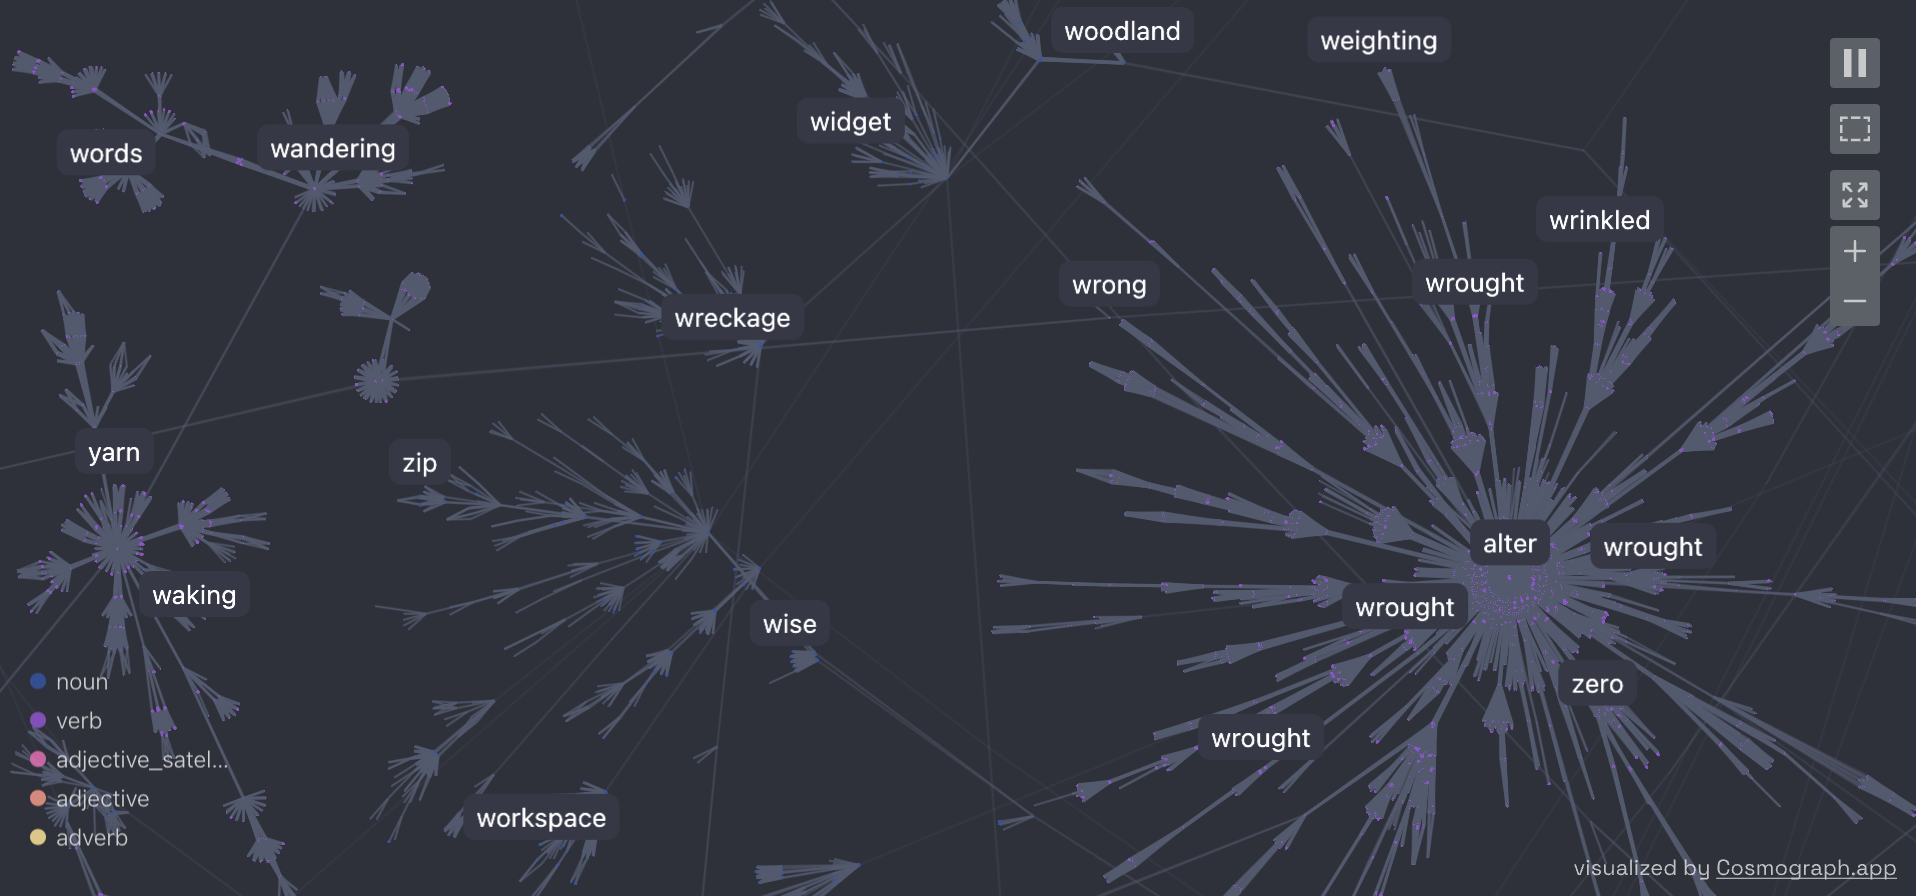
And now, let's put some hypernym-hyponym links, and let the network converge to a stable layout using a force-directed simulation (try it yourself, the convergence is pretty!)
h = cosmo(
    points=df,
    links=hyponyms,
    link_source_by='source',
    link_target_by='target',
    point_id_by='lemma',
    point_label_by='word',
    # point_x_by='umap_x',
    # point_y_by='umap_y',
    point_color_by='pos',
    point_size_by='frequency',
    point_size_scale=0.2,  # often have to play with this number to get the size right
    disable_point_size_legend=True
)
h
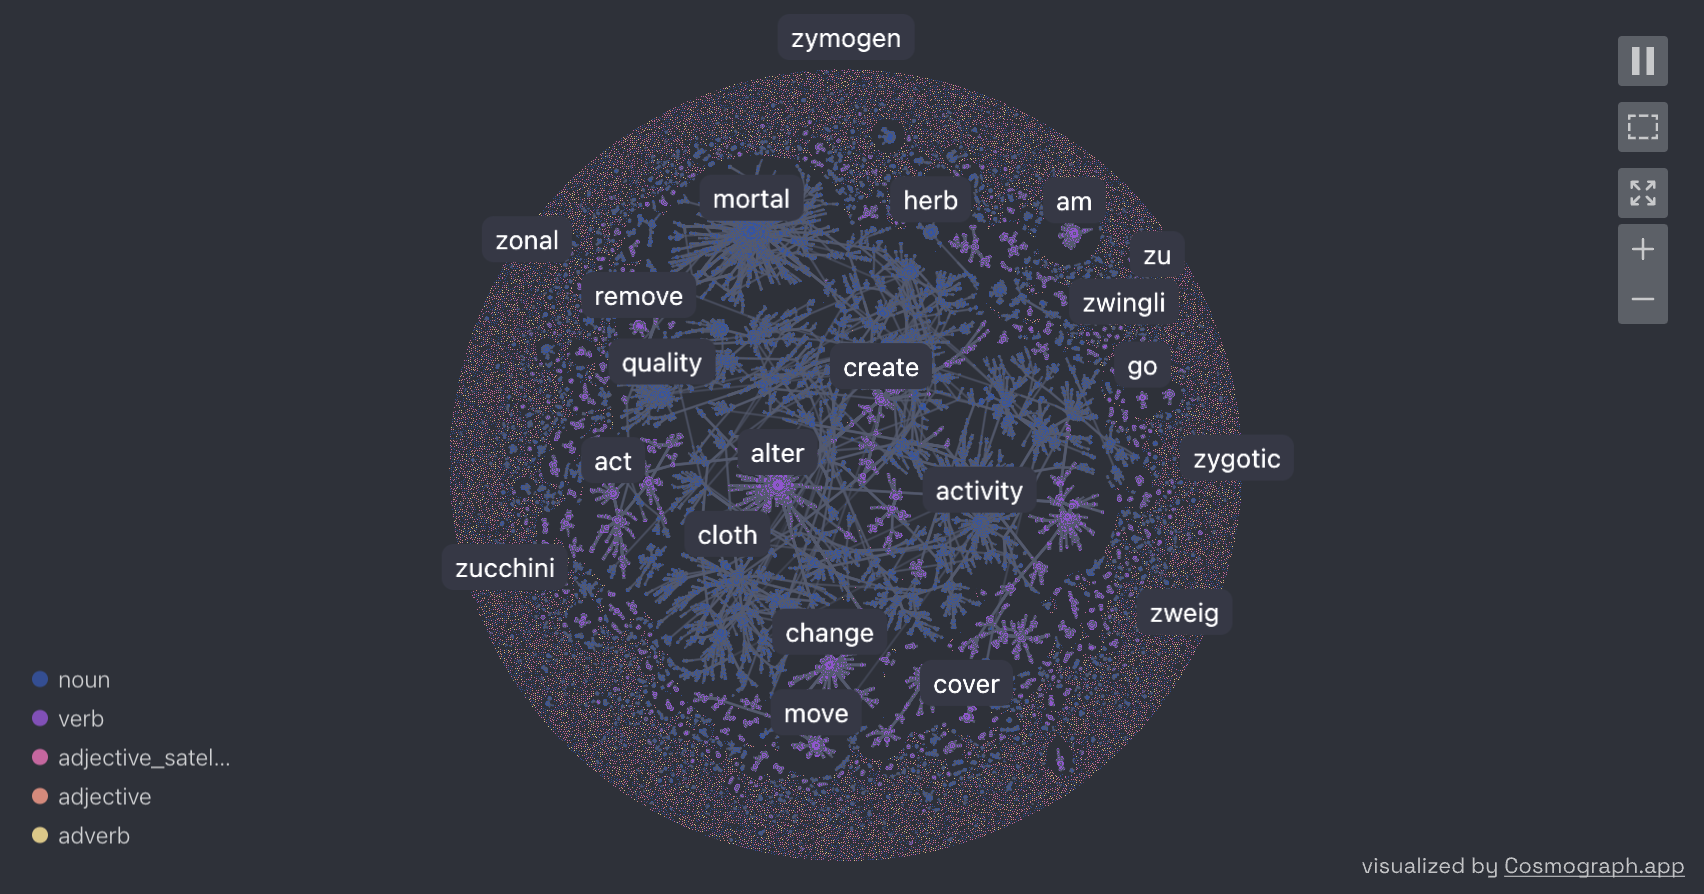
Zooming in a bit:
🔑 API Key Setup and Project Export
Setting up API Key
If you have a Cosmograph API key, you can set it globally to authenticate with Cosmograph services:
from cosmograph import set_api_key

# Set your API key globally (this will apply to all cosmograph instances)
set_api_key("your-api-key-here")
Once set, all cosmograph widgets will automatically use this API key for authentication.
Exporting Projects to Cosmograph Platform
You can export your cosmograph visualization as a project to the Cosmograph platform, making it accessible via a web interface for sharing and further collaboration.
import pandas as pd
from cosmograph import cosmo, set_api_key

# Set your API key first
set_api_key("your-api-key-here")

# Create your visualization
points = pd.DataFrame({
    'id': [1, 2, 3, 4, 5],
    'label': ['Node A', 'Node B', 'Node C', 'Node D', 'Node E'],
    'value': [10, 20, 15, 25, 30],
    'category': ['A', 'B', 'A', 'B', 'A']
})

links = pd.DataFrame({
    'source': [1, 2, 3, 1, 2],
    'target': [2, 3, 4, 5, 4],
    'value': [1.0, 2.0, 1.5, 0.5, 1.8]
})

graph = cosmo(
    points=points,
    links=links,
    point_id_by='id',
    link_source_by='source',
    link_target_by='target',
    point_color_by='category',
    point_label_by='label',
    point_size_by='value'
)

# Export to Cosmograph platform
graph.export_project_by_name("My Network Visualization")
The exported project will be available on the Cosmograph platform.
🎉 More Examples
Try out the Cosmograph widget in Google Colab with these example notebooks:
- Timeline in Cosmograph Widget ⏳
- Real-Time Data Exploration with Cosmograph Widget 🪄
- Mobius in Cosmograph Widget 🎗️
- Clusters in Cosmograph 🫧
- English Words 🔤
🛸 Issues and Feedback
Submit issues to https://github.com/cosmograph-org/py_cosmograph/issues.
👩🏻🚀 Contact and More Info
🌎 Website
Release history Release notifications | RSS feed


Download files
Download the file for your platform. If you're not sure which to choose, learn more about installing packages.
Source Distribution
Built Distribution
Filter files by name, interpreter, ABI, and platform.
If you're not sure about the file name format, learn more about wheel file names.
Copy a direct link to the current filters
File details
Details for the file cosmograph-0.5.3.tar.gz.
File metadata
- Download URL: cosmograph-0.5.3.tar.gz
- Upload date:
- Size: 352.4 kB
- Tags: Source
- Uploaded using Trusted Publishing? No
- Uploaded via: twine/6.2.0 CPython/3.10.18
File hashes
| Algorithm | Hash digest | |
|---|---|---|
| SHA256 |
29ad84d9d1b5c309fb6cbd738235d5a4398ab28298dbc6d95af55ebfa5ea9771
|
|
| MD5 |
262ae70f0760a12b14ea4cb2a697d392
|
|
| BLAKE2b-256 |
5c0be83975eeca4d2a89f9692544ea370b3da4751b73b50d38d50d82443d1df8
|
File details
Details for the file cosmograph-0.5.3-py2.py3-none-any.whl.
File metadata
- Download URL: cosmograph-0.5.3-py2.py3-none-any.whl
- Upload date:
- Size: 357.0 kB
- Tags: Python 2, Python 3
- Uploaded using Trusted Publishing? No
- Uploaded via: twine/6.2.0 CPython/3.10.18
File hashes
| Algorithm | Hash digest | |
|---|---|---|
| SHA256 |
80e9878592d1ebfa5a898bfae039e01cb1ebbce4d790f82c6d46b227261cb52c
|
|
| MD5 |
ec549361ac10ec9b35f0de5dfb6db24c
|
|
| BLAKE2b-256 |
df1b088a615cedc033a312fd2b09844bd35562526874b1554dbcabdd0adf42d3
|


