
creapy
creapy (pronounced /ˈkɹiə.paɪ/) is eye-tracking visual analytics for art history and empirical aesthetics, developed at the CReA Lab (Lab for Cognitive Research in Art History, Department of Art History, University of Vienna).
Two layers for two audiences (the division announced at DHd 2026: maximal ease of use in the app, analytical depth and flexibility in the library):
creapy: a pip-installable, Qt-free Python library for researchers who know some Python: load fixation/saccade tables, build per-stimulus datasets, draw heatmaps, scanpaths and orientation-aware saccade heatmaps (via HeatMatch), AOI metrics and sequences, descriptives, coefficient K, time series and spectra, recurrence quantification, HeatMatch / MultiMatch / ScanMatch similarity with permutation tests. Every plot takes a matplotlibax, every table is a DataFrame. Documented indocs/LIBRARY.mdandtutorial.ipynb.creapy.io: a desktop app (Qt / PySide6) for art historians and other researchers who do not program: import a table, click through the views, filter by participant or time window, export figures and tables. Everything the app shows is a library call; the app adds only windows, sliders, projects and the session log.
Status: prototype in active development, in use at the CReA Lab; the API may still change before 1.0. Source: https://github.com/xysLong/creapy (MIT). Presented as a poster at DHd 2026 (doi:10.5281/zenodo.18703017).
Installation
Non-programmers: do not install Python. Download the double-click app
(creapy.io-<version>-macOS.zip, -macOS-intel.zip or -Windows.zip) and follow
docs/INSTALL_APP.md: two minutes, one security dialog on first start.
Building those bundles: packaging/README.md.
Developers: Python 3.10 or newer. In a terminal (macOS: Terminal; Windows: PowerShell):
python -m venv creapy-env
# macOS / Linux:
source creapy-env/bin/activate
# Windows:
creapy-env\Scripts\activate

pip install "creapy[gui]"    # library + desktop app
pip install creapy           # library only, no Qt

# from a checkout of the repository instead:
pip install -e ".[gui]"
Start the app:
creapy-io # or: python -m creapy.io
The first screen offers an example dataset (synthetic, twelve invented viewers on two generated pictures) so every view can be tried before any real data is at hand.
Conda users: conda create -n creapy python=3.11 && conda activate creapy && pip install -e ".[gui]".
Data formats
| Source | What to export | Notes |
|---|---|---|
| EyeLink DataViewer | Fixation report or Saccade report, CSV/Excel, one row per event | needs a column with the stimulus image name; TRIAL_INDEX and CURRENT_FIX_PUPIL are picked up; . missing values are handled |
| Tobii Pro Lab (screen or glasses) | Event-based metrics export (TSV, one row per fixation; the file the lab shares) or the Data export (TSV, one row per gaze sample; files above 1.5 GB are read in chunks) | each snapshot / medium becomes one stimulus; pupil and viewing distance are carried along. The AOI-based metrics export opens as a table window with charts per AOI |
| Anything else | one row per fixation: participant, stimulus, start time, duration, x, y | CSV with , ; or tab, decimal commas fine; map the columns in the import dialog |
Coordinates are pixels of the image you provide: use the images at the resolution shown (or the Pro Lab snapshot files). Times may be in s, ms or µs; durations in ms or s; the units are detected.
The views
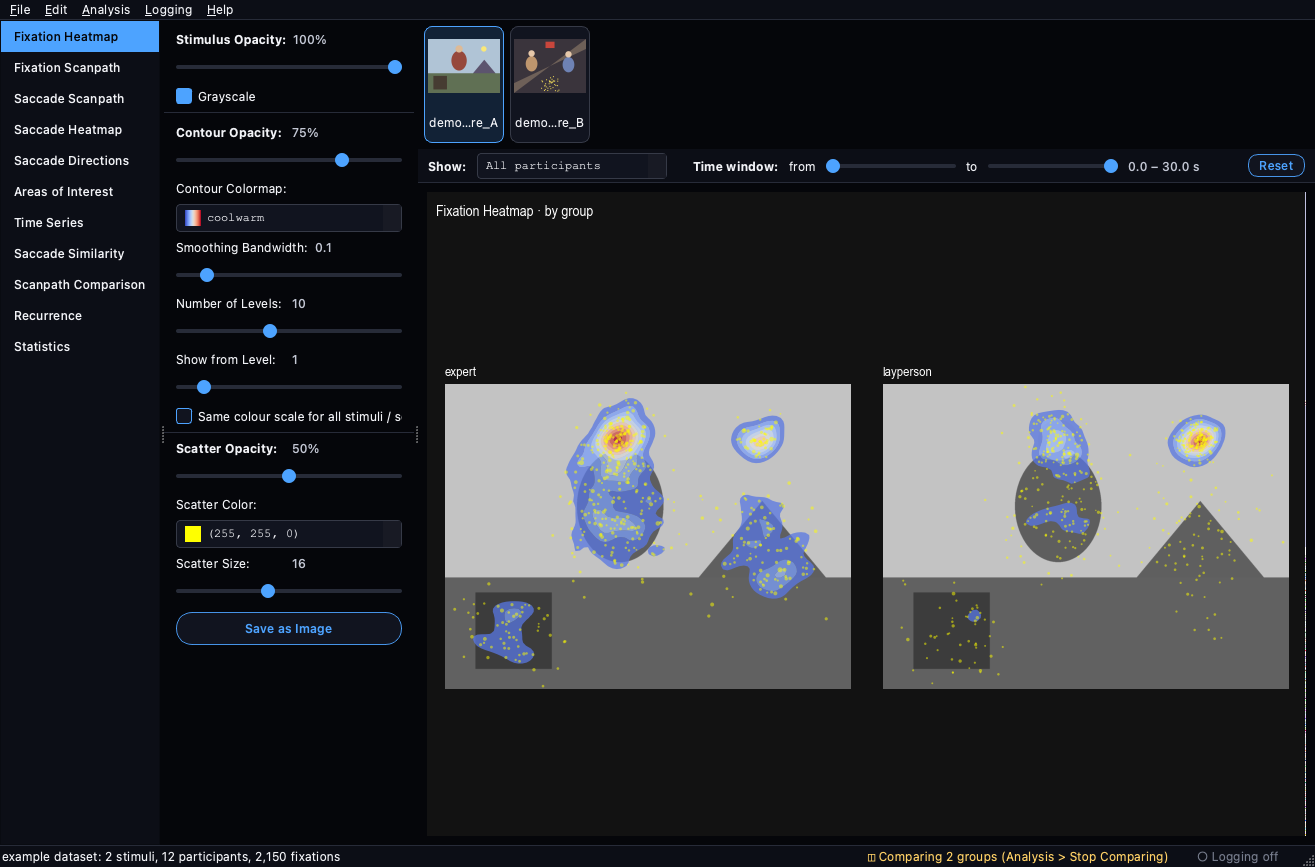
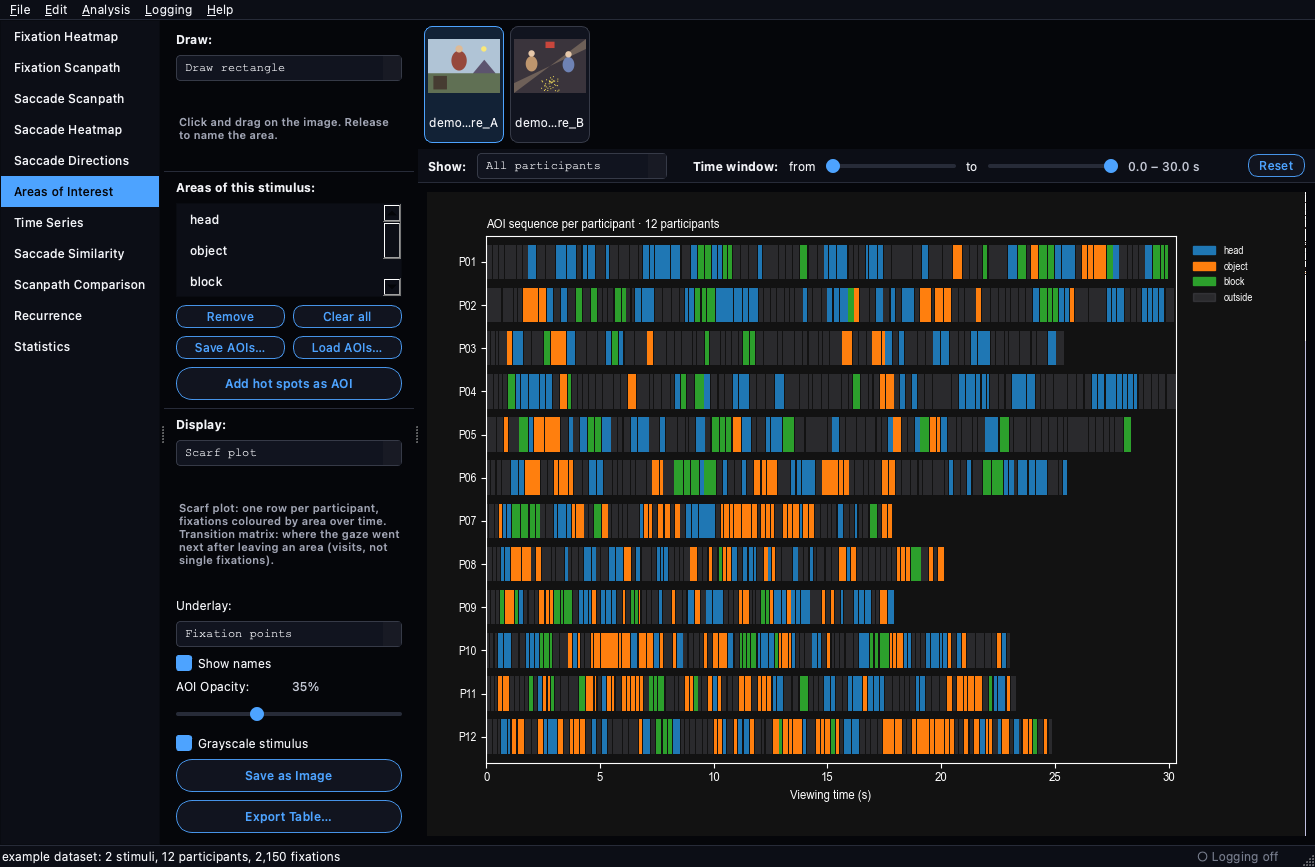
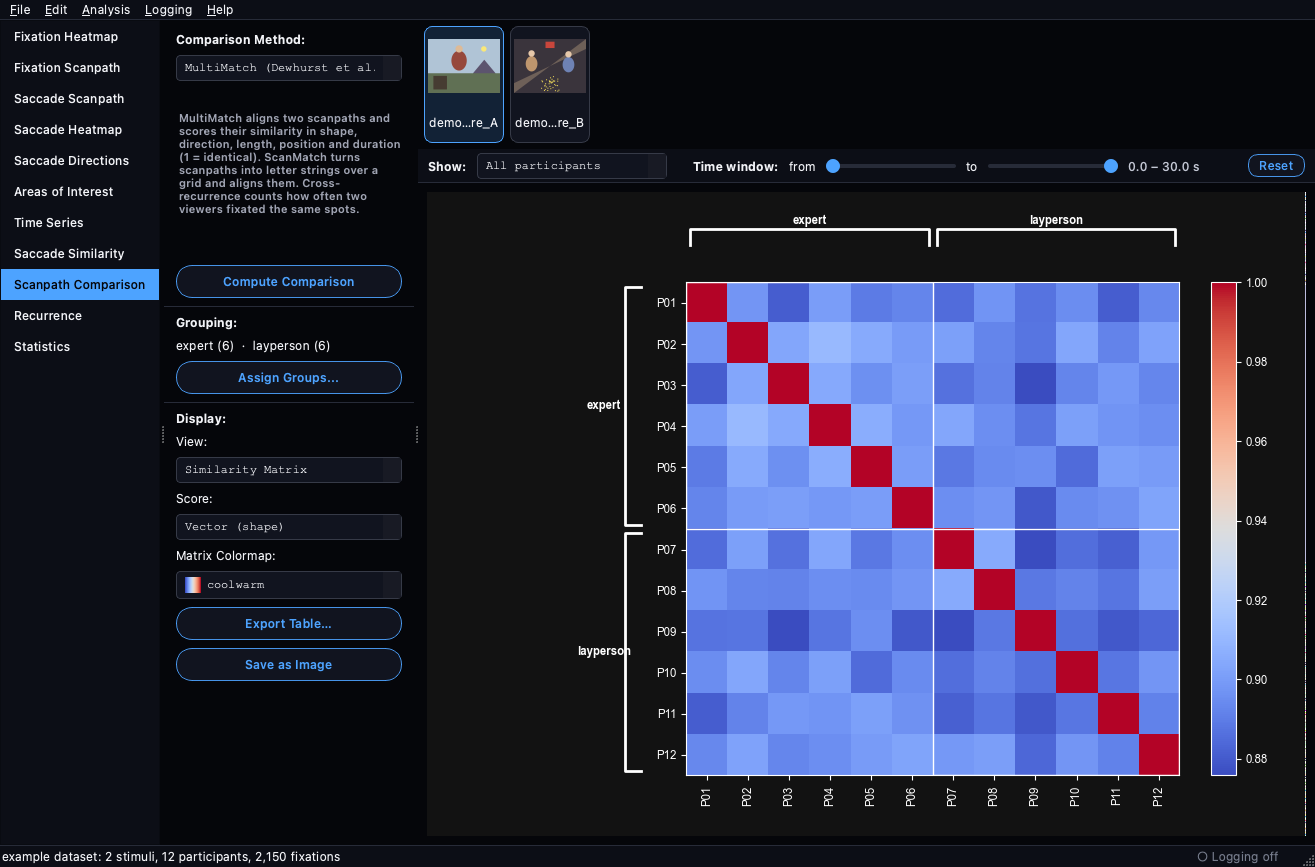
Fixation Heatmap (optional shared colour scale) · Fixation Scanpath (numbered, per participant) · Saccade Scanpath · Saccade Heatmap (HeatMatch, orientation of interest) · Saccade Directions (rose diagram) · Areas of Interest (draw rectangles / polygons; dwell time, fixations, visits, time to first fixation; scarf plot; transition matrix; first-fixation order; save/load as JSON) · Time Series (fixation duration, saccade amplitude, coefficient K, pupil size, viewing distance, share of fixations in AOIs; per group; periodogram and scalogram) · Saccade Similarity (HeatMatch: matrix, group boxplot with permutation test, viewer map, similarity over time) · Scanpath Comparison (MultiMatch, ScanMatch, cross-recurrence; same displays) · Recurrence (recurrence plot, RQA table, boxplot by group) · Statistics (per-participant table, group comparison, AOI metrics, boxplots; export CSV/Excel).
 |
 |
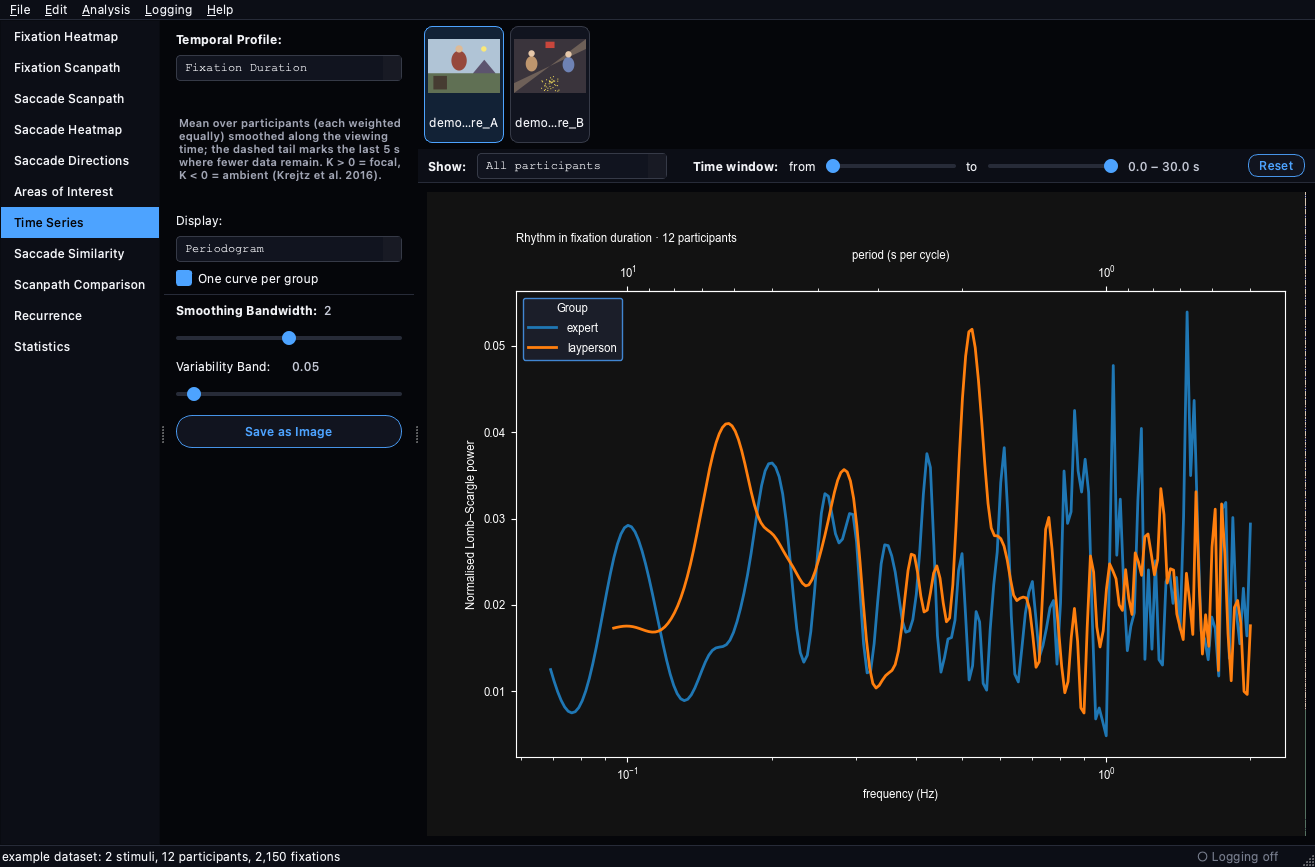 |
| scarf plot | MultiMatch matrix with groups | periodogram |
The Show bar above the canvas restricts every view to a participant, a group or a time window (e.g. the first
3 s). Groups are assigned under Analysis, optionally prefilled from a column of the table. Compare Side by
Side draws the current view once per group, stimulus or time window; Export This View for All Stimuli
writes it once per stimulus into a folder. Projects remember table, images, mapping, groups and AOIs;
Undo covers AOI edits and group assignments. Long computations run in a worker thread with a Cancel button.
Help → The Analyses Explained describes every measure in plain words; docs/QUICKSTART.pdf is the two-page
hand-out. (Screenshots are offscreen renders of the synthetic example dataset.)
Session log (opt-in). Logging > Record session log writes the views, parameter values and filters you use into a text file on your own computer (JSON lines). Nothing is sent anywhere. It exists for usability evaluations; it is off by default.
Library quickstart
Full guide with a view-by-view map of app features to library calls and the API reference:
docs/LIBRARY.md. help(creapy.FixationData) (or fix.make_heatmap? in Jupyter) shows the same
texts.
import creapy

df, mapping = creapy.load_fixations("fixation_report.csv")          # EyeLink, Tobii Data export or any table
datasets = creapy.datasets_by_stimulus(df, mapping, "stimuli/")     # {stimulus -> (FixationData, SaccadeData)}
fix, sac = next(iter(datasets.values()))
grouping = {p: "expert" if p.startswith("E") else "novice" for p in fix.subjects}

import matplotlib.pyplot as plt
fig, ax = plt.subplots()
fix.make_heatmap(ax, bw_method=0.1, cmap="coolwarm")                 # duration-weighted KDE, participants equal
fix.subset(t_range=(0, 3)).visualize_scanpath(ax, subjects=[fix.subjects[0]])

fix.set_top_down_aoi("face", creapy.AOI.rectangle("face", 600, 100, 800, 300).geom)
print(fix.aoi_metrics())                                             # participant x AOI (dwell, visits, latency)
creapy.show_scarf_plot(ax, fix); creapy.transition_matrix(fix)       # AOI sequences
df_stats = creapy.participant_table(fix, sac)                       # descriptives + coefficient K
creapy.group_comparison(df_stats, grouping)                          # Welch t / Mann-Whitney / ANOVA per measure
creapy.show_group_boxplot(df_stats, "coefficient_K", grouping)       # the Statistics view's boxplot
creapy.show_measure_curve(fix, sac, "fixation_duration", sigma=2)   # the Time Series view's curve
result = sac.compute_heatmatch_similarity(sigma=50)                  # pairwise HeatMatch scores
result.matshow(grouping=grouping); result.permutation_test(grouping)
mm = fix.compute_scanpath_similarity("multimatch")                   # MultiMatch / ScanMatch / cross-recurrence
mm.show_boxplot(grouping); mm.score_overview(grouping)
creapy.participant_rqa(fix)                                          # recurrence quantification
creapy.participant_periodogram(fix)                                  # Lomb-Scargle rhythm per participant
tutorial.ipynb walks through all of this on the example dataset; demo_similarity.ipynb covers the similarity
workflow in depth.
Development
pip install -e ".[dev]"
pytest                      # formats, conversions, datasets, offscreen GUI
Layout: creapy/formats/ (table reading, format detection, Tobii loaders), creapy/gaze/ (datasets,
conversions), creapy/aoi/ (AOI geometry, sequences), creapy/stats/ (descriptives, time series, recurrence, spectrum),
creapy/similarity/ (HeatMatch results, MultiMatch/ScanMatch), creapy/misc/ (contours, utils), creapy/io/
(the Qt app: main.py window, views.py prepare/draw functions, worker.py, project.py, widgets/,
style/), creapy/examples/ (synthetic example data), tests/, docs/, packaging/.
Saccade orientation fields and similarity are computed by the heatmatch package and are not reimplemented here.
docs/LIBRARY.md is generated from the docstrings by python docs/make_library_reference.py; a test fails when
a public library function lacks a docstring or when the GUI gains logic the library does not have.
Citation
Long, X. & Rosenberg, R. (2026). Perspektiven für ein anfängerfreundliches Tool zur Eye-Tracking-Datenvisualisierung in der kognitiven Kunstgeschichte. Book of Abstracts – DHd 2026, 606–607. https://doi.org/10.5281/zenodo.18703017
Long, X., Arató, J., Kury, S., Miscenà, A. & Rosenberg, R. (2026). HeatMatch: Orientation-Aware Visualization and Comparison of Very Dense Saccade Patterns. Proc. ACM Comput. Graph. Interact. Tech. 9(2), Art. 18. https://doi.org/10.1145/3803539
License
MIT (see LICENSE). Contact: Xingyu Long, xingyu.long@univie.ac.at.
1 maintainer

Metadata
1 maintainer
Release files for creapy 0.1.0
For a detailed explanation of source distributions (sdists) and built distributions (wheels), please see the package formats documentation.
Source distribution (sdist)
| File | Size | Uploaded | Provenance | Actions |
|---|---|---|---|---|
| creapy-0.1.0.tar.gz | 420.0 kB | Without provenance | Details for creapy-0.1.0.tar.gz |
Built distribution (wheel)
| File | Interpreter | ABI | Platform | Actions Reset |
|---|---|---|---|---|
| creapy-0.1.0-py3-none-any.whl | Python 3 | none | any | Details for creapy-0.1.0-py3-none-any.whl |
Total release size: 852.2 kB
Release files / creapy-0.1.0.tar.gz
| Download URL | creapy-0.1.0.tar.gz |
|---|---|
| Size | 420.0 kB |
| Tags | Source |
|
SHA-256 checksum How to use checksums |
caca7ce71ff778900ce4f128e9ab786892987d62ed5ff72db132e9c1f8b0e677
|
|
BLAKE2b-256 checksum How to use checksums |
89a9a24f75ec289b6a53645c8491d3deca4f77a2568d693920cc176310af2f62
|
| Upload date | |
|
Uploaded using Trusted Publishing? What is trusted publishing? |
No |
| Uploaded via |
twine/7.0.0 CPython/3.10.19
|
Release files / creapy-0.1.0-py3-none-any.whl
| Download URL | creapy-0.1.0-py3-none-any.whl |
|---|---|
| Size | 432.1 kB |
| Tags | Python 3 |
|
SHA-256 checksum How to use checksums |
ccefbf0a2502540a875c54ec2c407e8bfa145d3477cde17f9f2336bca362aada
|
|
BLAKE2b-256 checksum How to use checksums |
b0c0c782ee476785eaca9405a23e8f9d0cfc924c2a5e4c5b9aaa336e7d9a02b0
|
| Upload date | |
|
Uploaded using Trusted Publishing? What is trusted publishing? |
No |
| Uploaded via |
twine/7.0.0 CPython/3.10.19
|
Security for creapy 0.1.0
Provenance
Provenance describes where a file came from. On PyPI, provenance is shared via attestations, which provide a verifiable record of the build or publishing details. View details, limitations and caveats.
No provenance found
None of the files in this release were uploaded with provenance metadata.
A note on package security
PyPI is a repository for distributing packages, not a service for auditing them. While third-party security researchers and our staff do their best to detect and remove malicious packages, PyPI cannot guarantee the quality, security or suitability of any given package.
To learn more about protecting yourself from malicious actors, visit our package security documentation.














