
A modern, distributed, fault-tolerant, highly available, leader-electing, container-friendly, highly configurable, precompiled, multi-architecture, portable, security-hardened, production-ready cron replacement.
Verified details
These details have been verified by PyPIProject links
GitHub Statistics
Maintainers

Project description














cronstable
A stability-focused, container-friendly, optionally-distributed, fault-tolerant, highly-available, leader-electing, configurable, precompiled, multi-architecture, portable, batteries-inlcuded, security-hardened, production-ready cron replacement.
cronstable is a fork of yacron (by Gustavo Carneiro), continuing development from version 0.19.
Why cronstable?
- Built for locked-down containers. Runs unmodified under restricted
Kubernetes PodSecurity: non-root, read-only root filesystem,
RuntimeDefaultseccomp, every Linux capability dropped (see Production container deployment). - Prebuilt for practically everything. Multi-architecture images on GHCR and Docker Hub plus self-contained binaries for Linux (glibc and musl), macOS (signed and notarized) and Windows, so Python on the host is optional (see Installation).
- Observability and durability: A live web dashboard, native Prometheus metrics, per-job resource monitoring, and opt-in durable state, orchestration DAGs and leader-elected clustering, all in one daemon.
Features
- "Crontab" is in YAML format; classic crontab files are accepted as-is too (see Classic crontab files)
- Builtin sending of Sentry, Mail, and webhook (Slack-compatible) notifications when cron jobs fail
- Flexible configuration: you decide how to determine if a cron job fails or not
- Designed for running in Docker, Kubernetes, or 12 factor environments:
- Runs in the foreground
- Logs everything to stdout/stderr
- Production-ready for locked-down corporate container platforms: runs as a
non-root user, under a restricted seccomp profile, with a read-only root
filesystem, an
fsGroup-mounted config, and all Linux capabilities dropped, so no writable paths or elevated privileges are required (see Production container deployment)
- Option to automatically retry failing cron jobs, with exponential backoff
- Opt-in durable state: point a single
state:config block at a local directory (or an Amazon S3 Files / EFS mount to share it fleet-wide) and jobs gain durability across restarts -- missed-run catch-up after downtime and retries that survive a daemon restart. The same store is handed to the jobs themselves over a loopback endpoint, so a job command can reach for durable key/value, an ETL cursor/watermark, a fleet-wide mutex or semaphore, idempotency keys, a shared artifact store and run-scoped secrets withcronstable state|cursor|lock|artifact|idempotent|secret(see the Durable State wiki page); without it, cronstable stays stateless as before - Opt-in orchestration DAGs: a
dags:block turns the scheduler into a small, durable workflow engine -- tasks withdependsOnedges, cross-task data hand-off (XCom), dynamic fan-out/mapping, sensors, human approval gates, whole-DAG backfill, and crash-resume of a partial graph, all on the same state store and coordinated across a fleet under a single lease so a task never double-launches (see the Orchestration and DAGs wiki page) - Optional HTTP REST API, to fetch status, start jobs, cancel running jobs, and read per-job run history on demand
- Native Prometheus metrics at
/metrics(plus per-job statsd push metrics), covering run outcomes, durations, retries, schedules, and cluster health (see Metrics) - Opt-in per-job resource monitoring: one
monitorResources: truesamples each run's CPU time and peak memory across its whole process tree, live and per run, in the dashboard, the metrics, and the failure reports (see Resource monitoring) - A job-set id: an order-independent fingerprint of every job's effective configuration, so replicas deployed from the same config can confirm they hold an identical set of jobs (see Job-set id)
- Opt-in clustering and leader election: optionally have instances confirm over mutual TLS that a configured set of peers is running the same job set, and elect a leader so several replicas can run from one config without double-running jobs (see Clustering and leader election)
- Arbitrary timezone support
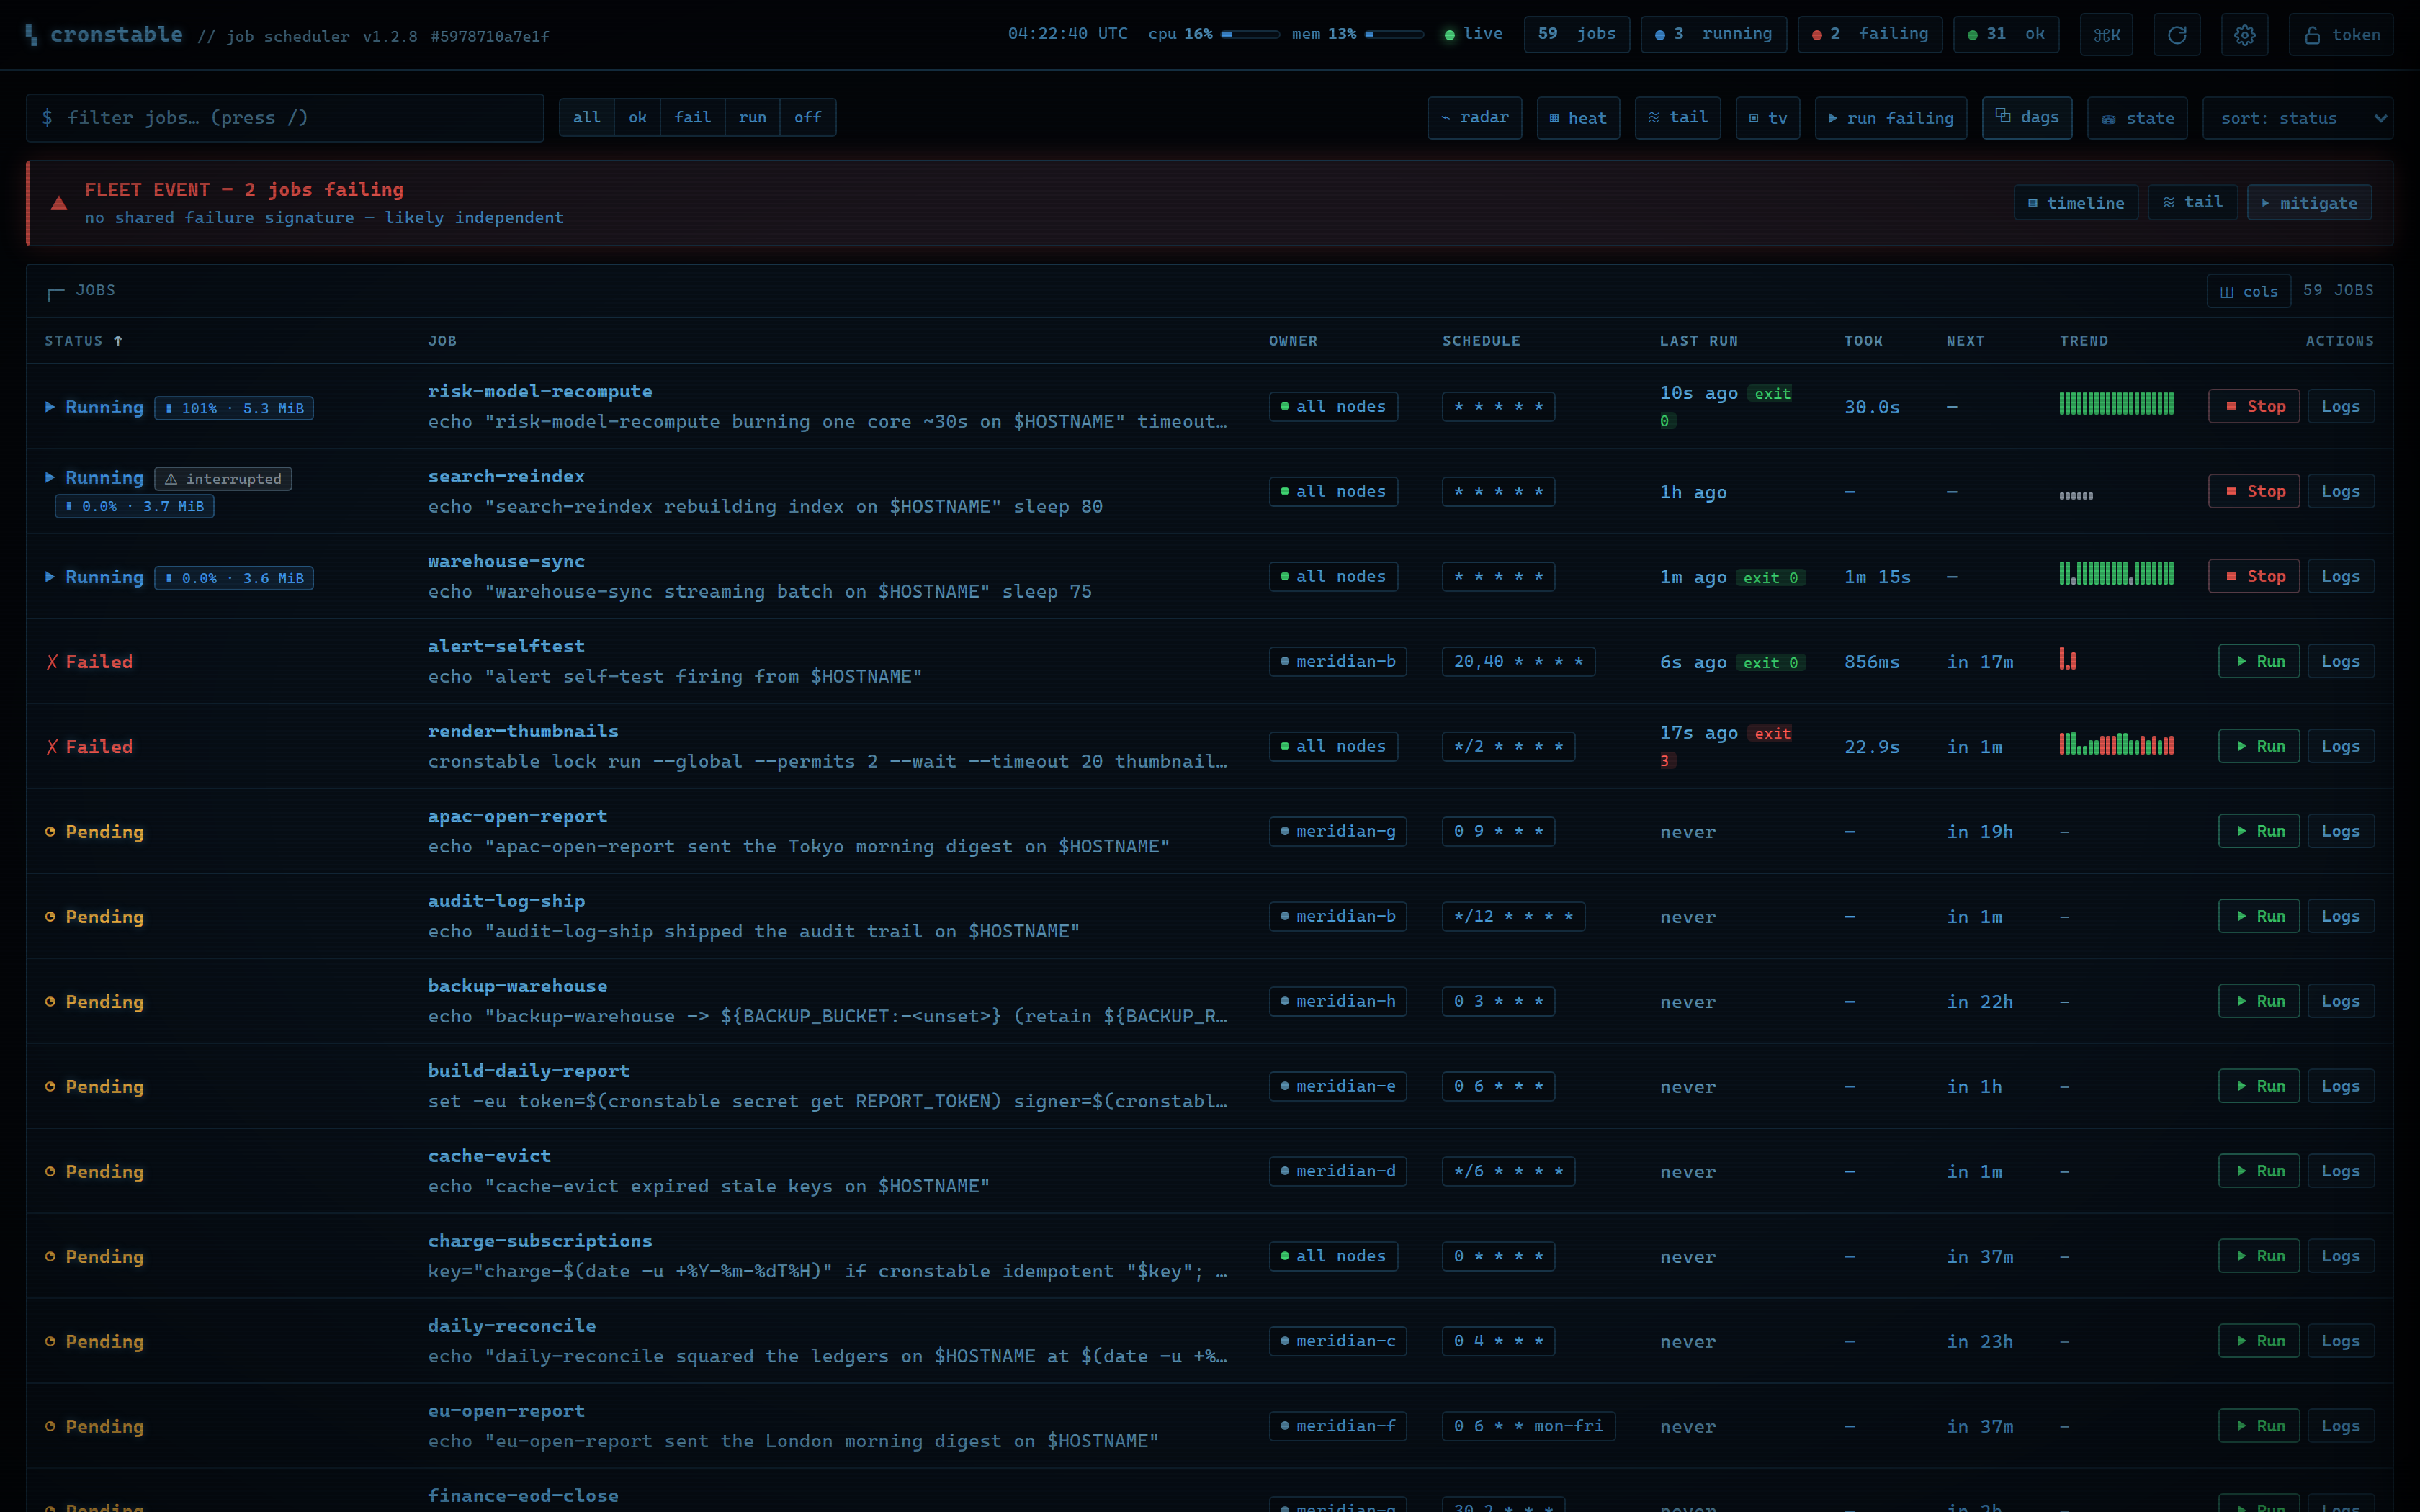
- Optional live control panel: watch every job's status, tail its logs in real time, run or cancel jobs on demand, review run history and success rates, drive DAG runs and approvals, and keep an eye on the whole cluster, from one self-contained page with ten themes and a shortcut for everything
Quick start
Sixty seconds to a running scheduler with a live dashboard. Install it (see Installation for Docker, Homebrew, and no-Python binary options):
pip install cronstable
Describe your first job in a cronstable.yaml:
jobs:
  - name: hello
    command: echo "hello from cronstable on $(hostname)"
    schedule: "* * * * *"        # every minute
    captureStdout: true

web:
  listen:
    - http://127.0.0.1:8080      # optional: the REST API + dashboard
Run it (always in the foreground, in true 12-factor spirit):
cronstable -c cronstable.yaml
That's it. Open http://127.0.0.1:8080/ and watch hello fire once a minute,
with its output tailing live in the dashboard. From here,
each of these is a few lines away:
- Never miss a silent failure: retries with backoff and a Slack/mail/Sentry report when a job ultimately fails (tutorial).
- Survive restarts: a one-line
state:block makes history, retries and missed-run catch-up durable (tutorial). - Chain jobs into a pipeline: a durable DAG with data hand-off and an approval gate (tutorial).
- Run replicas safely: leader election so two copies never double-fire (tutorial).
- See it all at once:
docker compose -f docker-compose-grand-tour.yml up --buildboots a nine-node cluster running every feature together (example gallery).
Already have a crontab? You don't have to translate it:
cronstable -c /etc/crontab runs the classic format as-is (see
Classic crontab files).
Installation
Run with Docker
Prebuilt, multi-architecture (linux/amd64, linux/arm64, linux/386,
linux/arm/v7, linux/ppc64le, linux/s390x and linux/riscv64) images are
published on every release to two registries: the GitHub Container Registry
and Docker Hub. The images are identical; pull from whichever you prefer. The
default image is built on Debian (slim); if you would rather match a particular
base, Alpine, Ubuntu, RHEL/UBI and other variants are
published from the same release too. Mount your crontab and go:
# GitHub Container Registry
docker run --rm \
  -v "$PWD/cronstable.yaml:/etc/cronstable.d/cronstable.yaml:ro" \
  ghcr.io/ptweezy/cronstable:latest

# Docker Hub
docker run --rm \
  -v "$PWD/cronstable.yaml:/etc/cronstable.d/cronstable.yaml:ro" \
  ptweezy/cronstable:latest
The image runs as a non-root user and reads its configuration from
/etc/cronstable.d by default. For production, pin a specific version instead of
latest (e.g. ghcr.io/ptweezy/cronstable:1.0.14 or ptweezy/cronstable:1.0.14) and
see Production container deployment for the
hardened Kubernetes/Docker setup.
Distro variants
The default latest (and <version>) image is built on Debian (slim). The
same release is also published on several other bases, so you can match a
specific one to your environment: a familiar userland, an image-provenance
policy that mandates a particular vendor, or the smallest possible image. Each
variant adds a -<distro> suffix to the tag (and the default Debian image is
also available explicitly as -debian):
| Tag suffix | Base image | Python | Notes |
|---|---|---|---|
(none) / -debian |
python:3.14-slim |
3.14 | Default. Widest architecture coverage. |
-alpine |
python:3.14-alpine |
3.14 | musl libc; smallest image. |
-ubuntu |
ubuntu:24.04 |
3.12 | Ubuntu LTS userland. |
-rhel |
UBI 9 (ubi-minimal) |
3.12 | Red Hat base for RHEL / OpenShift. |
-fedora |
fedora:41 |
3.13 | Leading-edge RPM userland. |
-opensuse |
opensuse/leap:15.6 |
3.11 | SUSE / SLES family. |
-amazonlinux |
amazonlinux:2023 |
3.11 | AWS-centric deployments. |
-distroless |
gcr.io/distroless/python3 |
3.11 | No shell or package manager; minimal attack surface. |
# e.g. the Alpine variant, pinned to a version:
docker run --rm \
  -v "$PWD/cronstable.yaml:/etc/cronstable.d/cronstable.yaml:ro" \
  ghcr.io/ptweezy/cronstable:1.0.14-alpine
cronstable is a pure-Python app that supports any Python >= 3.10, so behavior is
identical across variants. The Debian default covers the most architectures; each variant covers the arches
its base image publishes (Alpine matches Debian's full set; RHEL, Fedora,
openSUSE and distroless cover amd64, arm64, ppc64le and s390x; Amazon
Linux covers amd64 and arm64). All variants share the same non-root,
read-only-friendly hardening as the default image.
Install using pip
cronstable requires Python >= 3.10 (for systems with older Python, use the binary instead). It is advisable to install it in a Python virtual environment, for example:
python3 -m venv cronstableenv
. cronstableenv/bin/activate
pip install cronstable
Install using pipx
pipx automates creating a virtualenv and installing a python program in the newly created virtualenv. It is as simple as:
pipx install cronstable
Install using Homebrew
On macOS or Linux, install from the cronstable Homebrew tap:
brew install ptweezy/tap/cronstable
This installs the self-contained release binary for your platform (signed and
notarized on macOS; glibc amd64/arm64 on Linux via Homebrew on Linux), so no
Python is required. Upgrade later with brew upgrade cronstable.
Install using binary
Alternatively, a self-contained binary can be downloaded from github: https://github.com/ptweezy/cronstable/releases. Every release automatically attaches binaries for Linux (amd64, arm64, i686, armv7, armv6, ppc64le, s390x and riscv64), macOS (amd64 and arm64) and Windows (amd64 and arm64):
- Linux: glibc builds (
cronstable-linux-<arch>) for the mainstream distros, working on any system post glibc 2.39 (e.g. Ubuntu 24.04) on the matching CPU, plus musl builds (cronstable-linux-<arch>-musl) for Alpine and other musl-based systems.<arch>is one ofamd64,arm64,i686(32-bit x86),armv7(32-bit ARM, e.g. older Raspberry Pi),armv6(musl only),ppc64le(POWER),s390x(IBM Z) orriscv64(64-bit RISC-V). - macOS:
cronstable-macos-arm64(Apple Silicon) /cronstable-macos-amd64(Intel). - Windows:
cronstable-windows-amd64.exe(x64) /cronstable-windows-arm64.exe(ARM64).
Python is not required on the target system (it is embedded in the executable):
# pick the asset for your OS and architecture (glibc amd64 Linux shown; append
# -musl on Alpine, or use cronstable-macos-<arch> on a Mac)
curl -fsSL -o cronstable \
  https://github.com/ptweezy/cronstable/releases/latest/download/cronstable-linux-amd64
chmod +x cronstable
./cronstable --version
The macOS binaries are signed and notarized by Apple.
The standalone binary is a self-extracting executable: on each start it unpacks
its embedded Python runtime into a temporary directory and loads shared
libraries from there. It therefore needs a temporary directory that is both
writable and executable. On an ordinary system the default /tmp already
satisfies this, so no extra setup is required.
This only matters when you run the binary under a read-only root filesystem
(for example, a hardened container). With the root filesystem read-only, /tmp
is read-only too, and the binary aborts at startup: Could not create temporary directory, or Error loading shared library …: Operation not permitted. Give
it a small writable and executable temp mount and it runs fine:
# Note `exec`: Docker's --tmpfs defaults to `noexec`, but the binary must be
# able to execute the libraries it unpacks.
docker run --rm --read-only \
  --tmpfs /tmp:rw,exec,nosuid,nodev,size=64m \
  -v "$PWD/cronstable.yaml:/etc/cronstable.d/cronstable.yaml:ro" \
  your-image-with-the-binary -c /etc/cronstable.d
On Kubernetes, mount an emptyDir at /tmp (an emptyDir is writable and
executable by default; use medium: Memory for a tmpfs). Alternatively, point
the binary at another writable, executable directory with TMPDIR=/path.
This requirement is unique to the standalone binary. The published container
image (and pip/pipx installs) run cronstable as a normal Python package with
the interpreter on disk, so they never self-extract and need no writable temp
directory. See Production container deployment.
Running on Windows
cronstable runs natively on Windows (x64 and ARM64), in addition to Linux and
macOS. Install it with pip install cronstable, or download the self-contained
cronstable-windows-amd64.exe / cronstable-windows-arm64.exe from the
releases page (no Python
required). Everything else, like the YAML crontab, scheduling, reporting, retries,
the HTTP API and the web dashboard, works the same as on
POSIX. A few platform details differ:
-
Default config location. When
-cis omitted, cronstable looks in%APPDATA%\cronstable(e.g.C:\Users\you\AppData\Roaming\cronstable), the Windows analog of/etc/cronstable.d. Point it anywhere with-c:cronstable -c C:\path\to\cronstable.yaml
-
Default shell. A string
commandwith no explicitshellruns through the native command processor (%ComSpec%, i.e.cmd.exe), mirroring the/bin/shdefault on POSIX. For PowerShell, or any other interpreter, setshell:or passcommandas a list (which bypasses the shell entirely):jobs: - name: powershell-job command: - powershell - -Command - Get-Date schedule: "*/5 * * * *" captureStdout: true
-
Graceful shutdown. Press
Ctrl-C(orCtrl-Break) to stop cronstable; it shuts down after the currently running jobs finish, just asSIGTERMdoes on POSIX. -
Not supported on Windows. Per-job
user/groupswitching (there is nosetuid/setgidequivalent) is rejected with a clear configuration error, andunix://web listeners are skipped with a warning. Use anhttp://listener instead.
Production container deployment
cronstable is built to run unmodified under the hardened security contexts that corporate and enterprise Kubernetes / container platforms enforce. At runtime the daemon only reads its configuration and secrets and writes its output to stdout/stderr. It never needs a writable working directory, temp files, or log files, so it slots cleanly into a locked-down pod:
- Non-root user: cronstable needs no special privileges to run, so the whole
daemon can run as an unprivileged UID. Only the optional per-job
user/groupswitching (see Change to another user/group) requires running as root; if you don't use that feature, drop root entirely. - Seccomp profile: cronstable makes no exotic syscalls, so the
RuntimeDefaultseccomp profile (or an equivalently strict custom profile) works out of the box. - Read-only root filesystem: no runtime writes are required by the
published image (or a
pip/pipxinstall). Mount your crontab config read-only. (If you enable the optional HTTP interface on a Unix socket, point the socket at a small writableemptyDirvolume rather than the root filesystem. And if you deploy the standalone binary instead of the image, it additionally needs a small writable, executable temp mount; see Install using binary.) fsGroupand dropped capabilities: config and secret volumes can be mounted with anfsGroupso the non-root process can read them, and you can drop all Linux capabilities and forbid privilege escalation.
The published image (ghcr.io/ptweezy/cronstable and docker.io/ptweezy/cronstable)
is already built this way (non-root, with cronstable -c /etc/cronstable.d as its
entrypoint and no writable paths required), so for most deployments you can use
it directly and mount your crontab read-only. If you would rather bake the
configuration into your own image, base it on the published image:
FROM ghcr.io/ptweezy/cronstable:latest

# The base image already runs as the non-root user 65534.
COPY cronstable.yaml /etc/cronstable.d/cronstable.yaml
And a corresponding Kubernetes Deployment with a fully restricted security
context:
apiVersion: apps/v1
kind: Deployment
metadata:
  name: cronstable
spec:
  replicas: 1
  selector:
    matchLabels:
      app: cronstable
  template:
    metadata:
      labels:
        app: cronstable
    spec:
      securityContext:           # pod-level
        runAsNonRoot: true
        runAsUser: 65534
        runAsGroup: 65534
        fsGroup: 65534           # lets the non-root process read mounted volumes
        seccompProfile:
          type: RuntimeDefault
      containers:
        - name: cronstable
          image: ghcr.io/ptweezy/cronstable:latest
          args: ["-c", "/etc/cronstable.d"]
          securityContext:       # container-level
            allowPrivilegeEscalation: false
            readOnlyRootFilesystem: true
            capabilities:
              drop:
                - ALL
          resources:
            limits:
              cpu: 200m
              memory: 128Mi
            requests:
              cpu: 10m
              memory: 64Mi
          volumeMounts:
            - name: crontab
              mountPath: /etc/cronstable.d
              readOnly: true
      volumes:
        - name: crontab
          configMap:
            name: cronstable
Web dashboard
cronstable ships with a built-in web dashboard: one self-contained page (no build step, no external assets, no database) served straight from the daemon. Point a browser at the HTTP listener and you have a keyboard-driven control room for every job, and, when you use them, for the cluster, the DAGs, and the durable state store too.
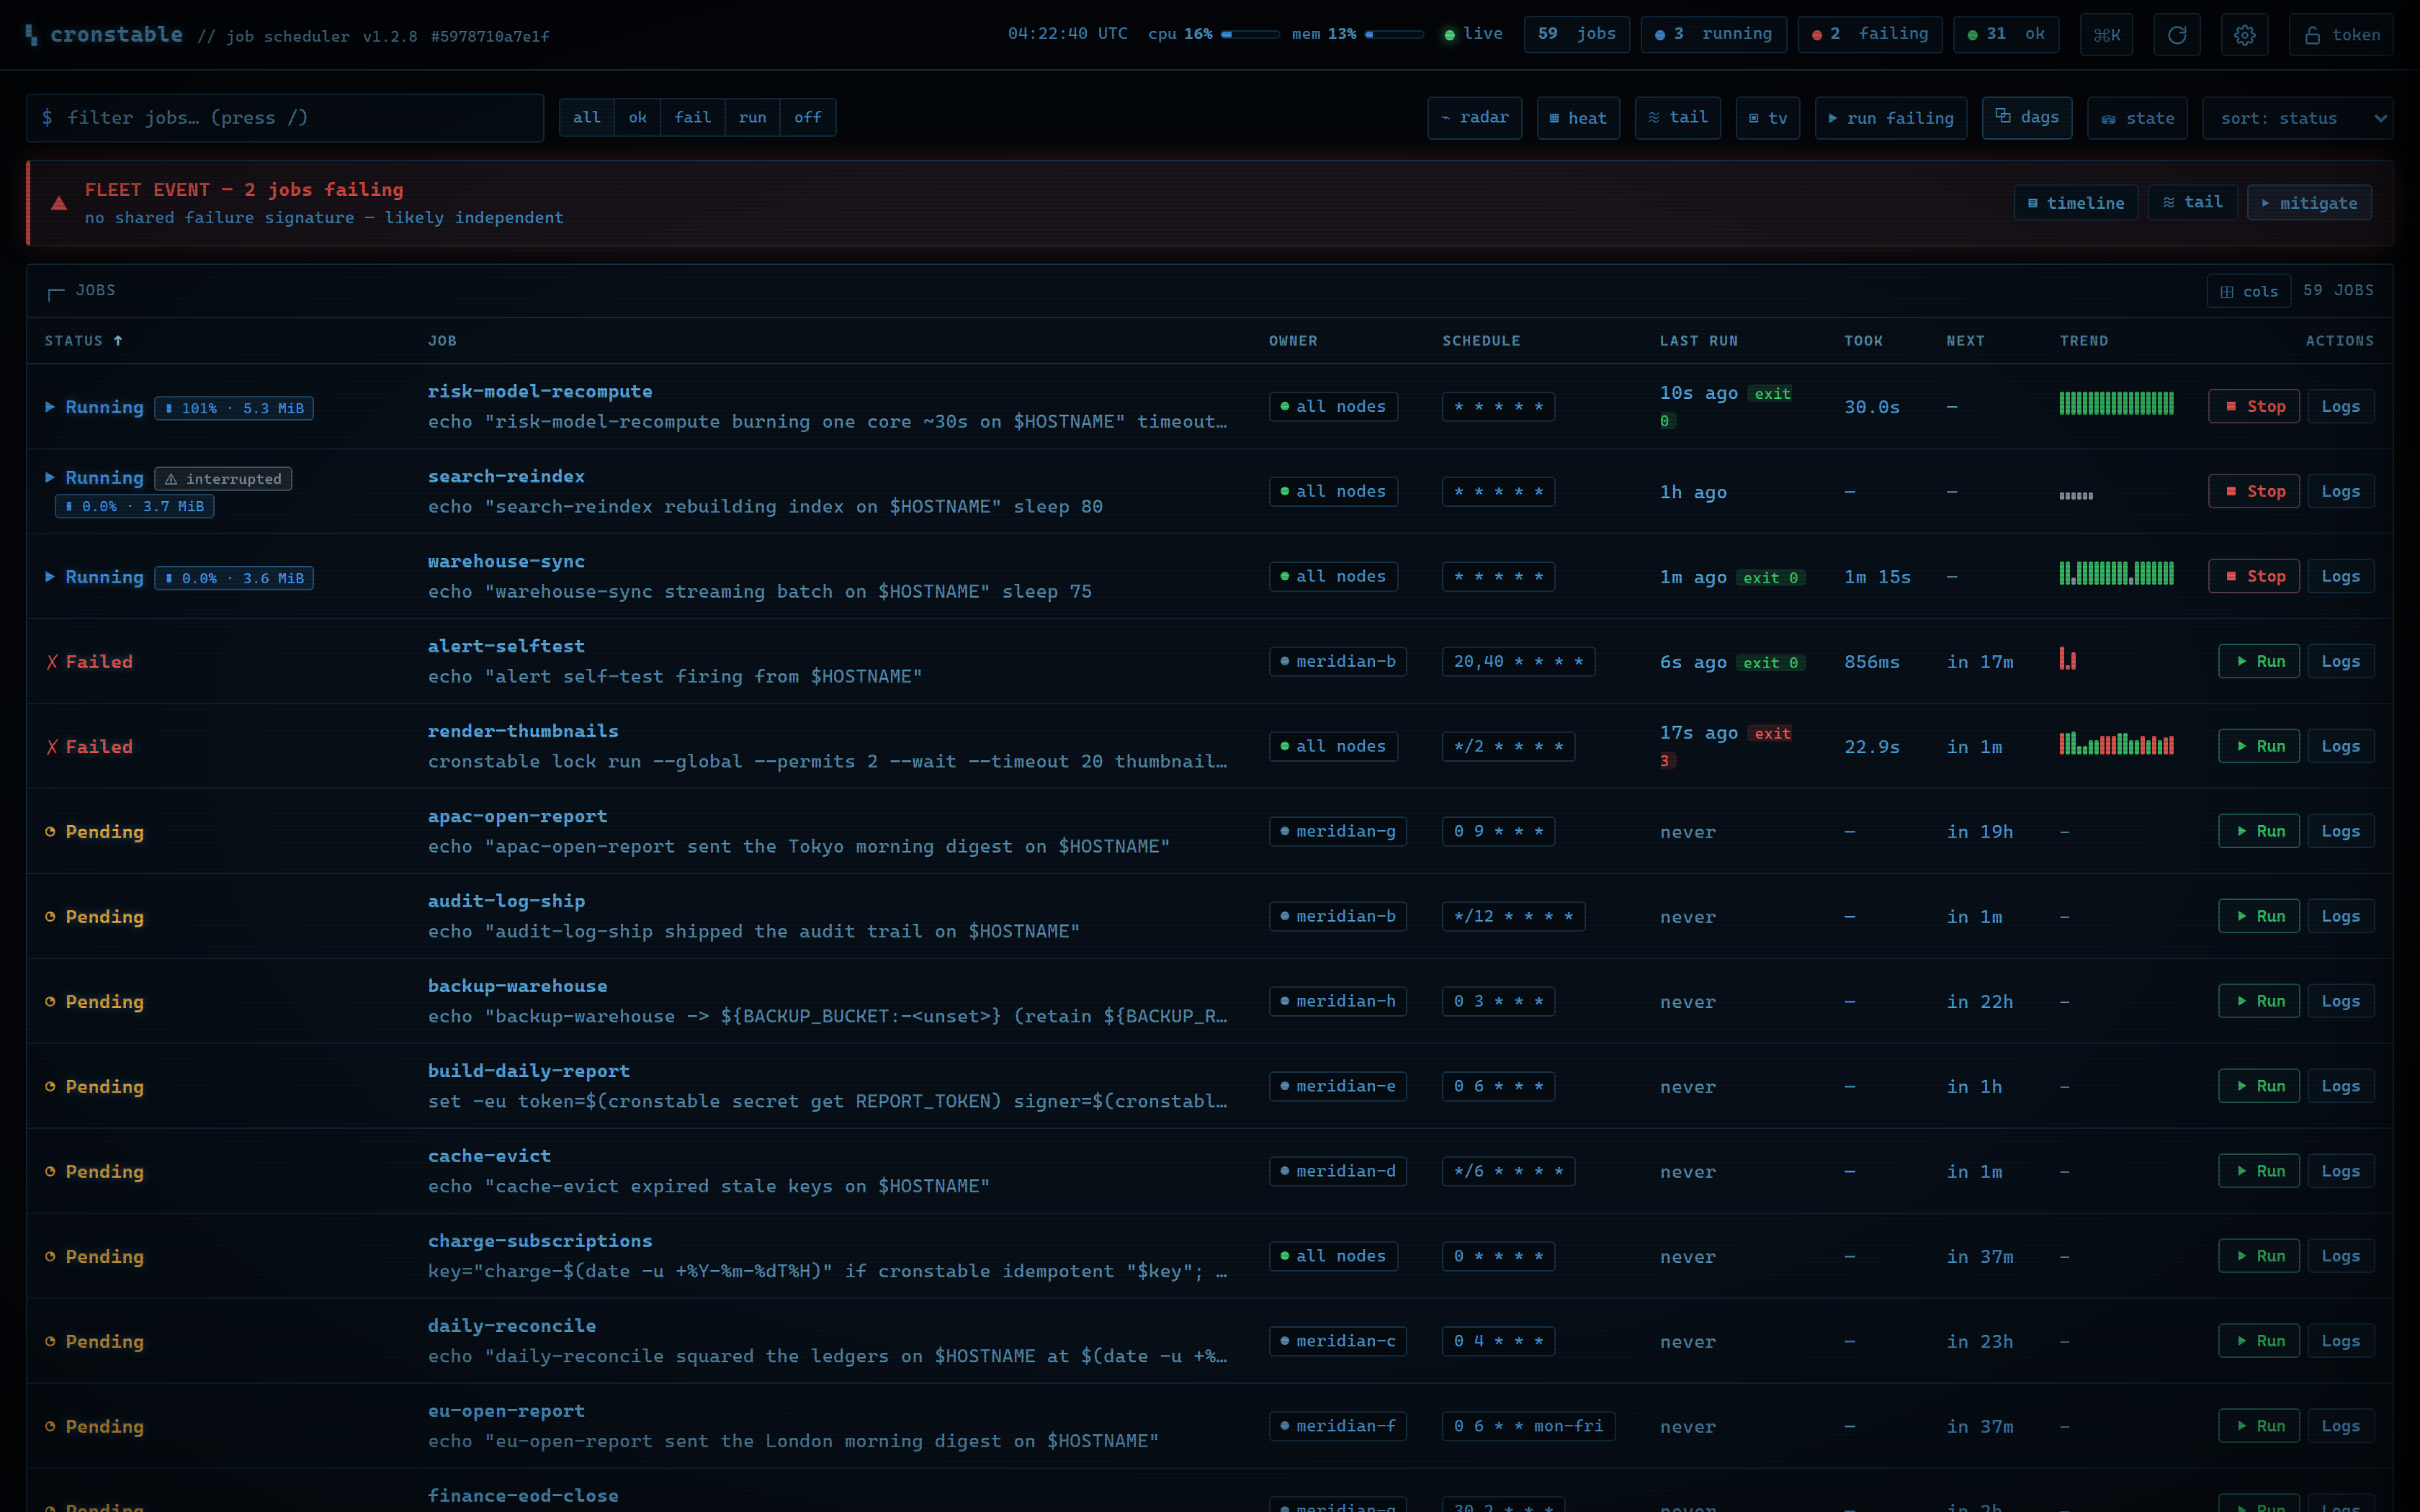
The overview shows every job with its live status, a countdown to its
next run, the last run's duration and exit-code badge, and a sparkline of
recent runs; jobs with resource monitoring add live
CPU and memory chips while they run, and a cluster adds each job's
owner node. Everything is sortable, filterable, and searchable, and when
something is failing a verdict bar correlates the failures into one
headline ("4 share exit=69, likely one cause"). Click any job (or press
Enter) to open its detail drawer:
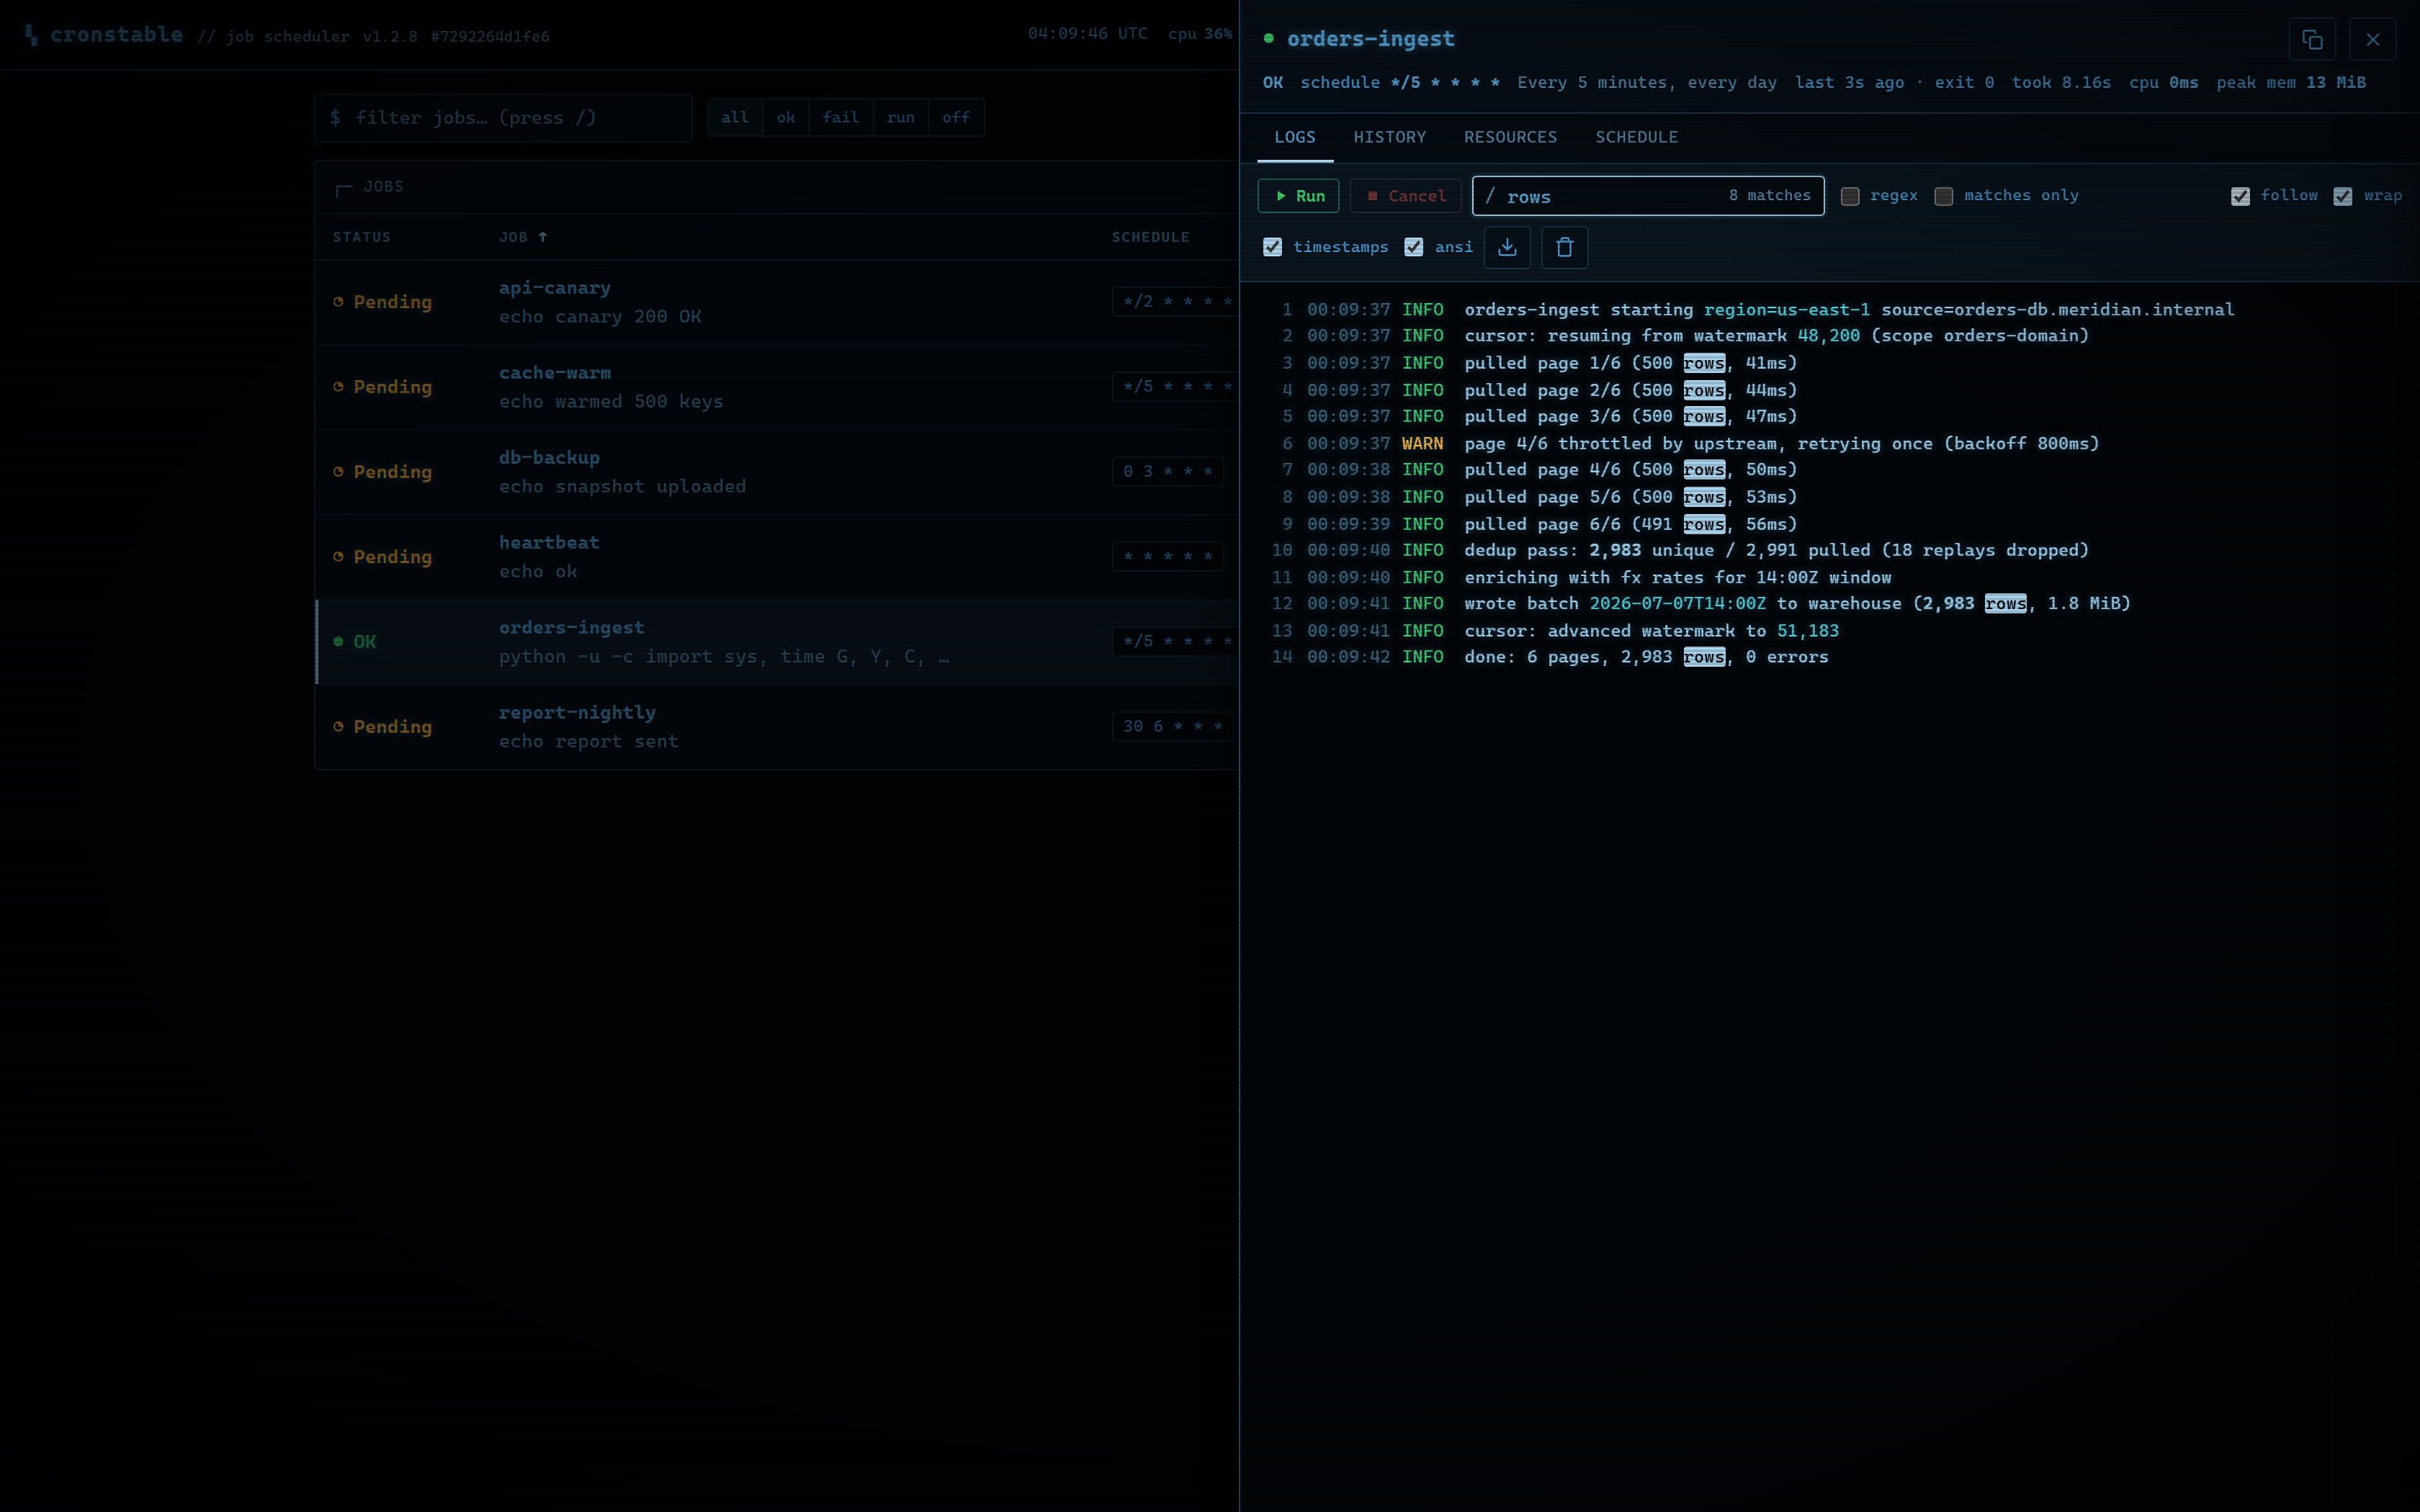
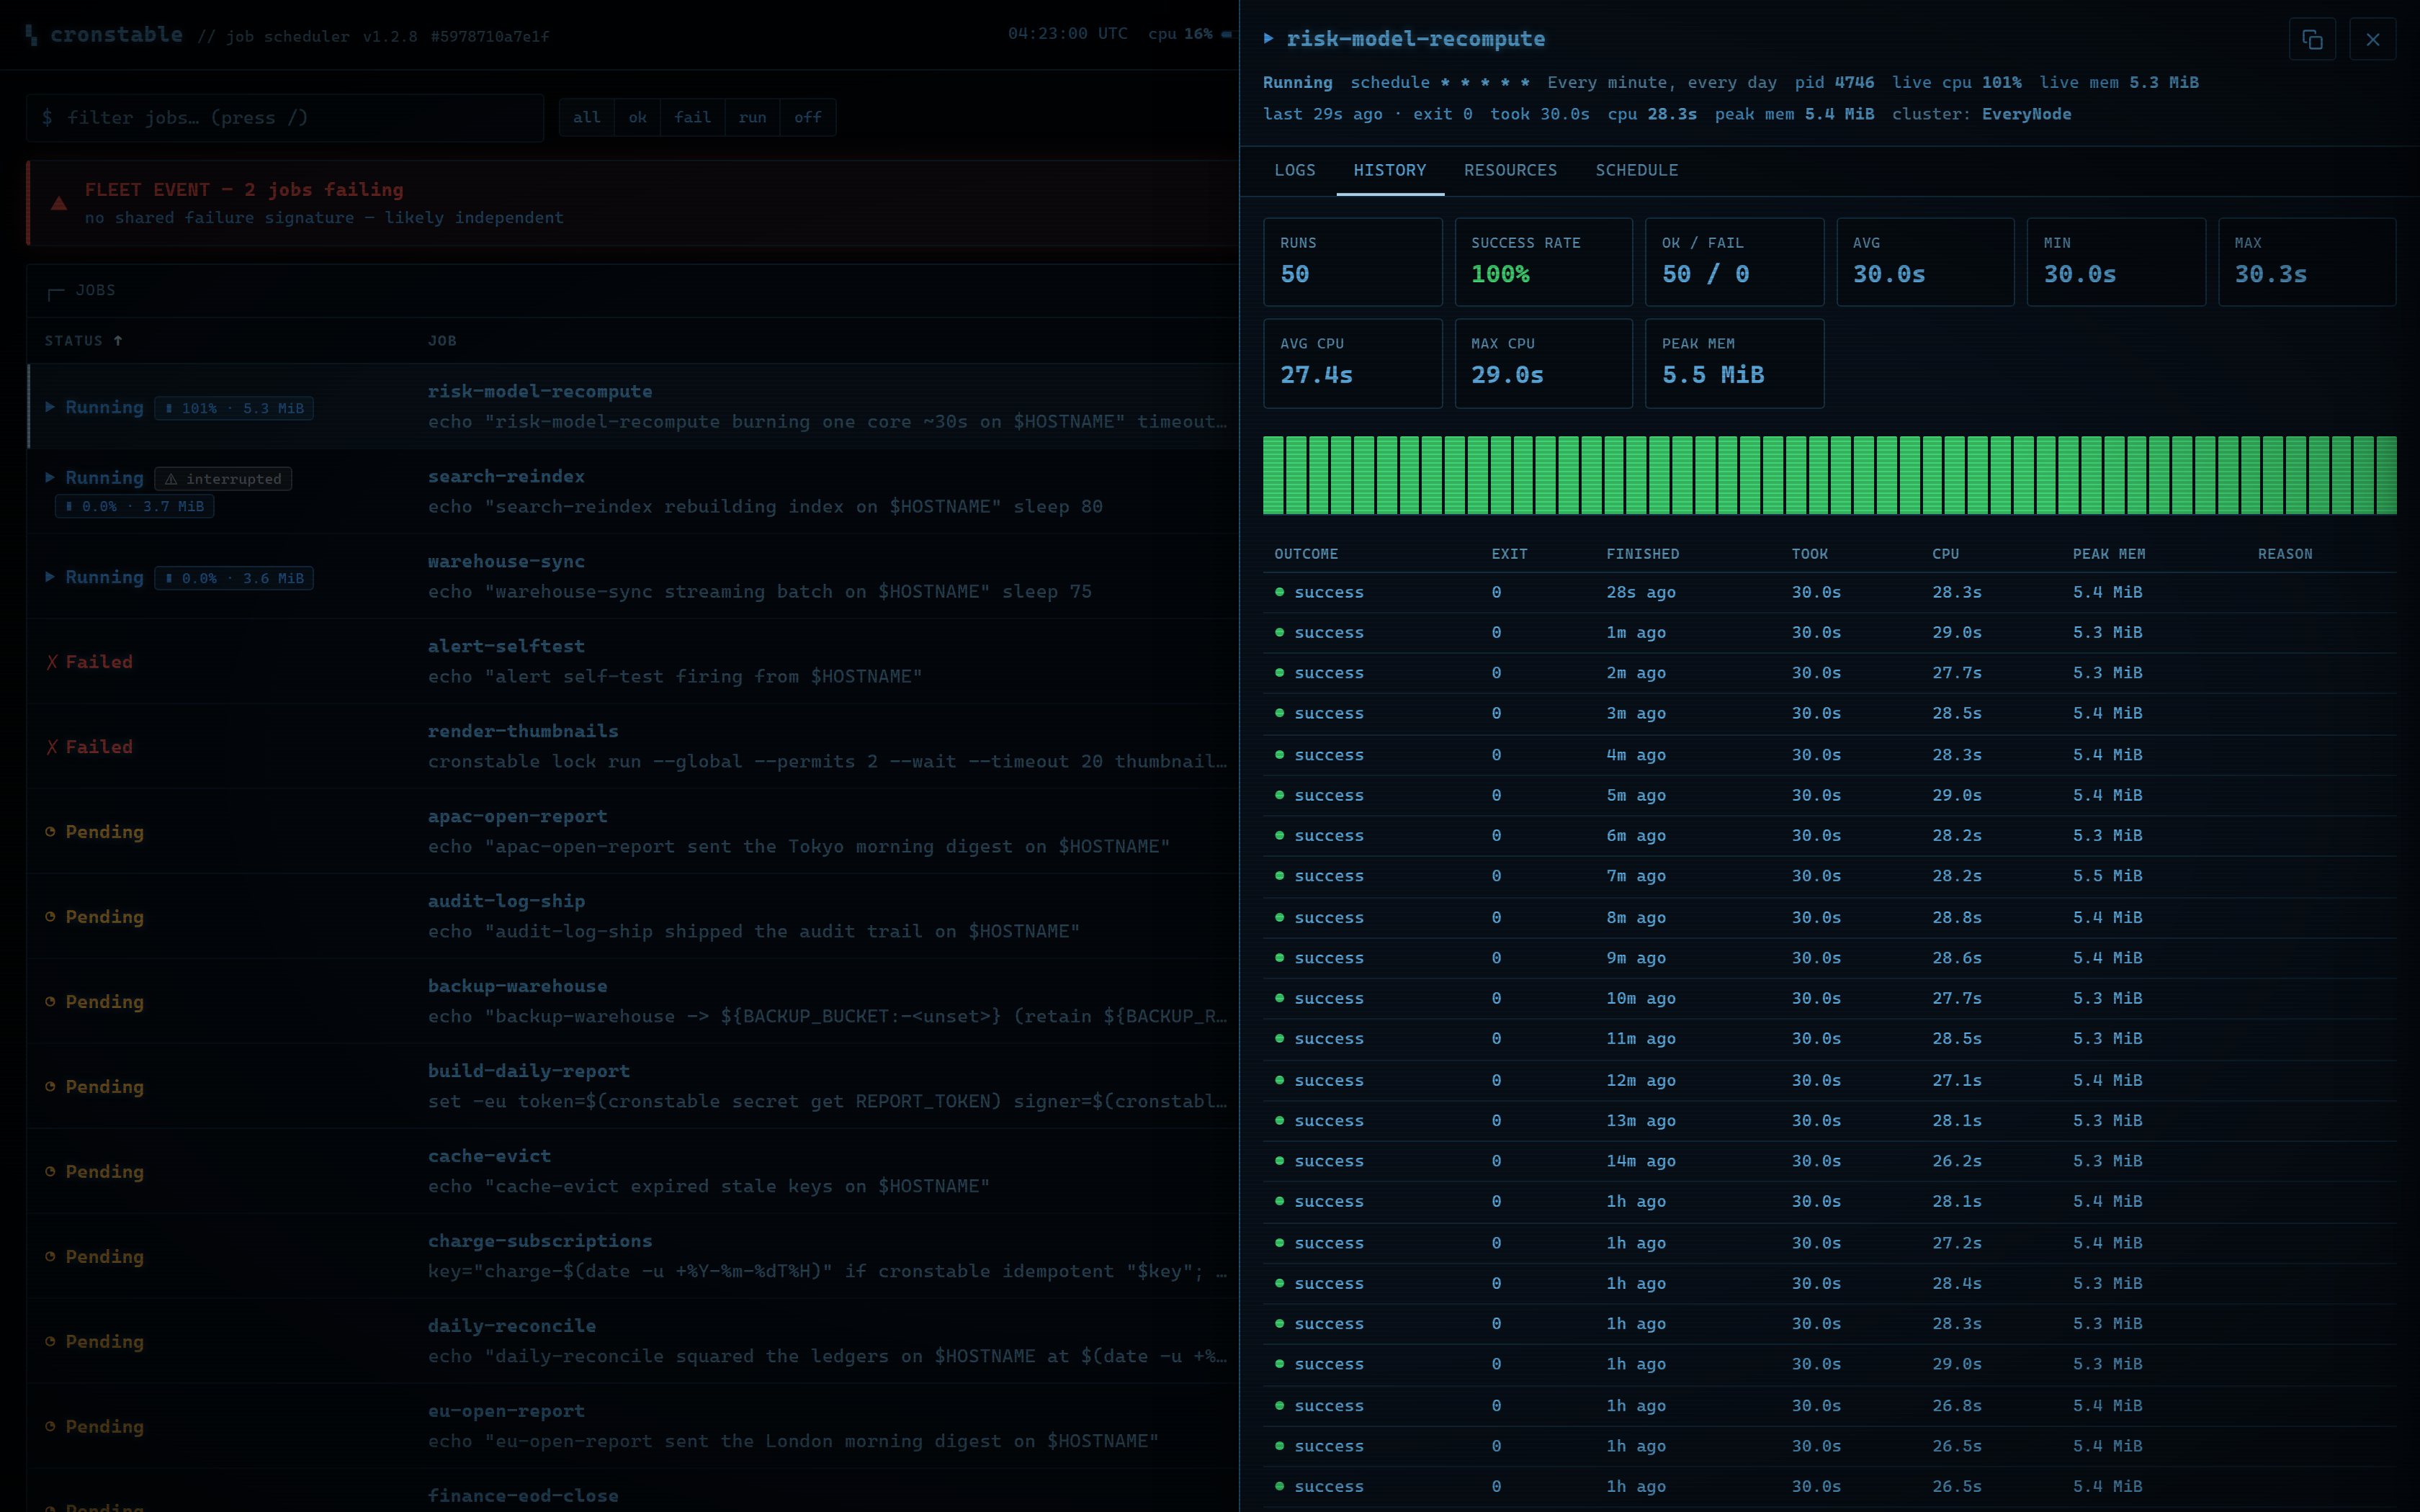
| Live log tail | Run history | Schedule, explained |
|---|---|---|
 |
 |
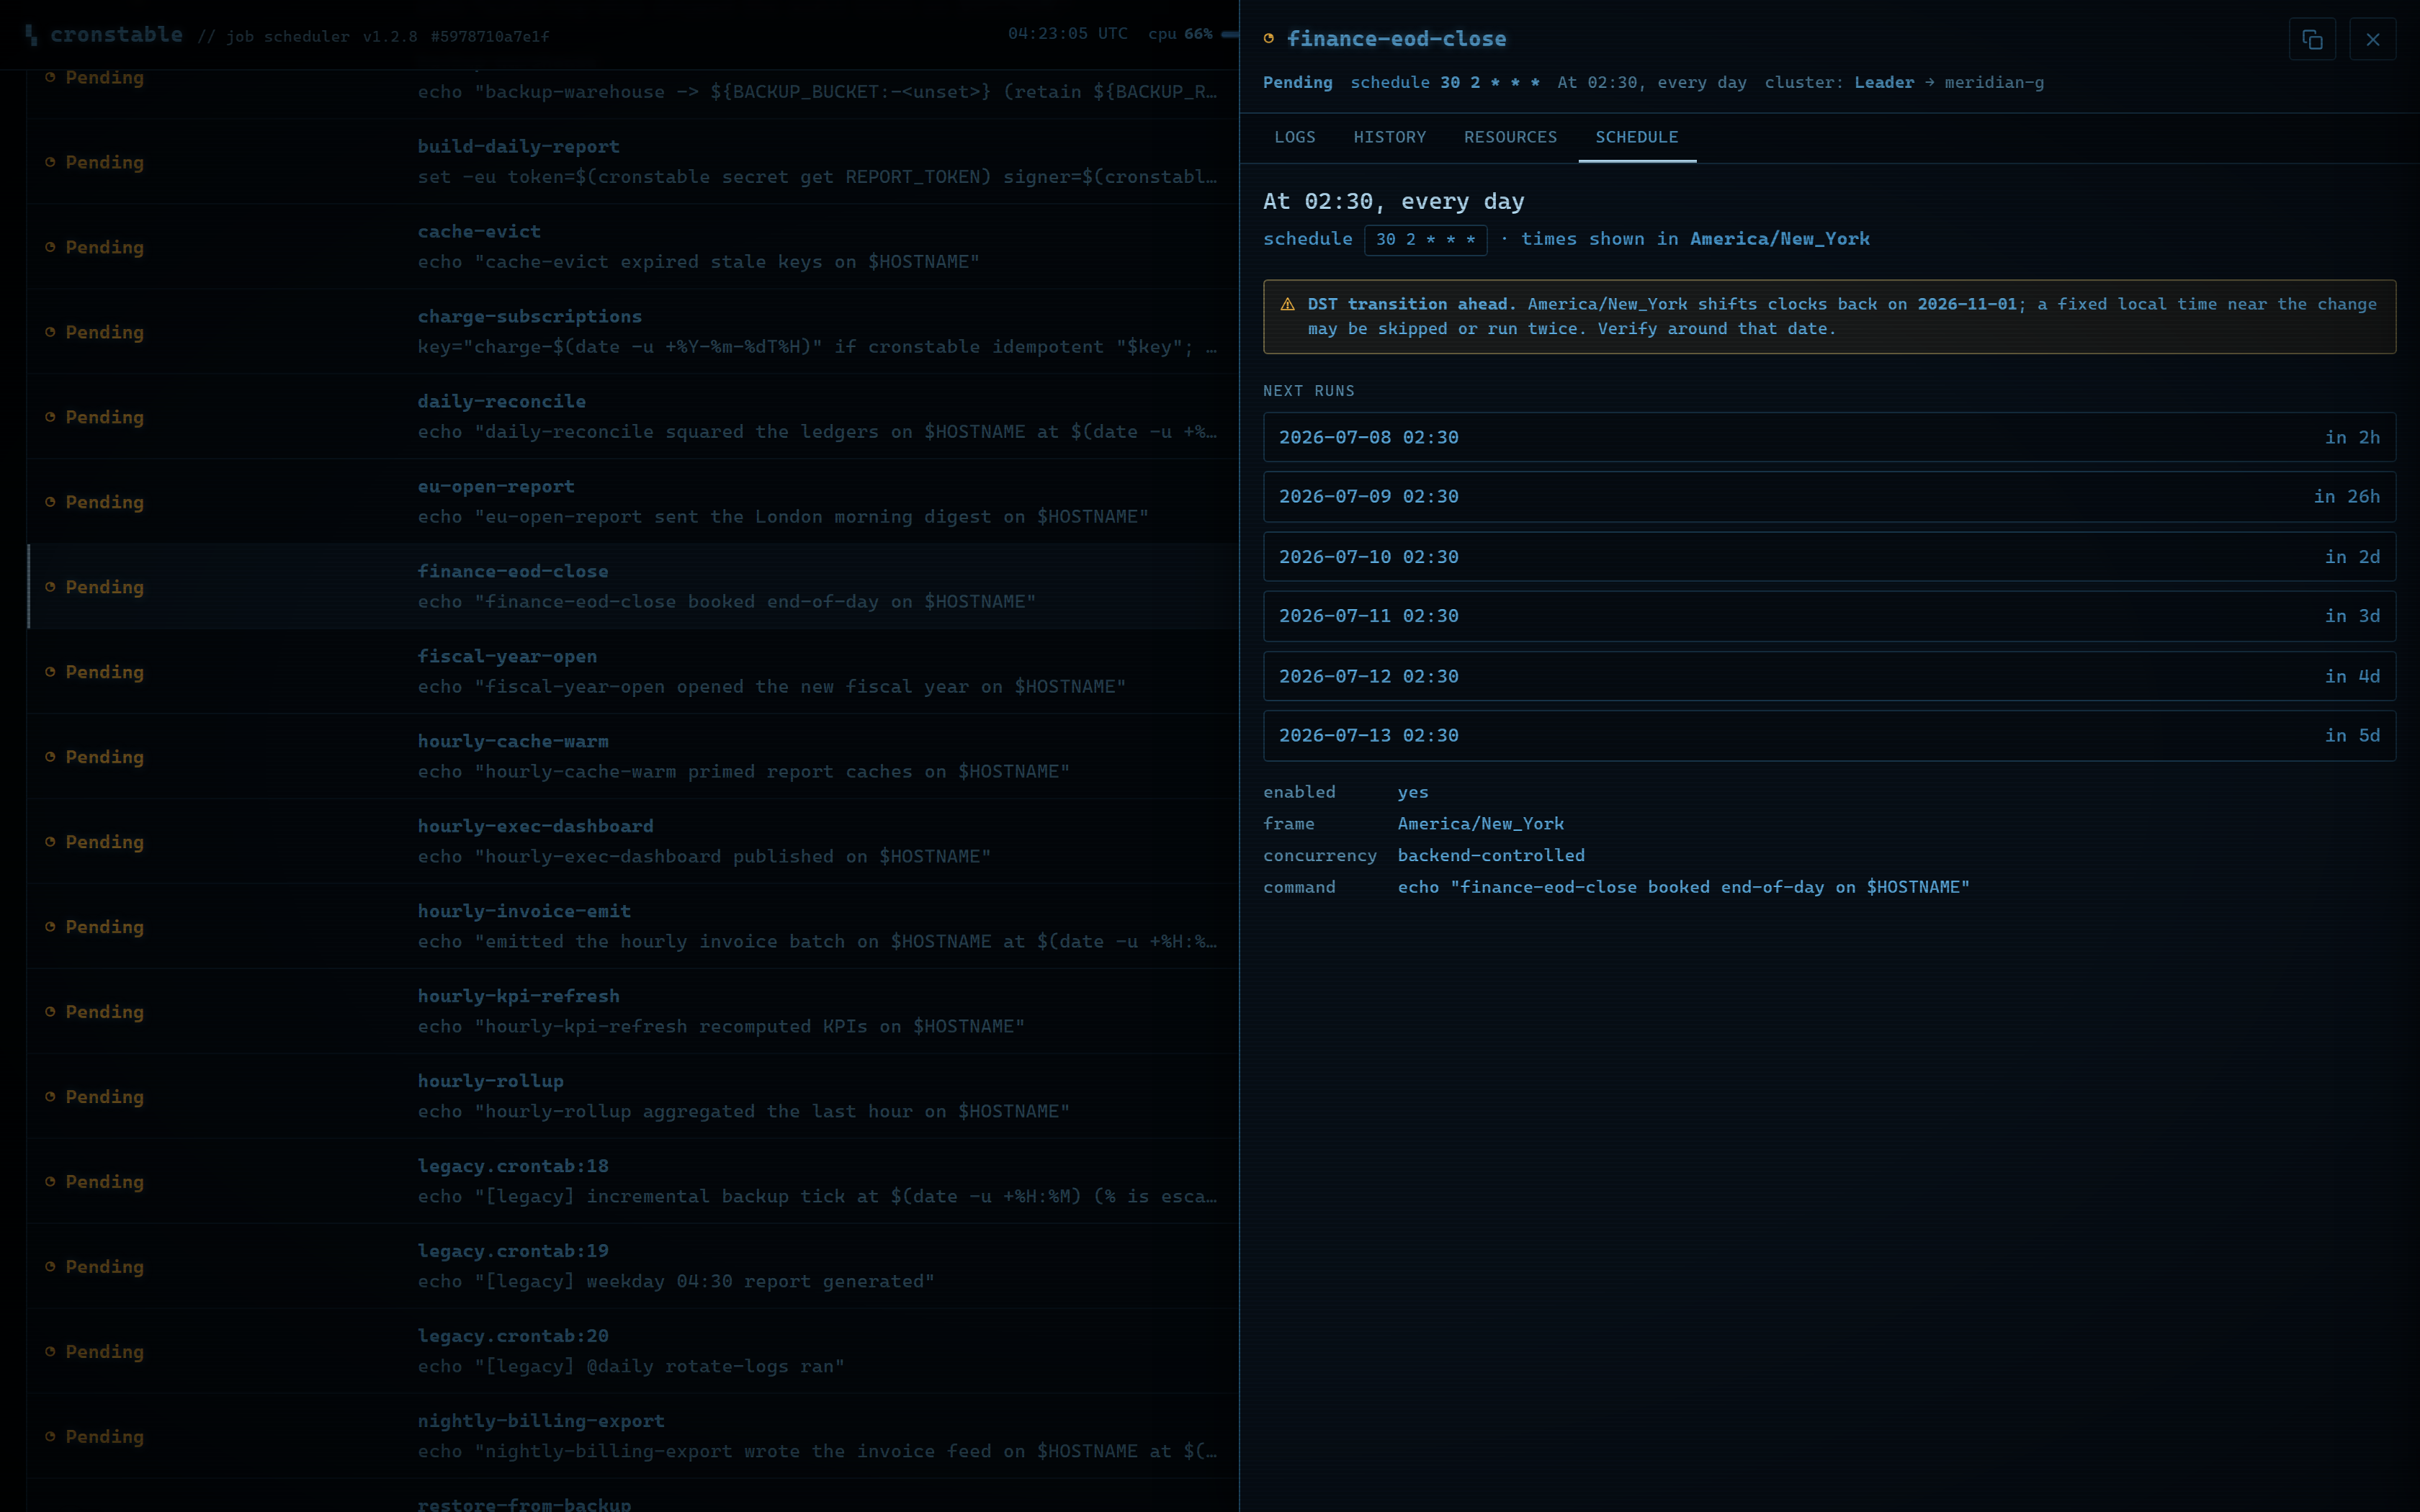 |
| Follow a running job's output live over Server-Sent Events, with ANSI color, in-log grep (plain text or regex), per-line timestamps, line-wrap, and one-click download. | Success rate plus average / min / max duration over the retained history, with a color-coded per-run chart; with resource monitoring on, CPU time and peak memory per run and in the stats. | A plain-English reading of the cron expression and a timezone-aware preview of the next run times, computed live in the browser. |
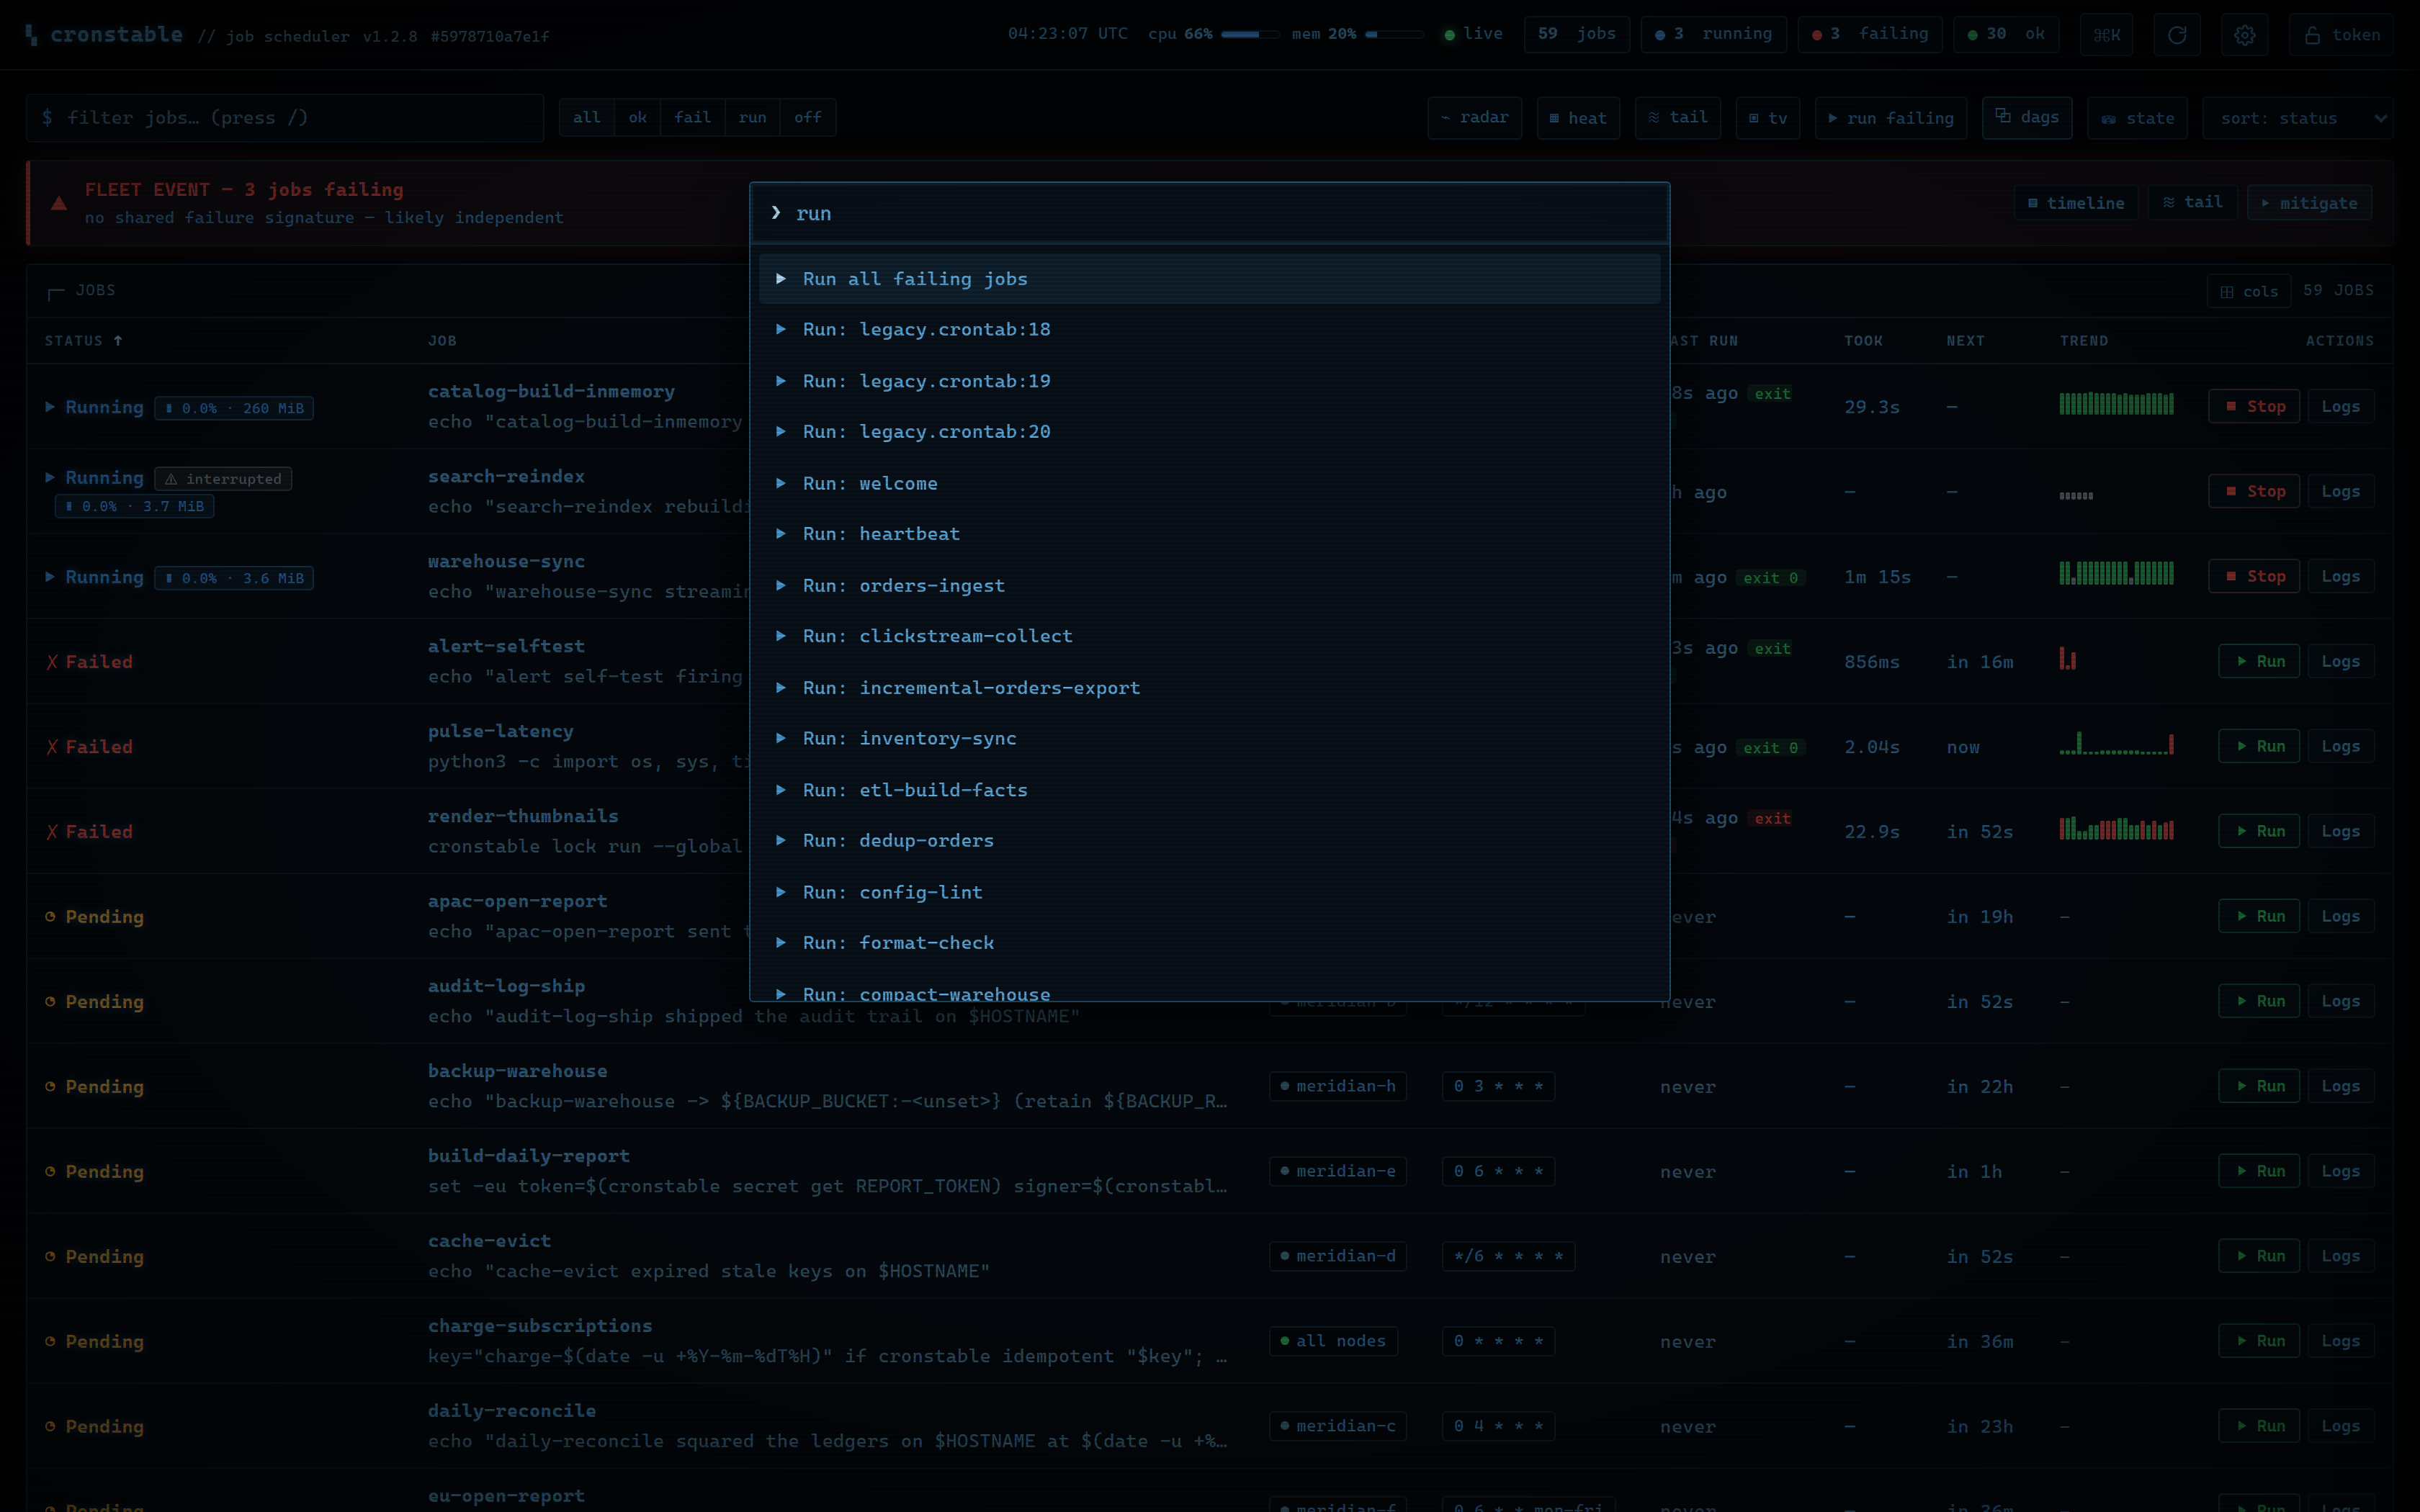
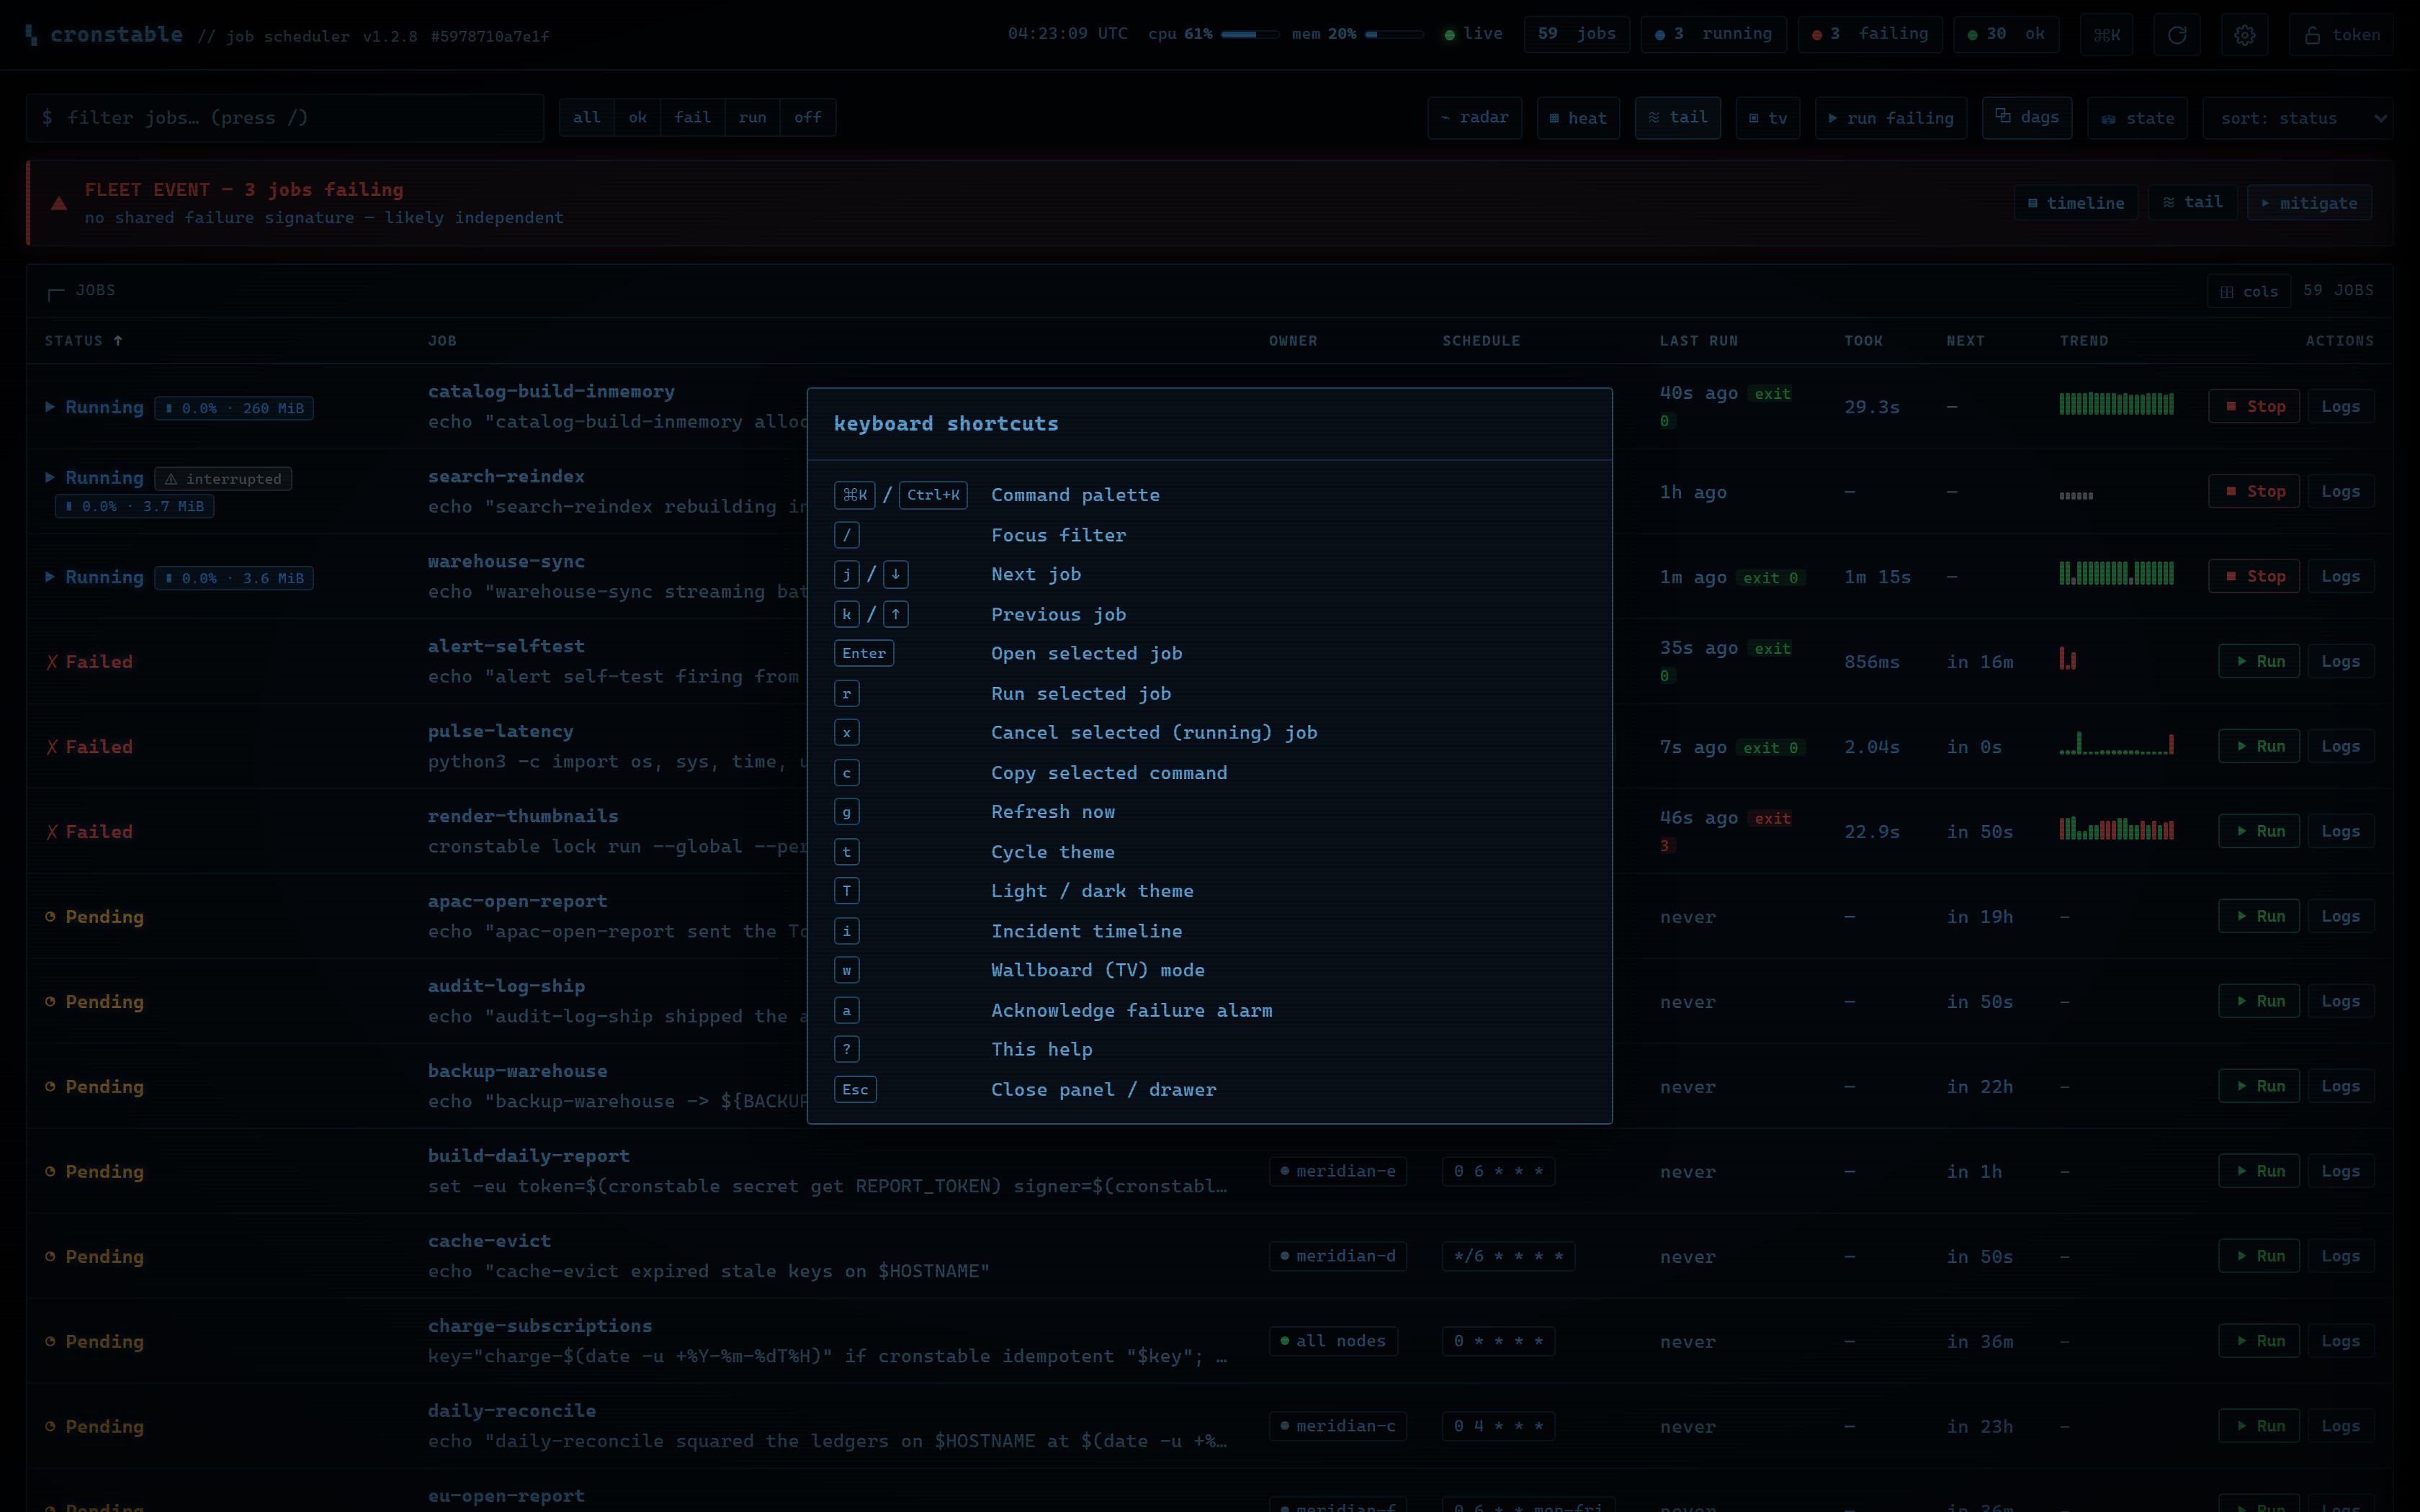
Everything is one keypress away: a fuzzy command palette (Ctrl-K / ⌘K)
runs any action or jumps to any job, ? lists every shortcut, / filters,
j/k move the cursor, r runs the selected job and x cancels it. You can
run a single job, or every failing job at once, on demand, with a click.
| Fuzzy command palette | Keyboard-first, with a shortcut for everything |
|---|---|
 |
 |
Orchestration, live
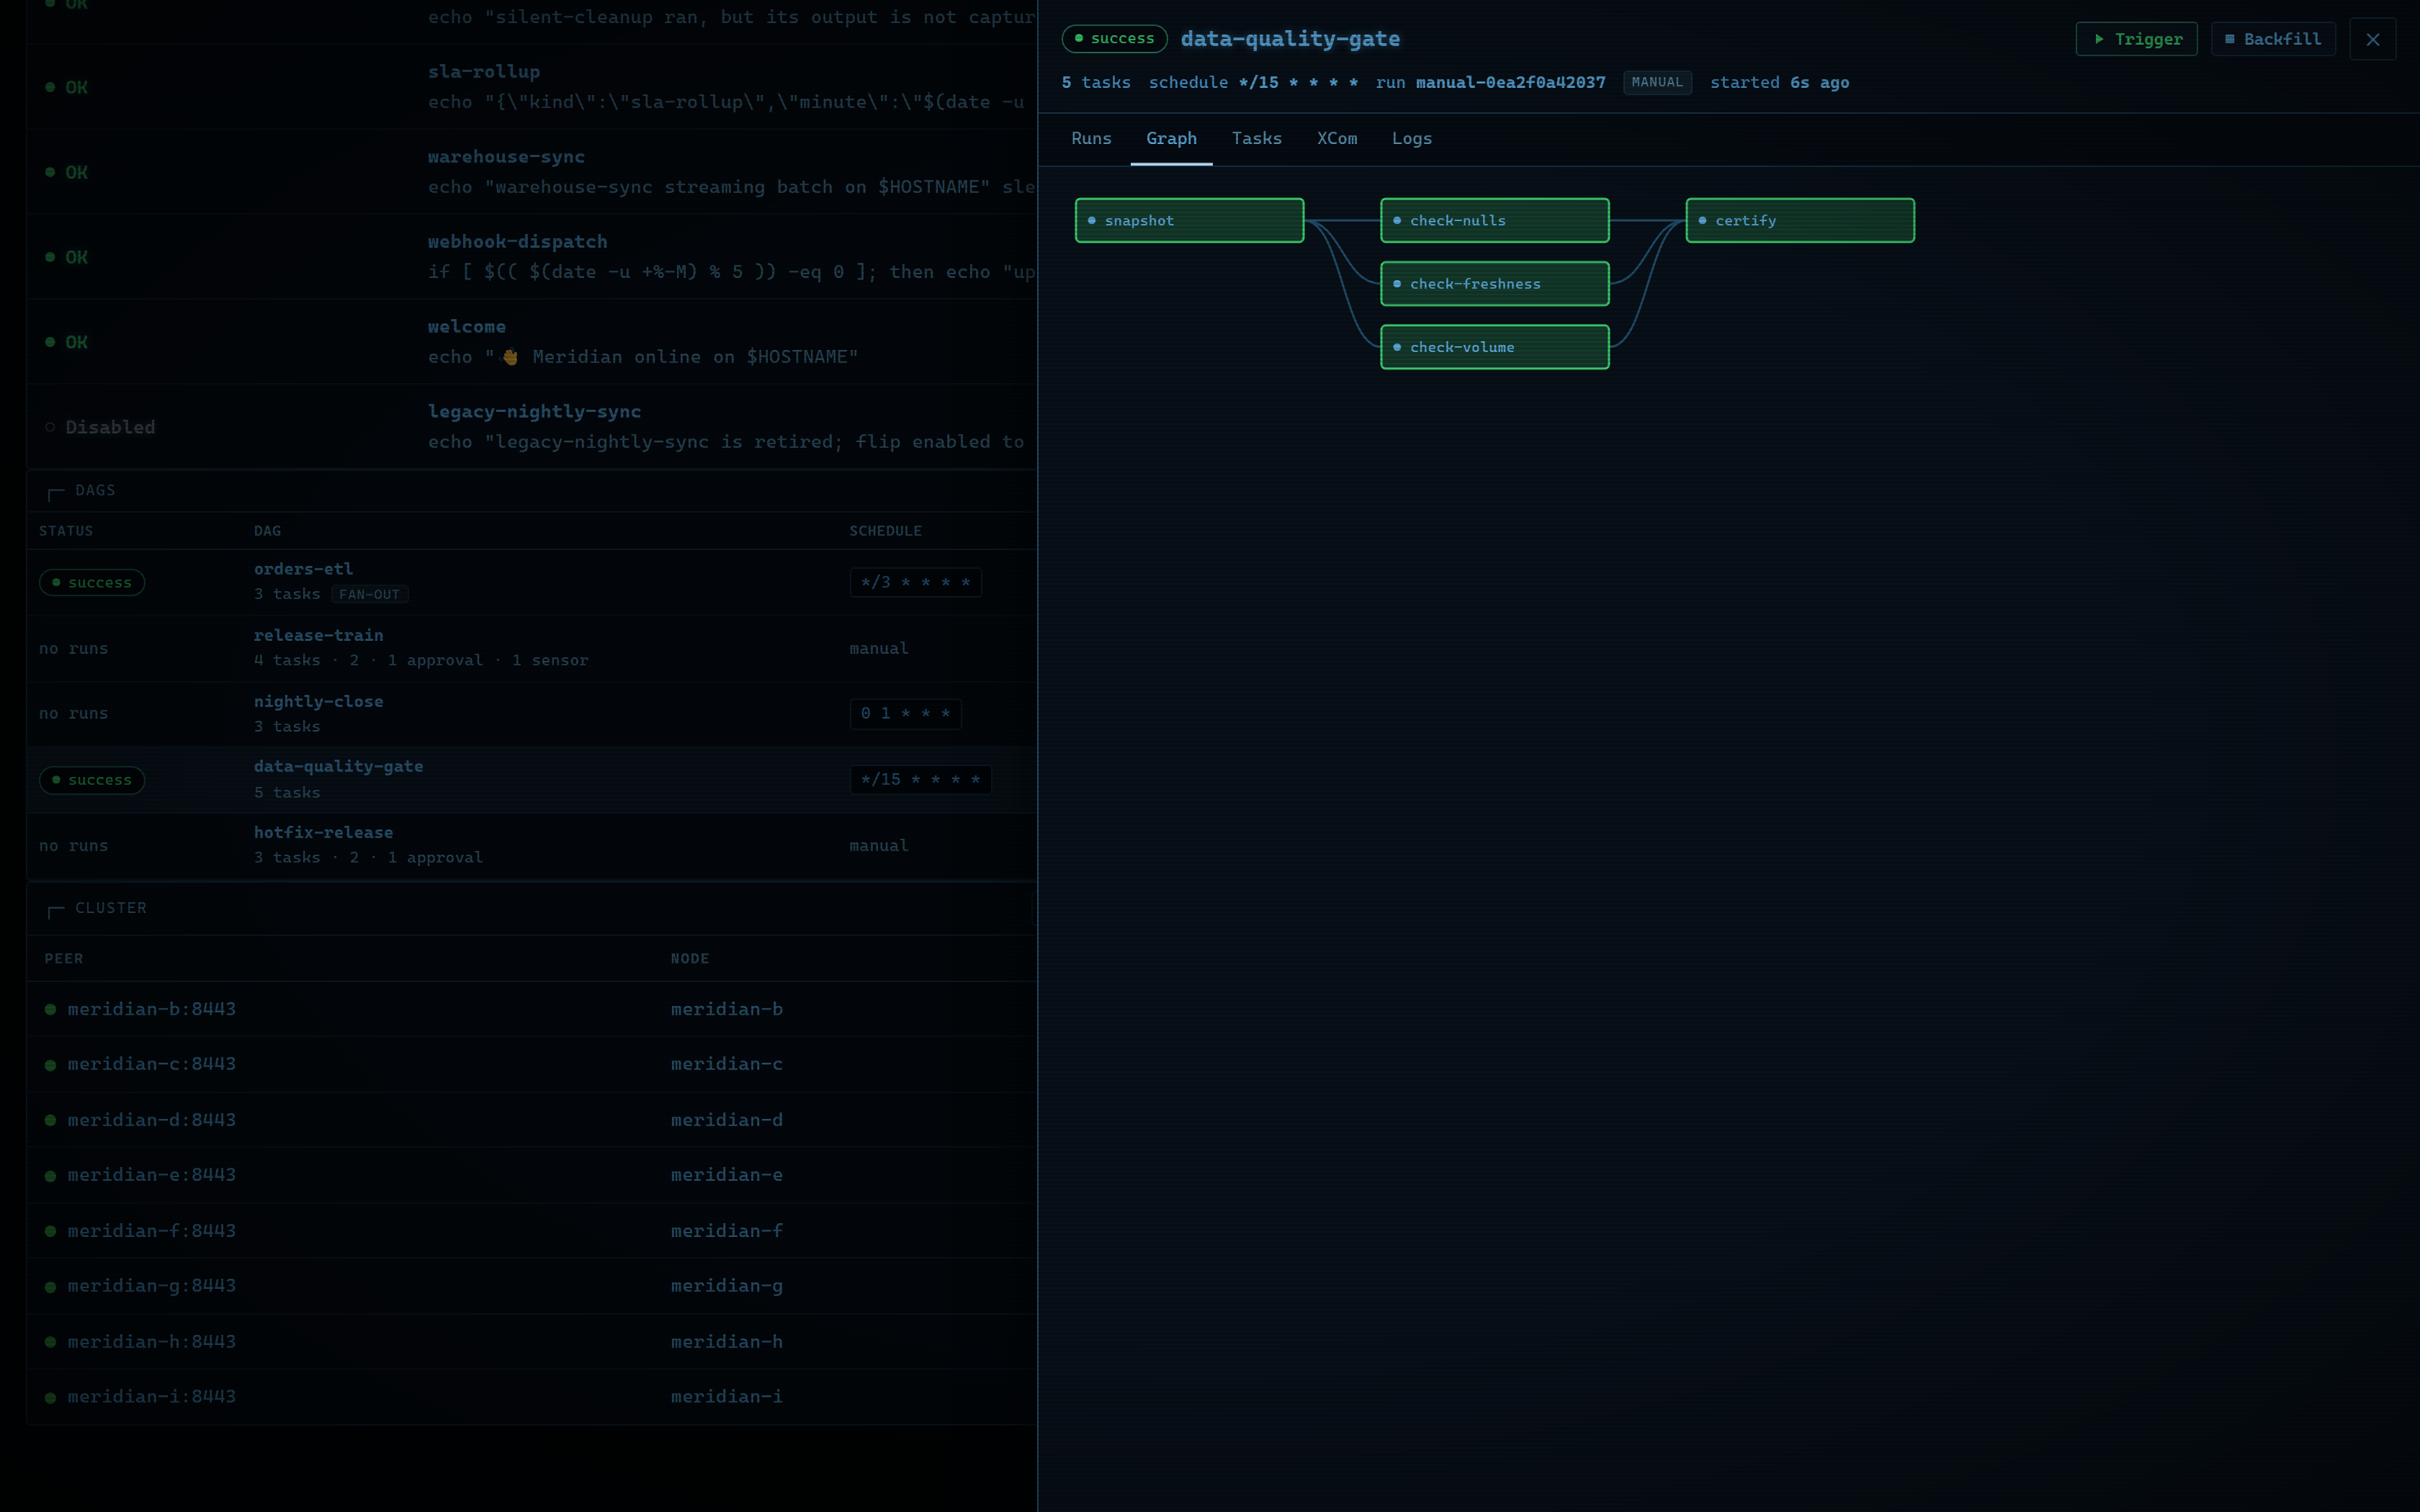
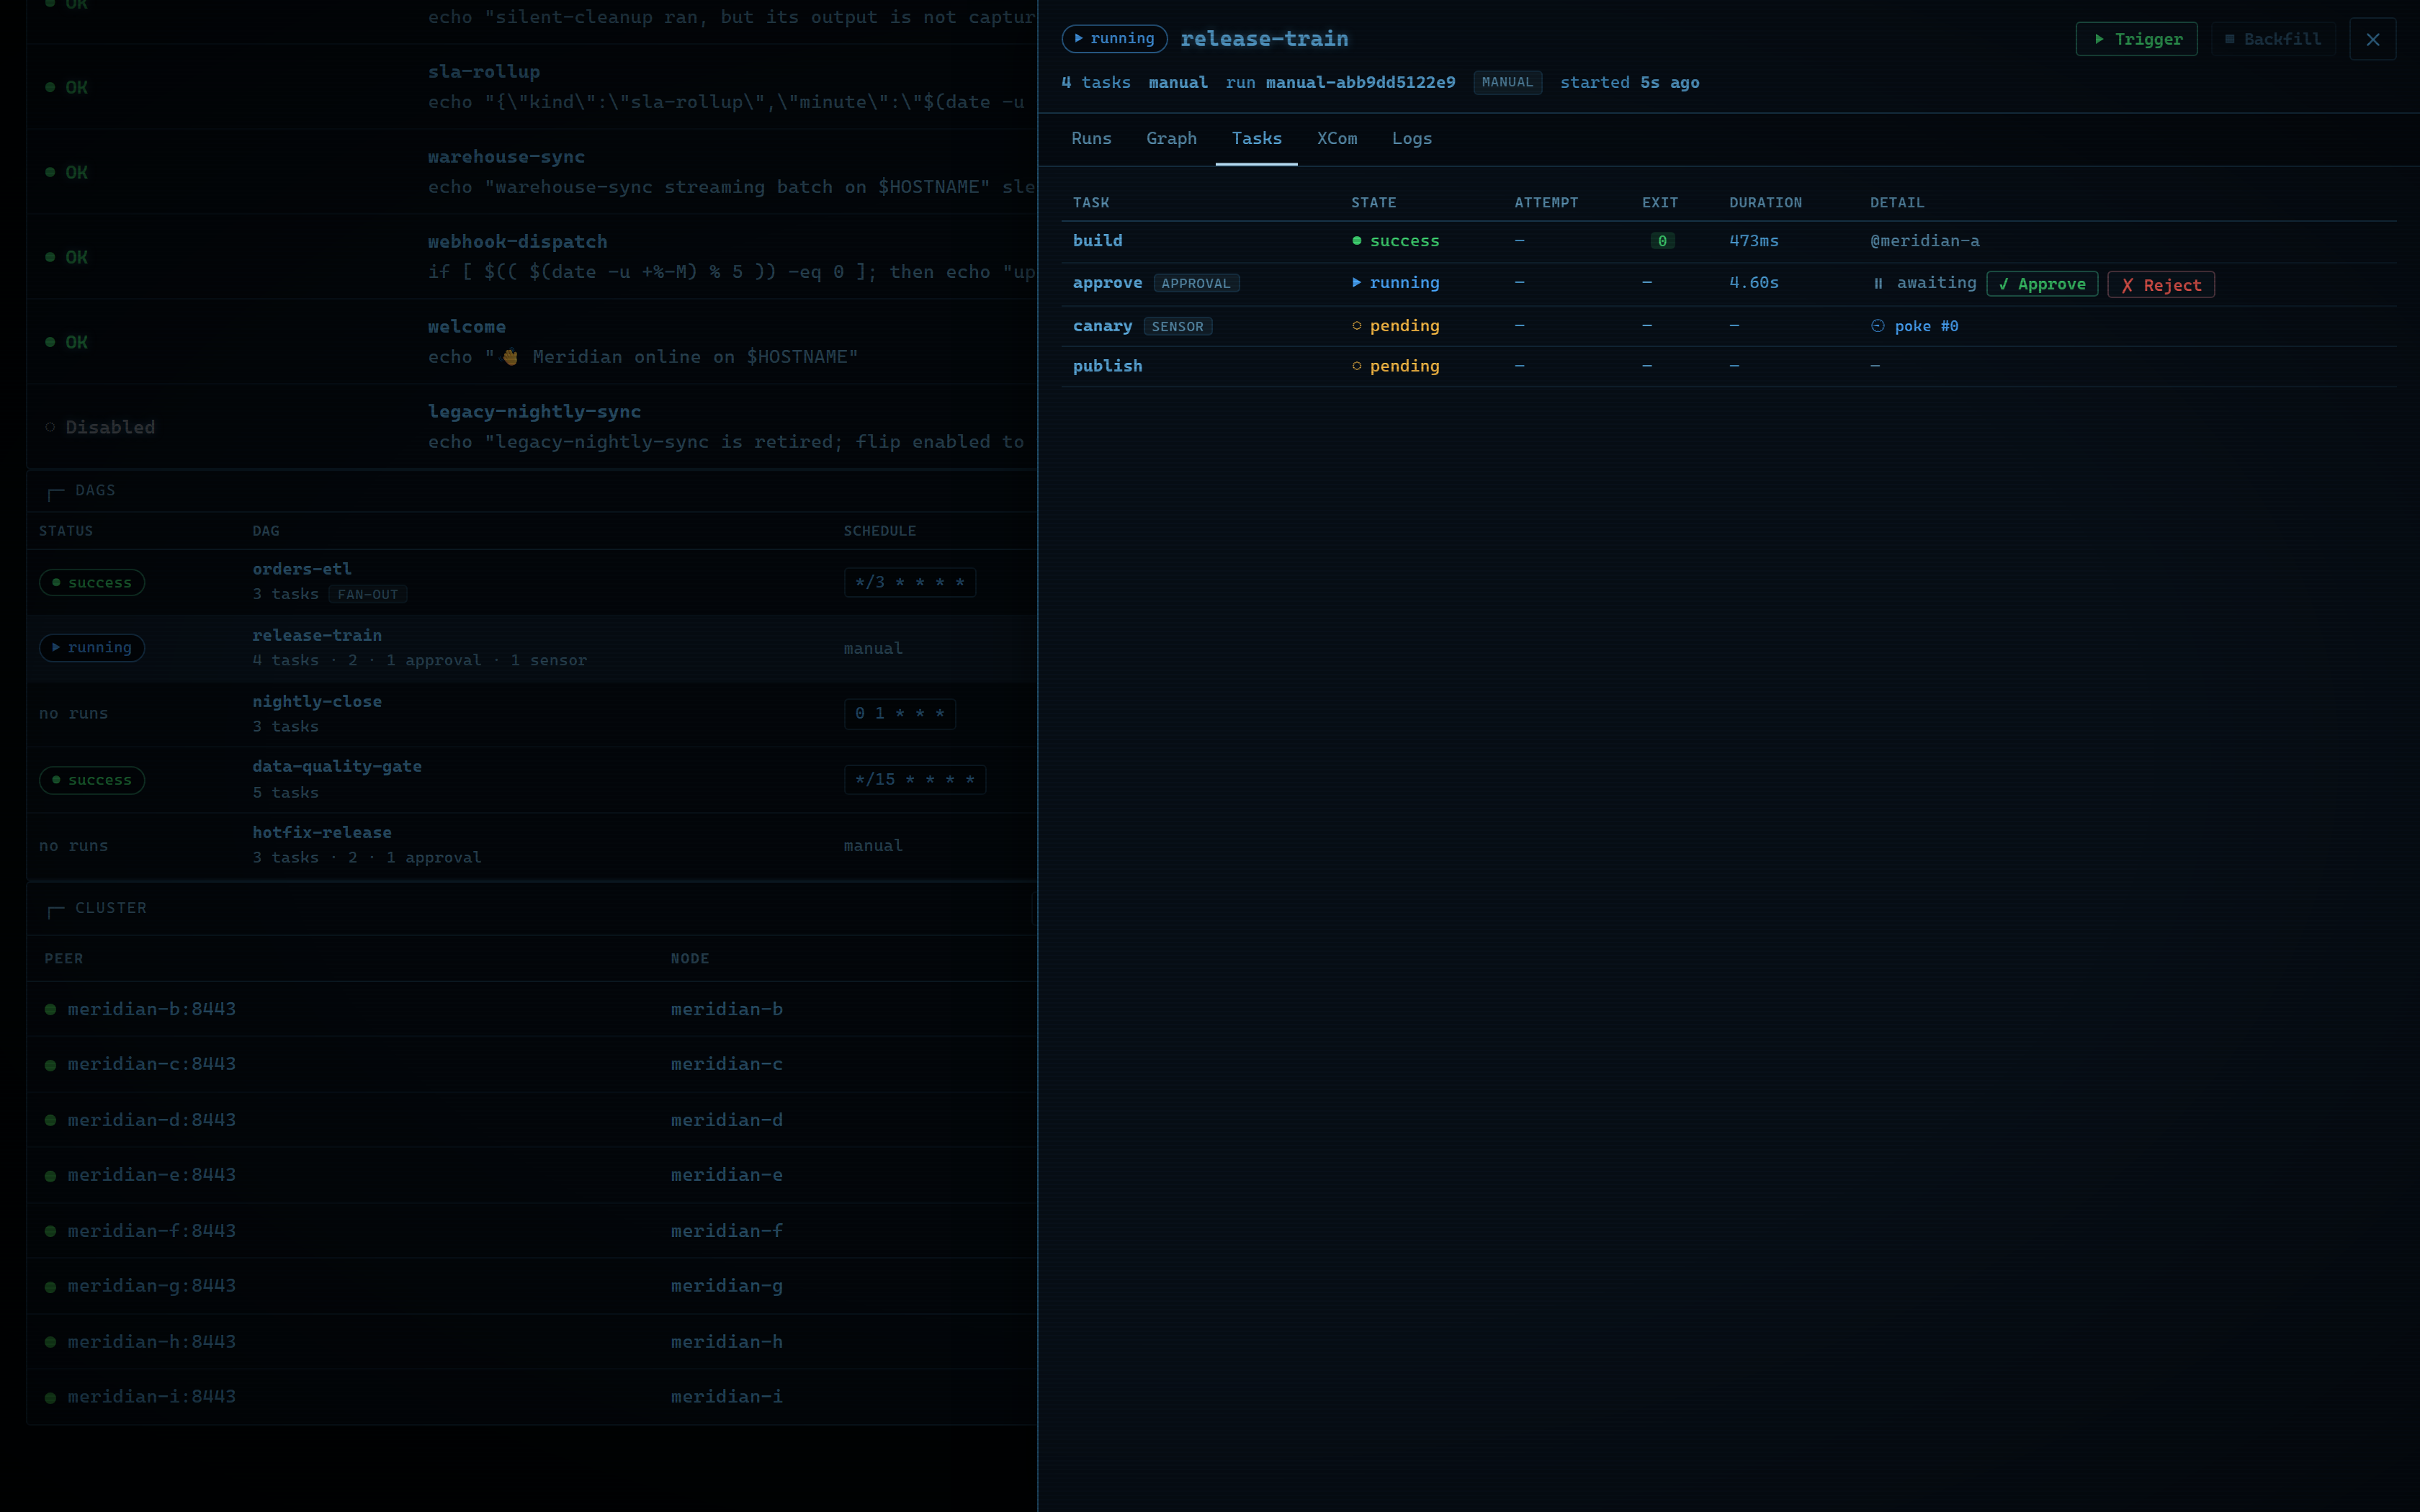
DAGs get their own card and drawer: trigger or backfill a run, watch the task graph advance node by node, inspect per-task attempts, XCom values and logs, and decide approval gates with a click, from any node in the fleet.
| The task graph | A human approval gate |
|---|---|
 |
 |
A data-quality-gate diamond: fan-out checks that reconverge on a certify task, colored by state as the run advances. |
A release train parked on a human: the build succeeded, the approval gate is awaiting, and the sensor and publish tasks queue behind your decision. |
The whole fleet on one page
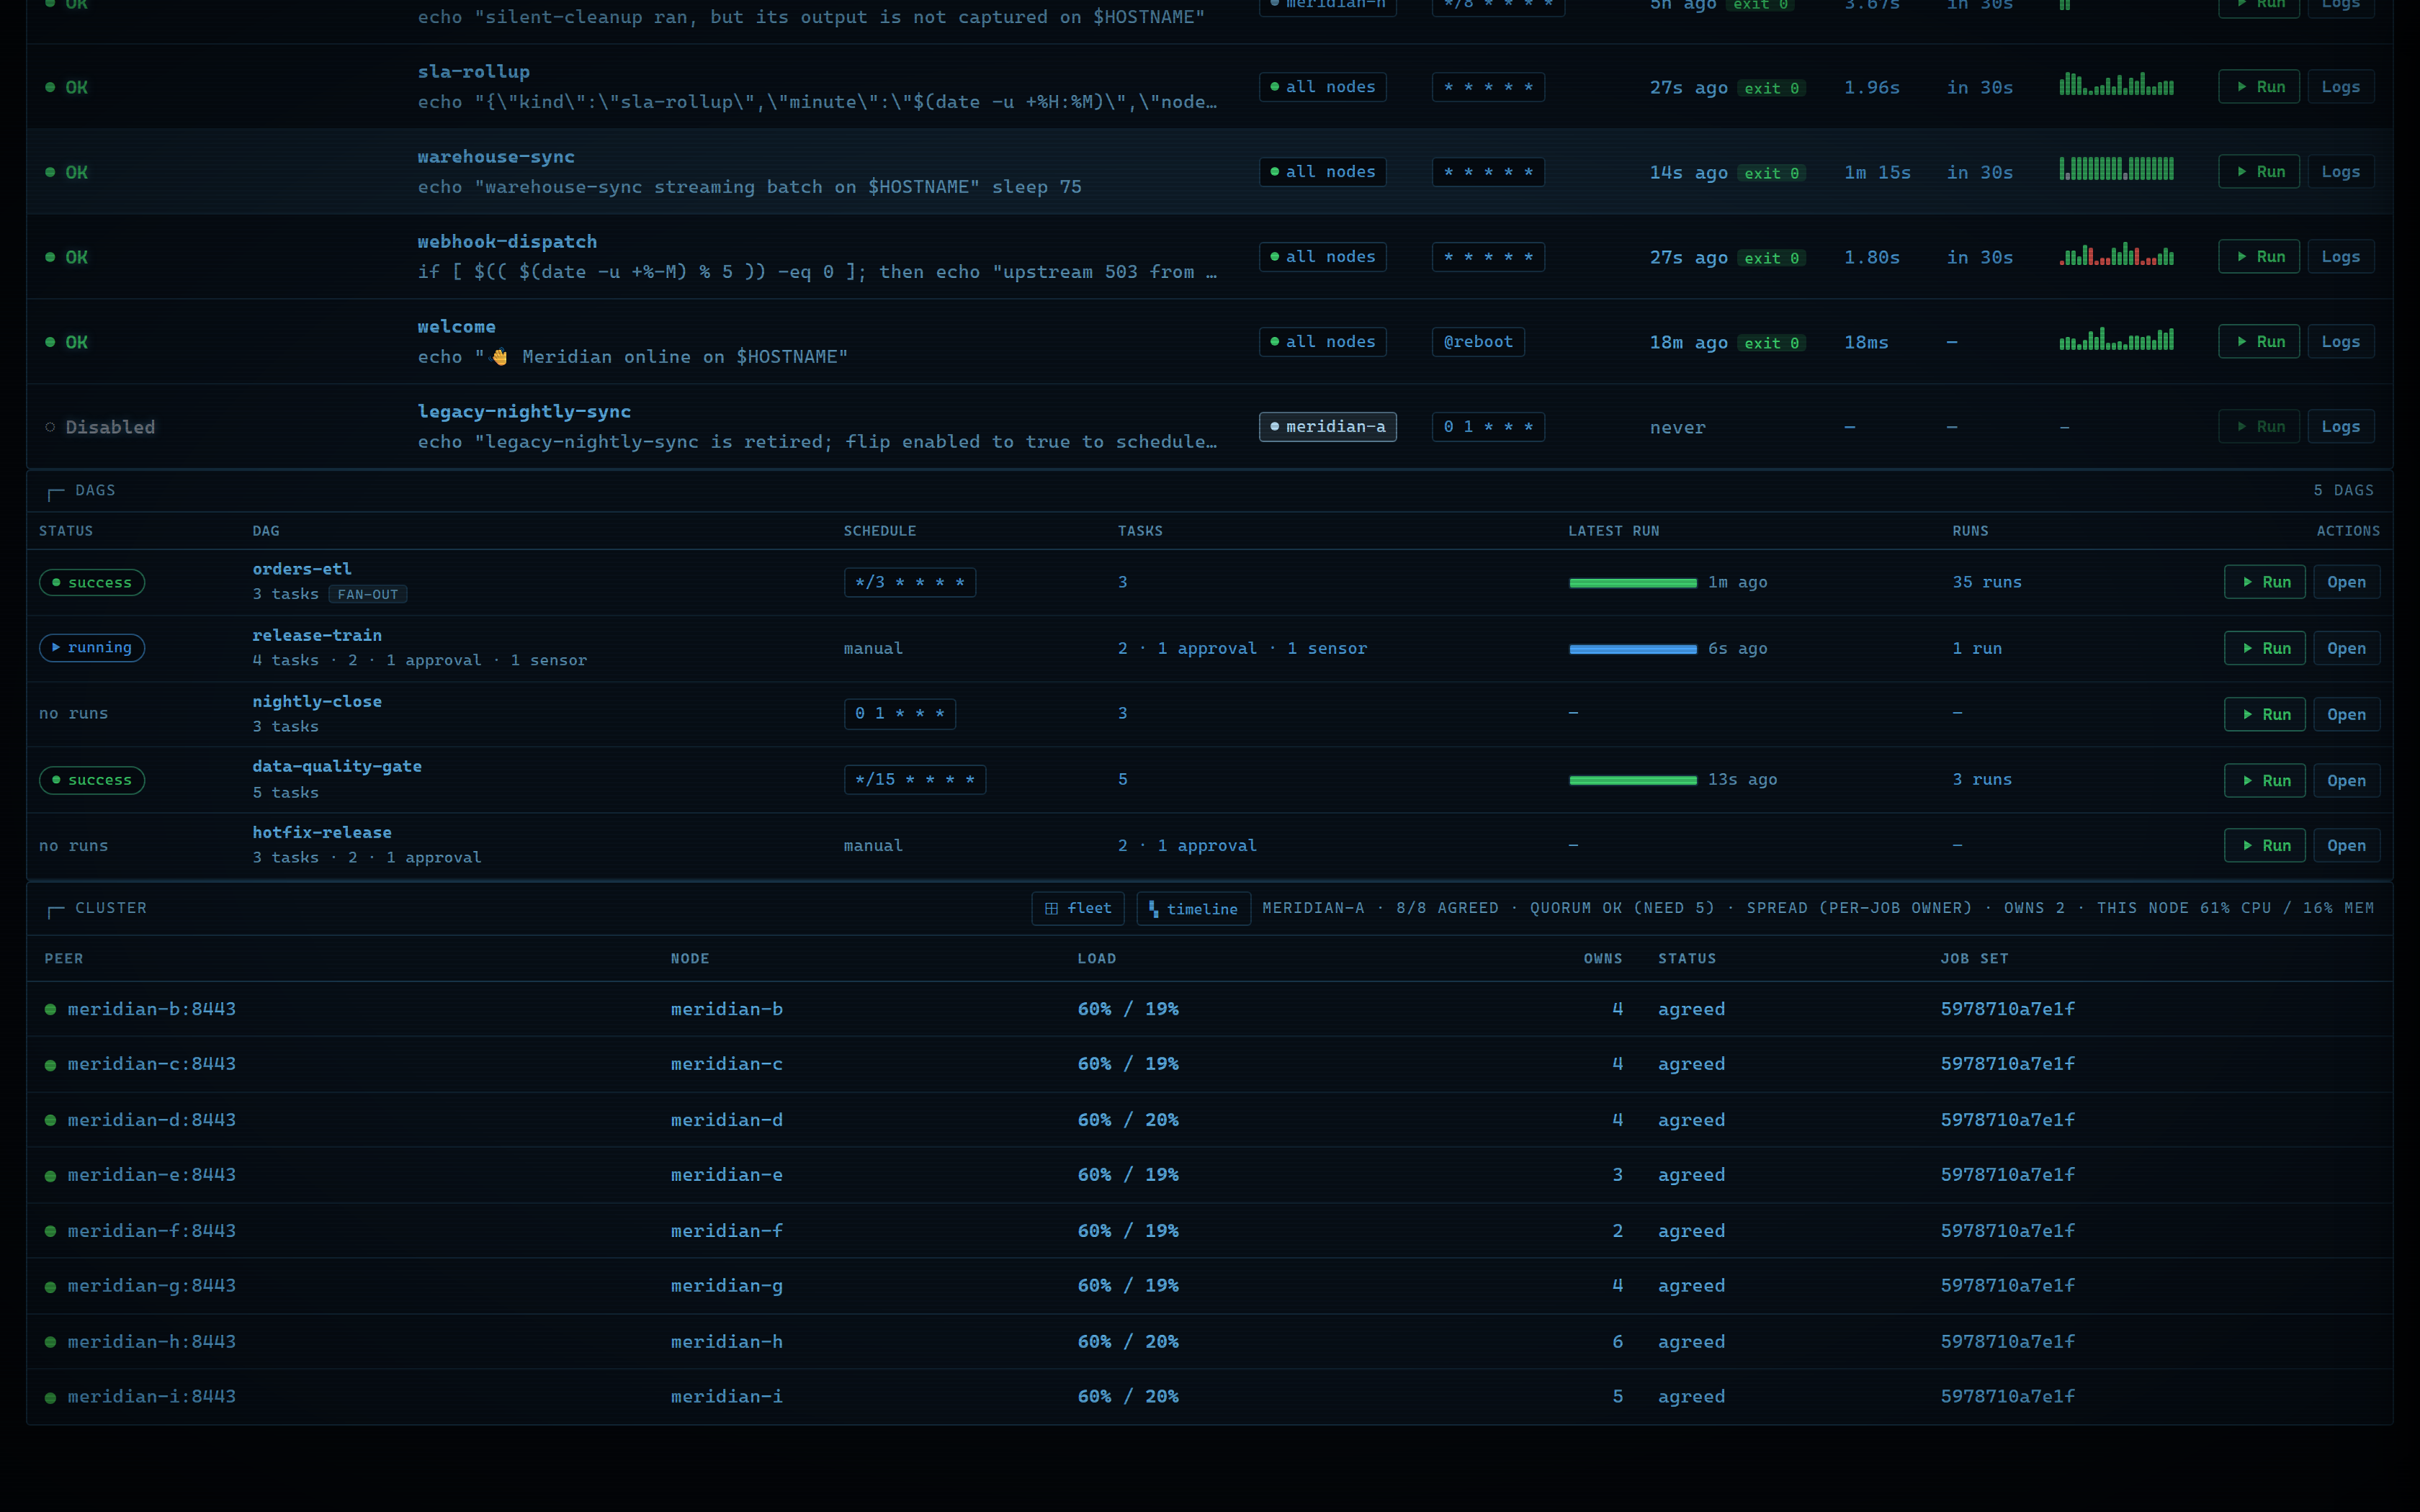
With clustering on, a cluster panel
shows the quorum math, this node's role, per-peer attestation status, and,
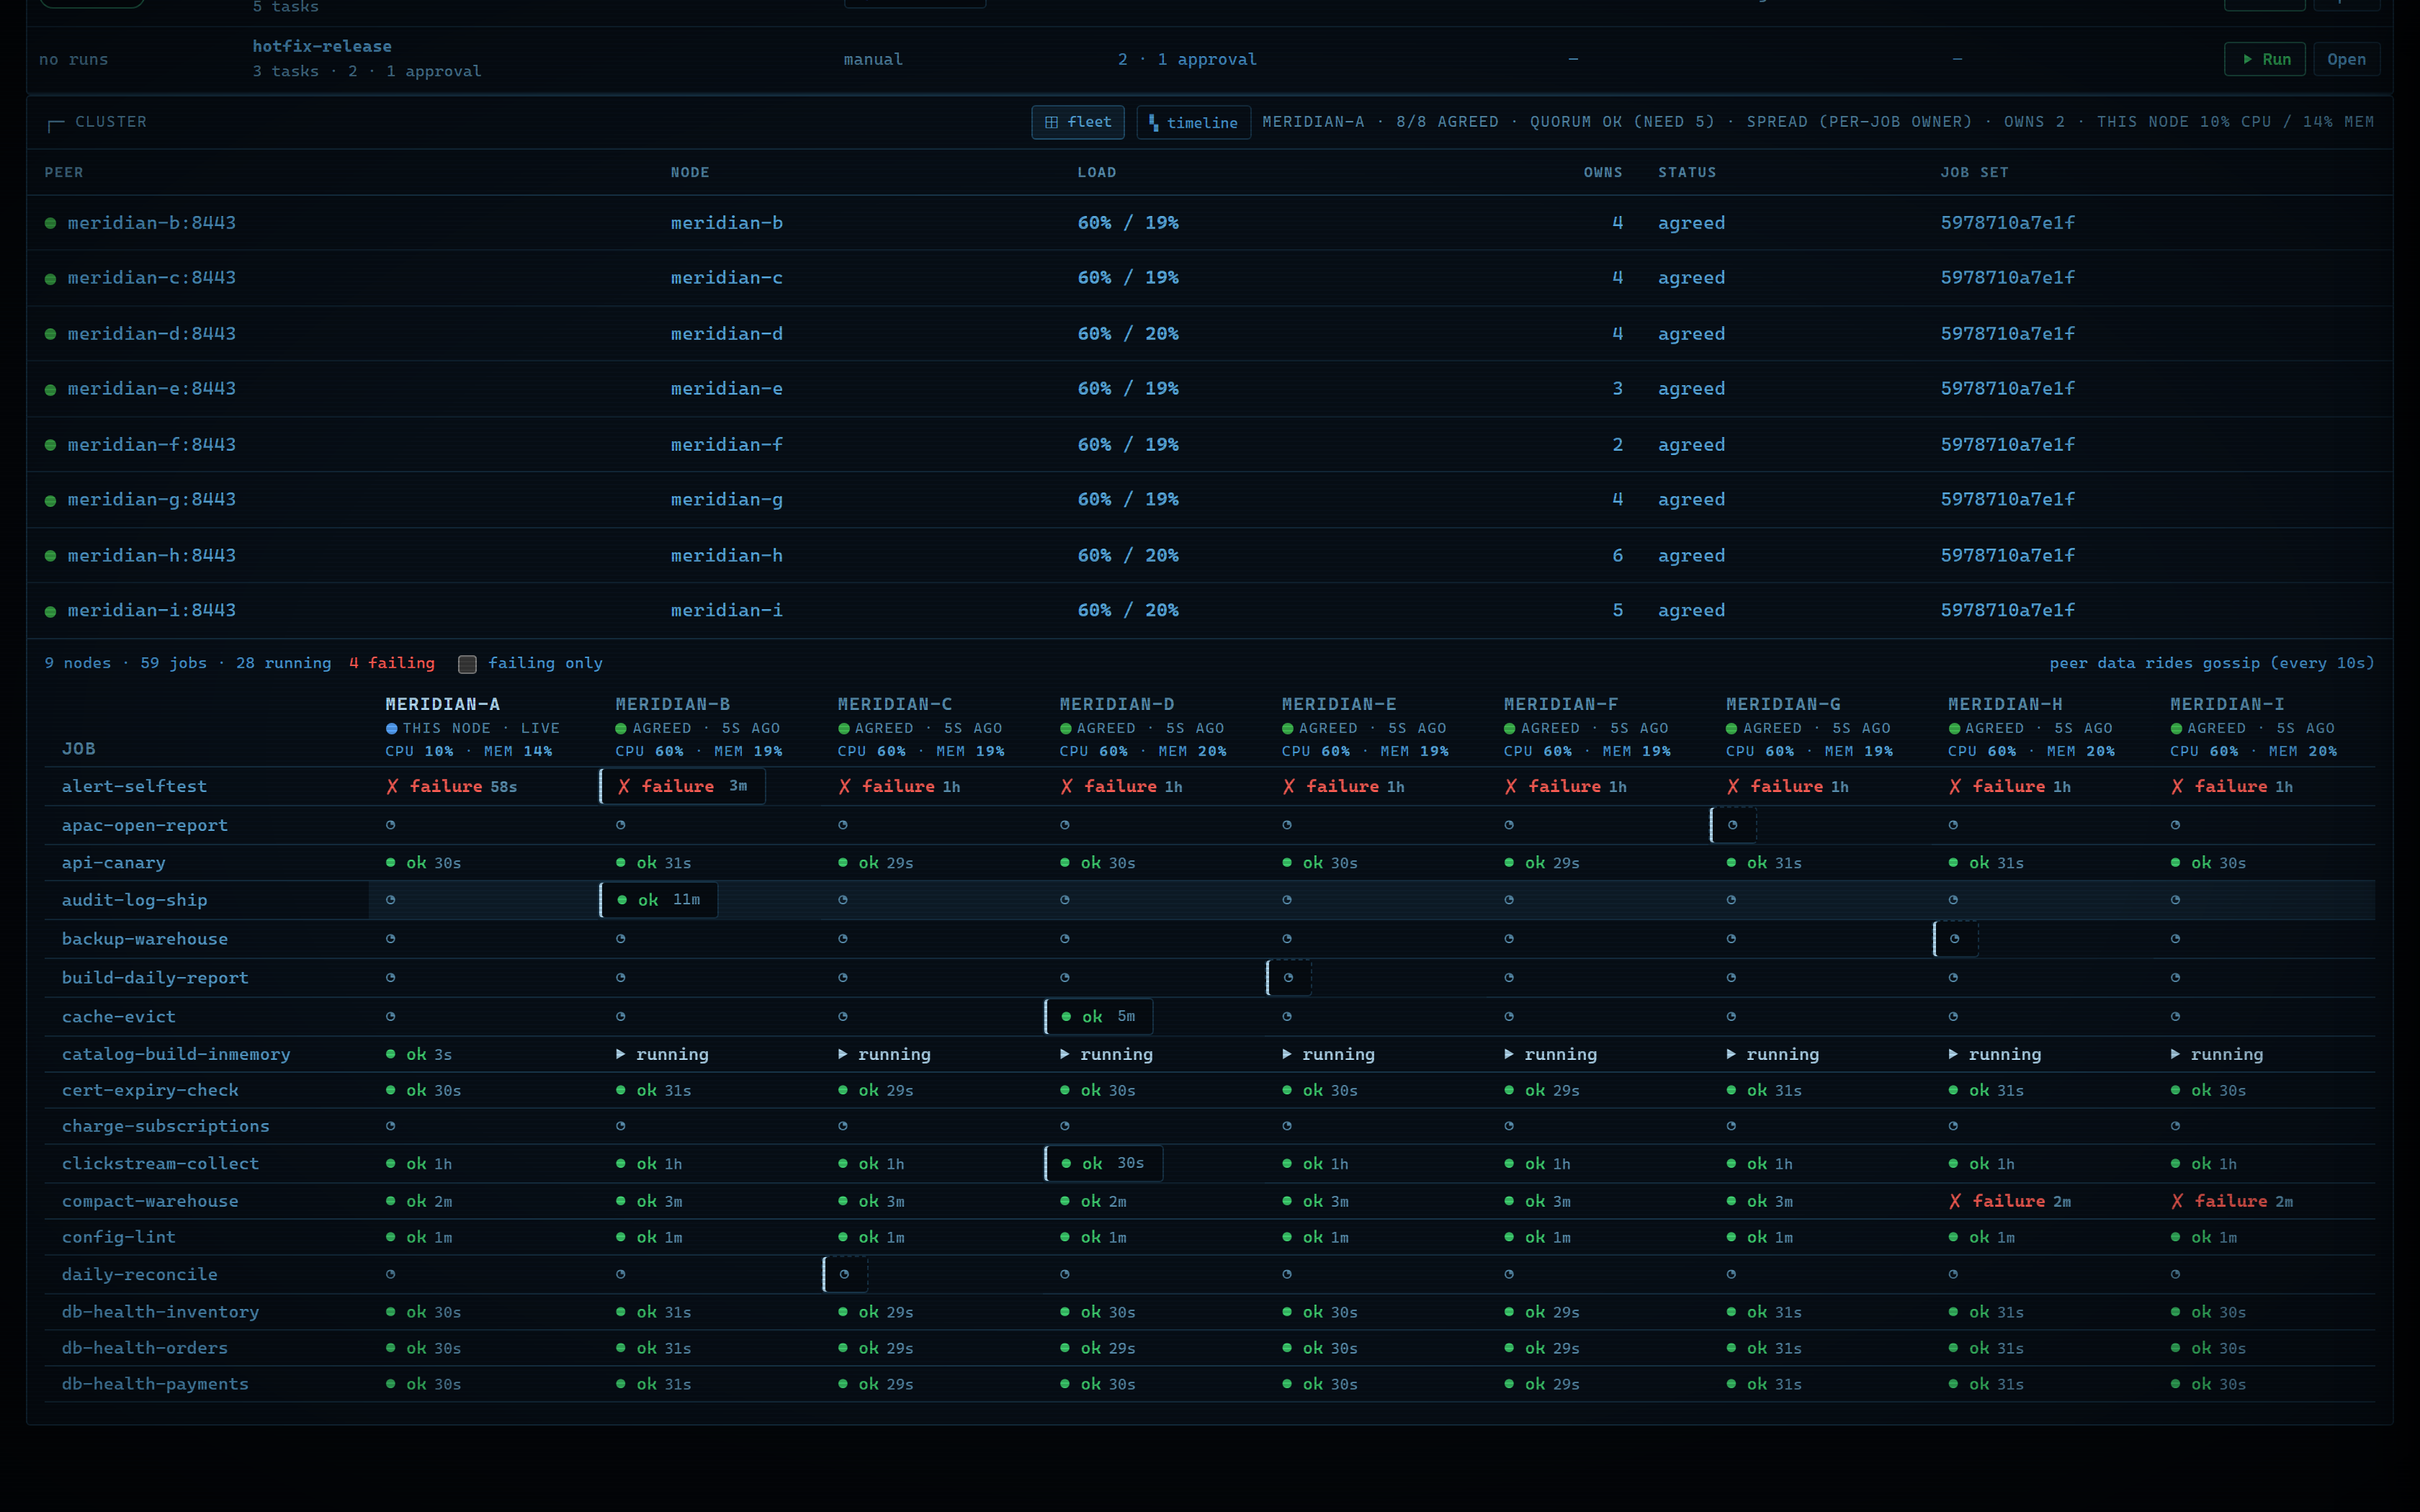
with cluster.observability, every node's whole-host CPU and memory. The
fleet view goes further: a jobs × nodes matrix of the entire fleet's runs,
assembled from data that piggybacks on the gossip the nodes already exchange,
so any node can serve the single pane of glass.
| Cluster panel | Fleet view |
|---|---|
 |
 |
Nine nodes, 8/8 agreed, quorum met, per-node load meters and per-node owns counts under distribution: spread. |
Every node's state for every job, one glance: ok / failing / running cells with ages, per-column node health, and a failing only filter. |
Built for the 3 a.m. incident
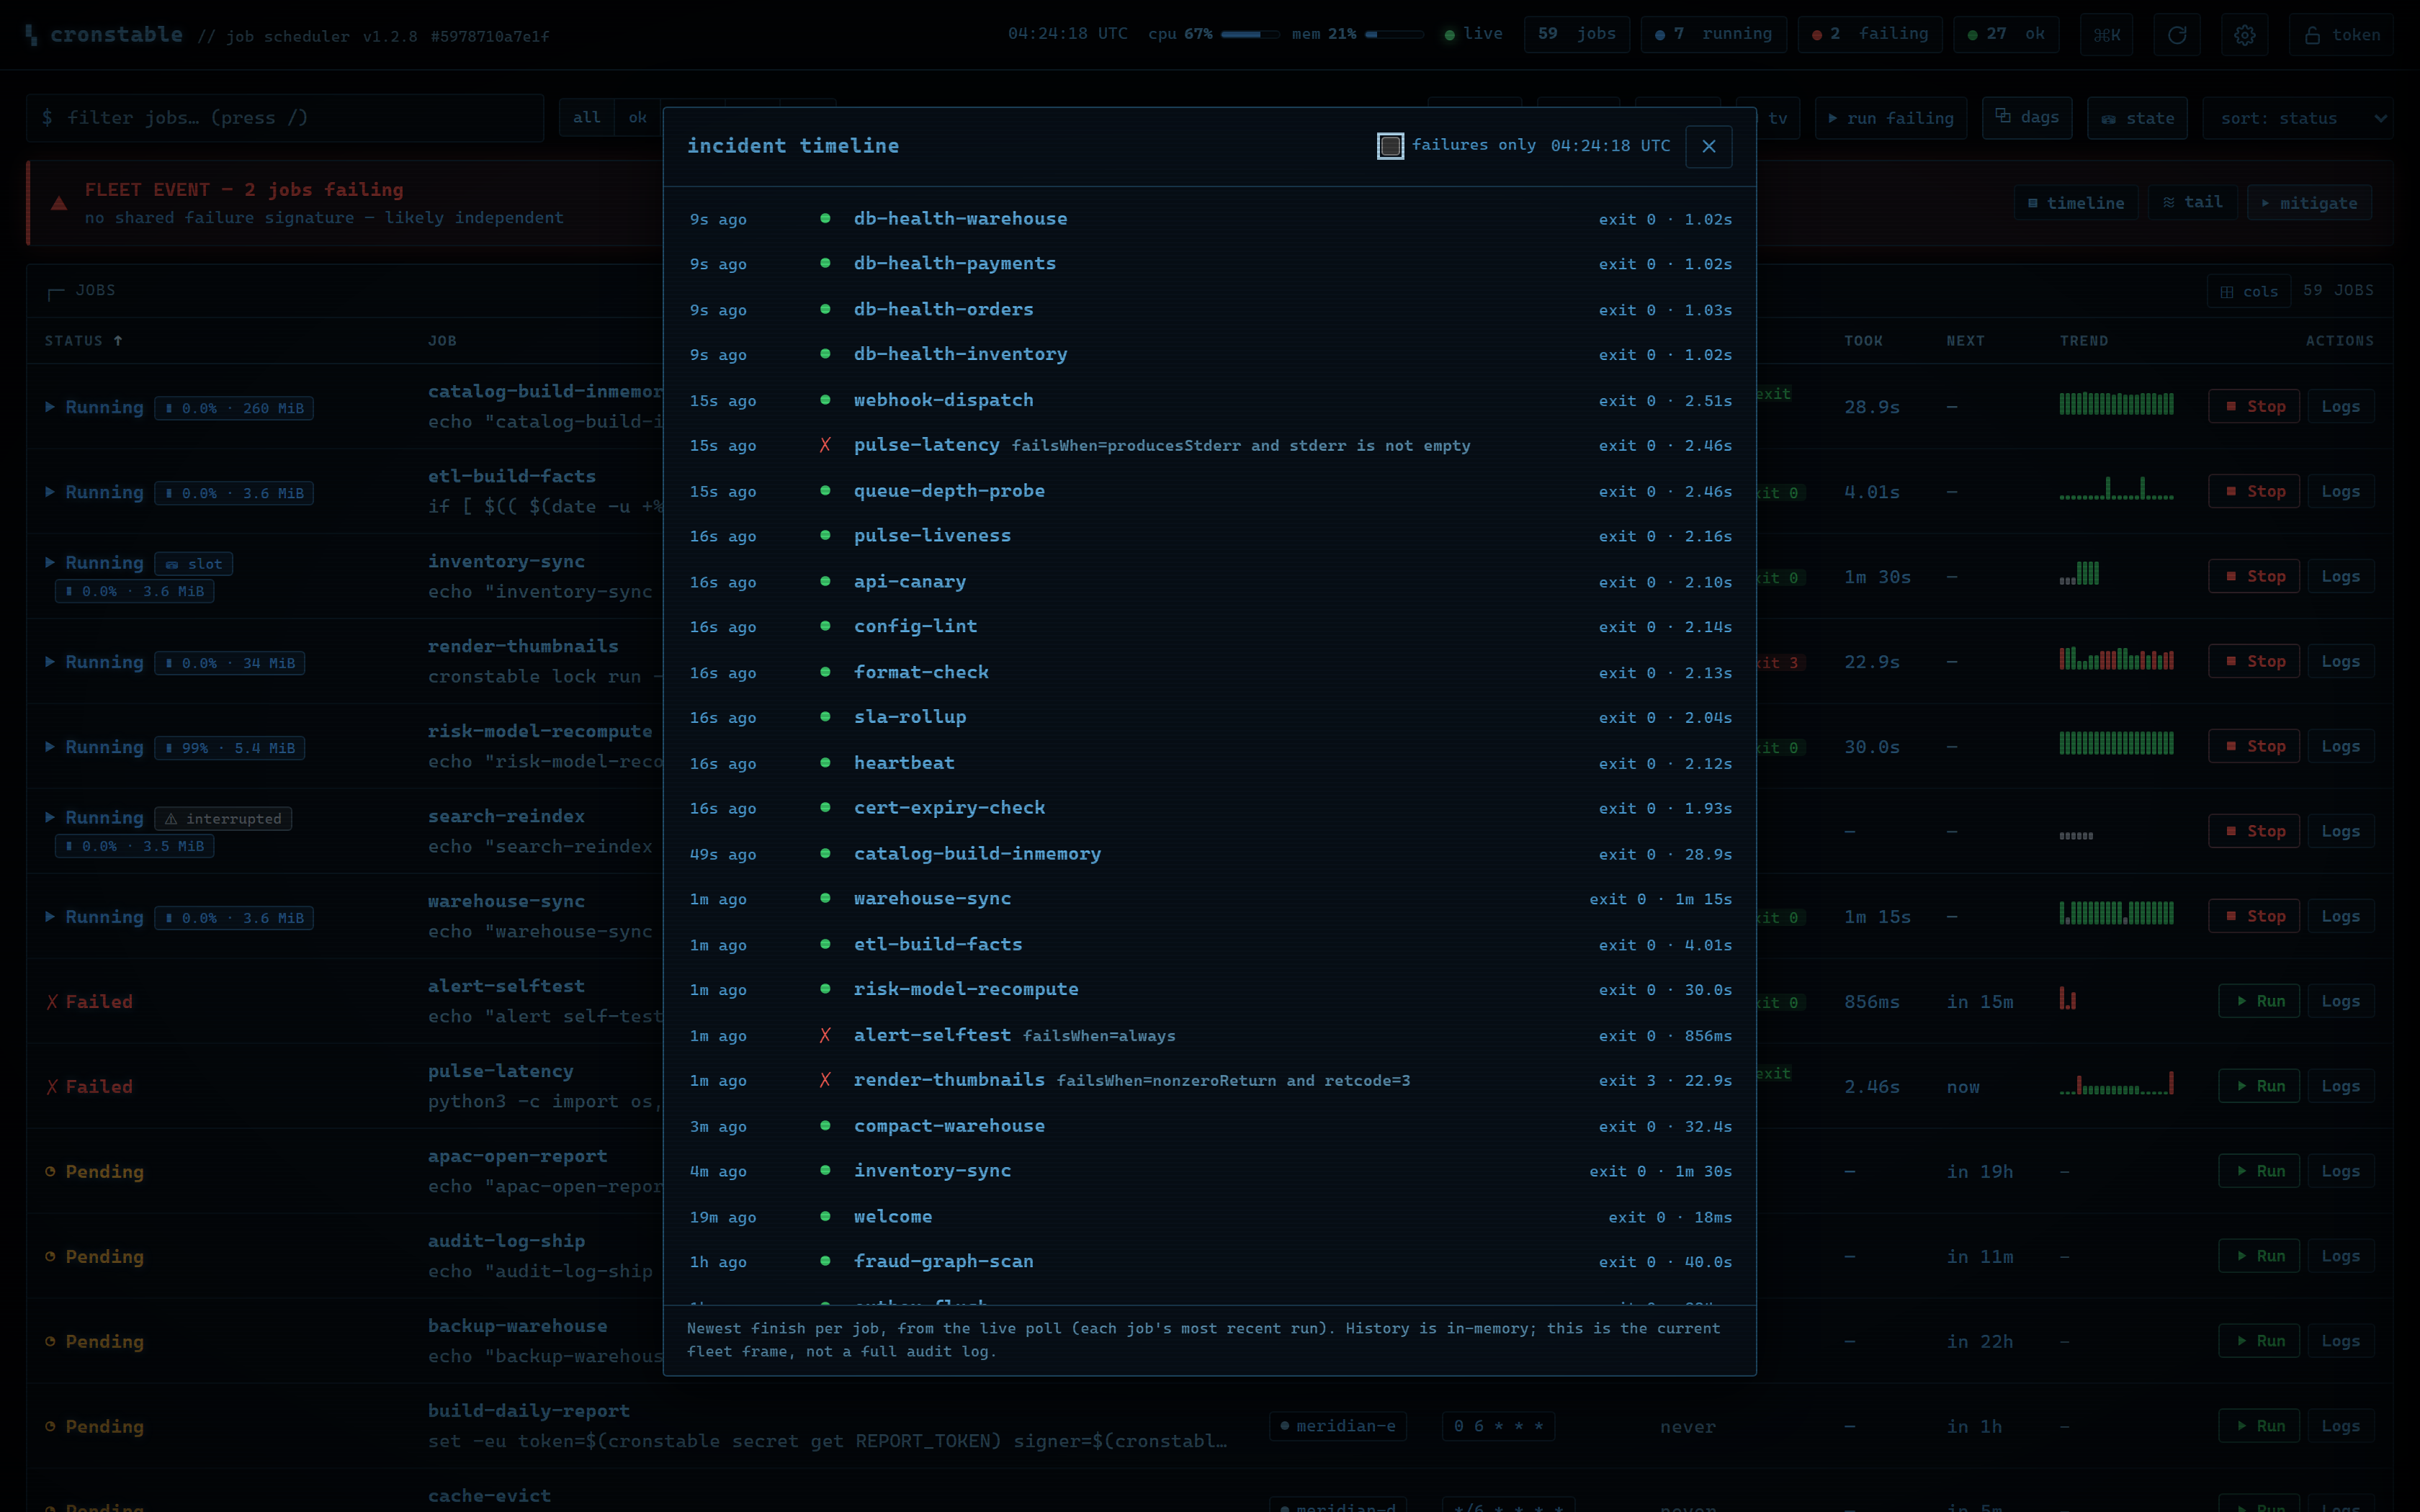
When things break, the dashboard leans in: the verdict bar's incident timeline lays out every job's most recent finish, newest first, with the correlated blast-radius set highlighted; the mitigate console start/cancels the failing set in bulk and copies a Markdown incident summary for your ticket; and the multi-tail console merges up to four jobs' live logs into one pane, like tailing a set of pods.
| Incident timeline | Merged multi-tail |
|---|---|
 |
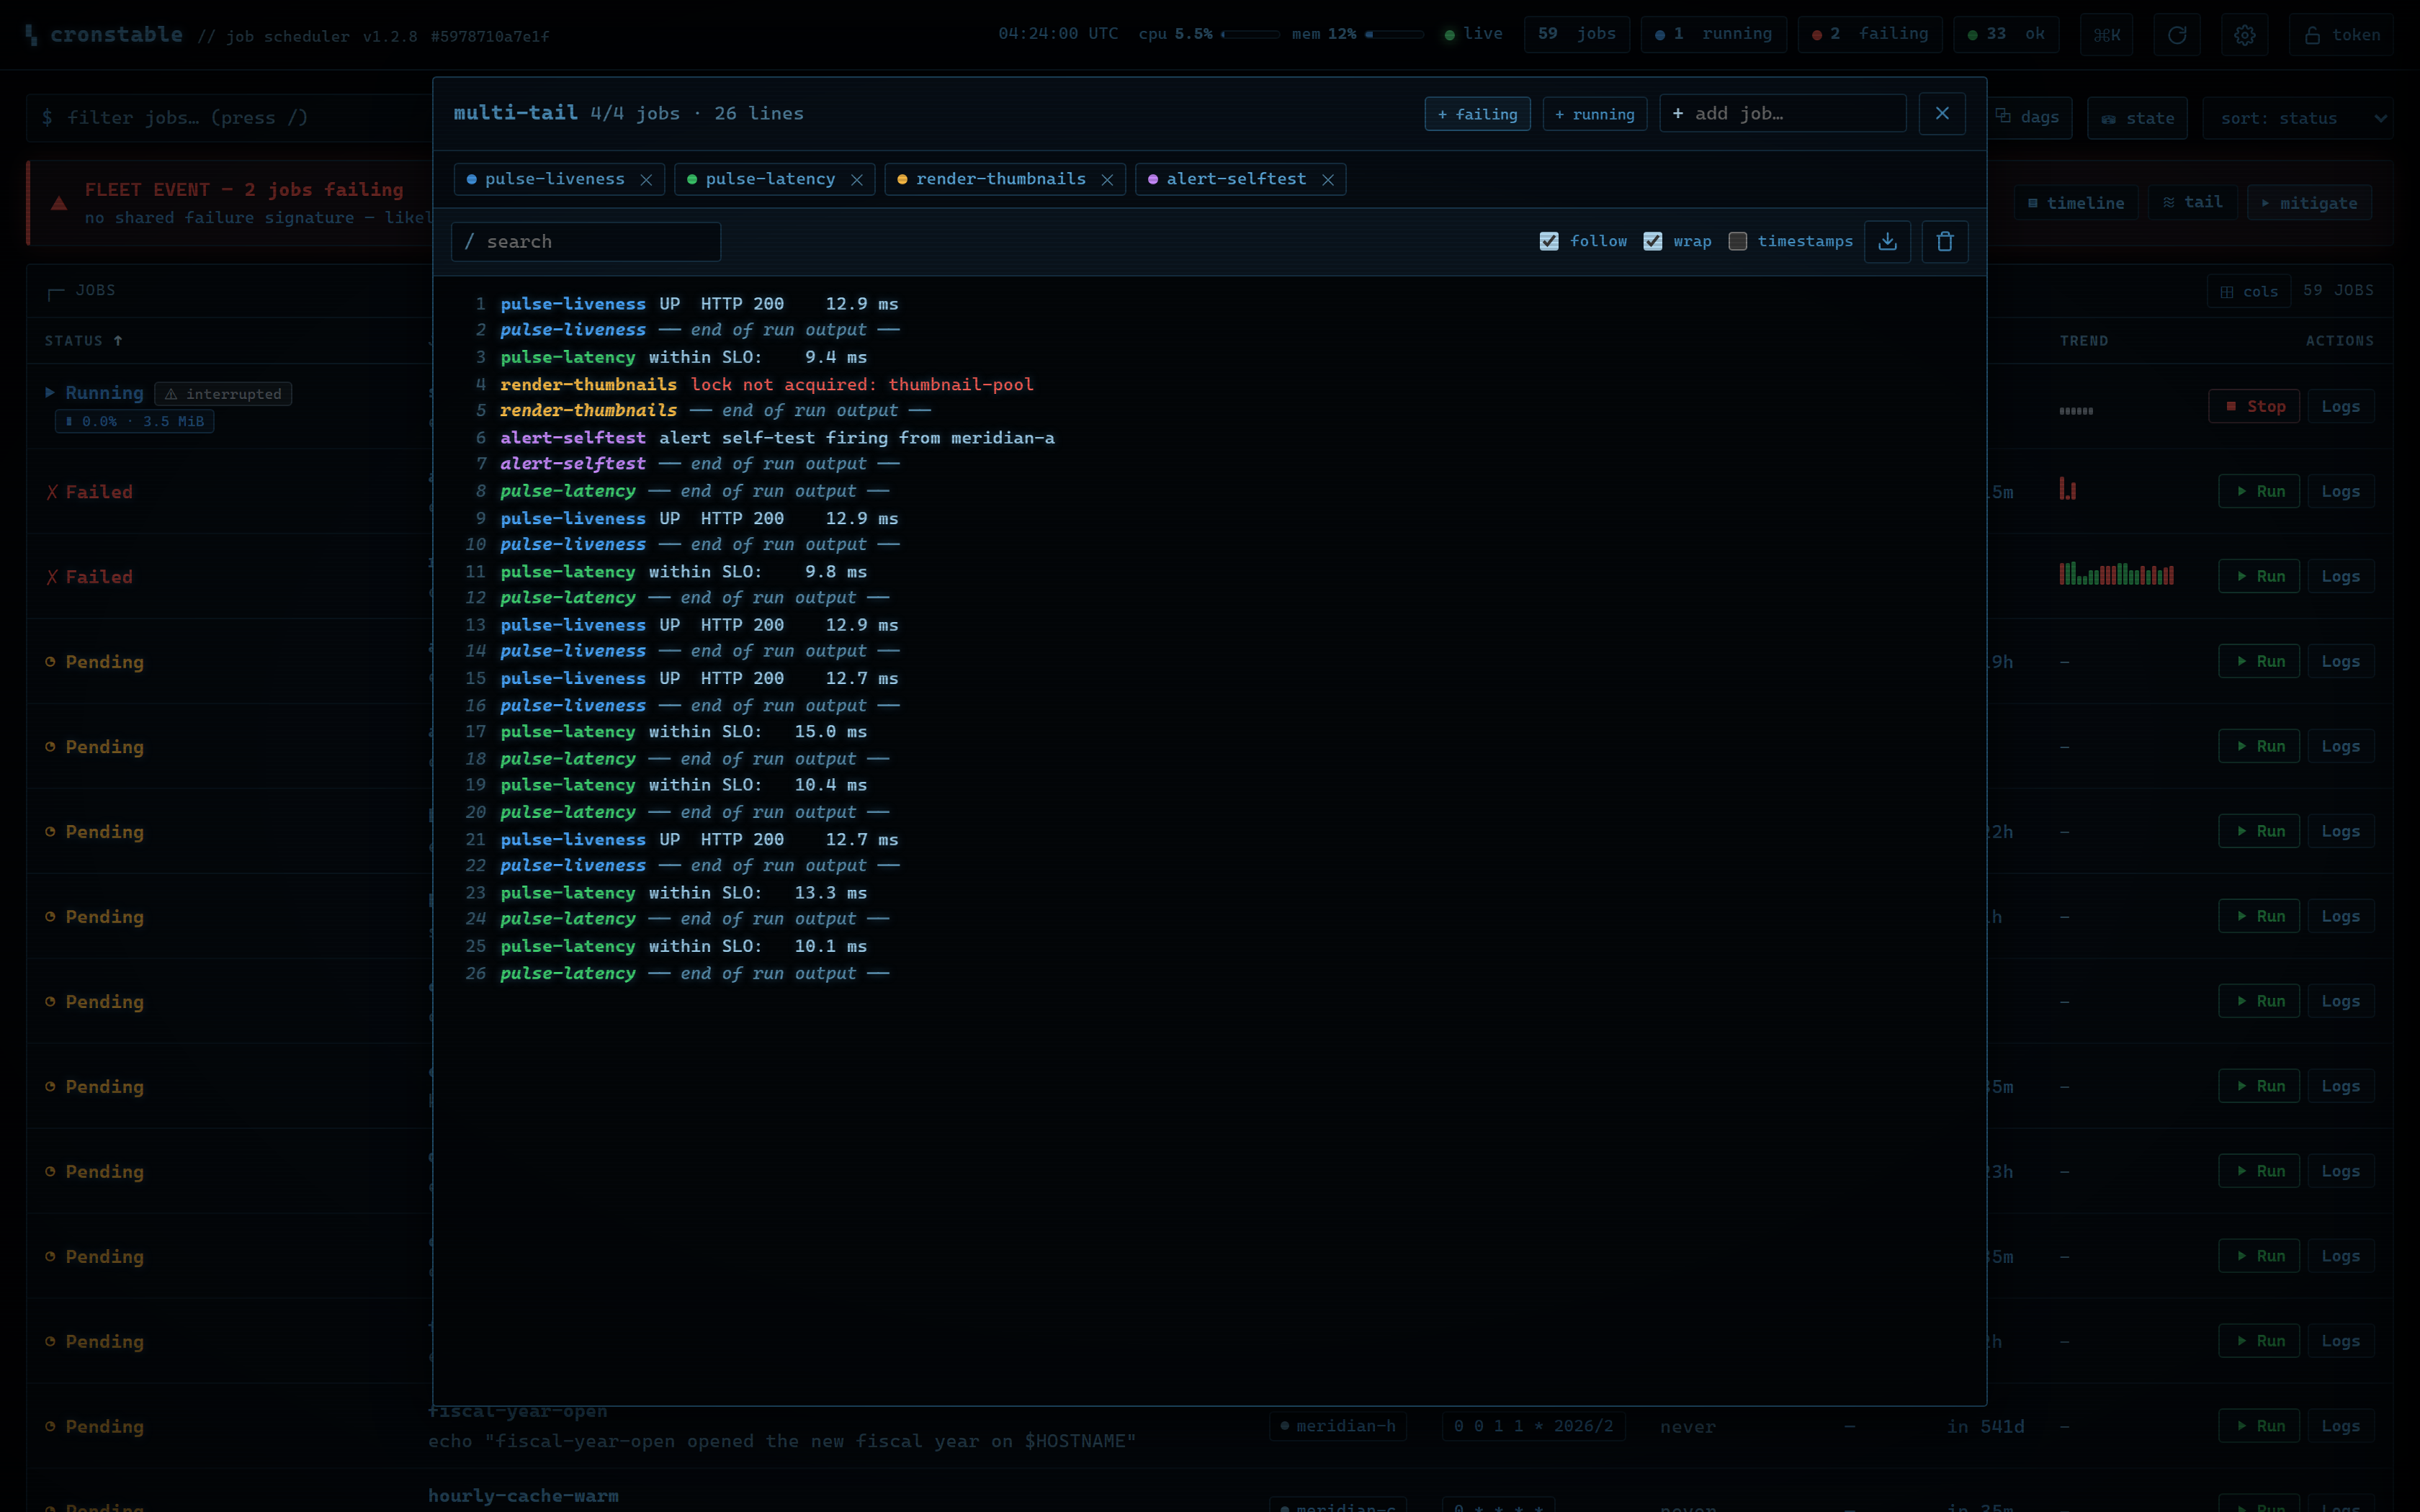 |
| "What happened, in what order": relative times, outcome glyphs, failure reasons, exit codes, durations, and a failing only filter. | Four streams, one pane: identity-colored prefixes, end of run output markers, auto re-attach on each job's next run. |
Wallboards, heatmaps, and the state store
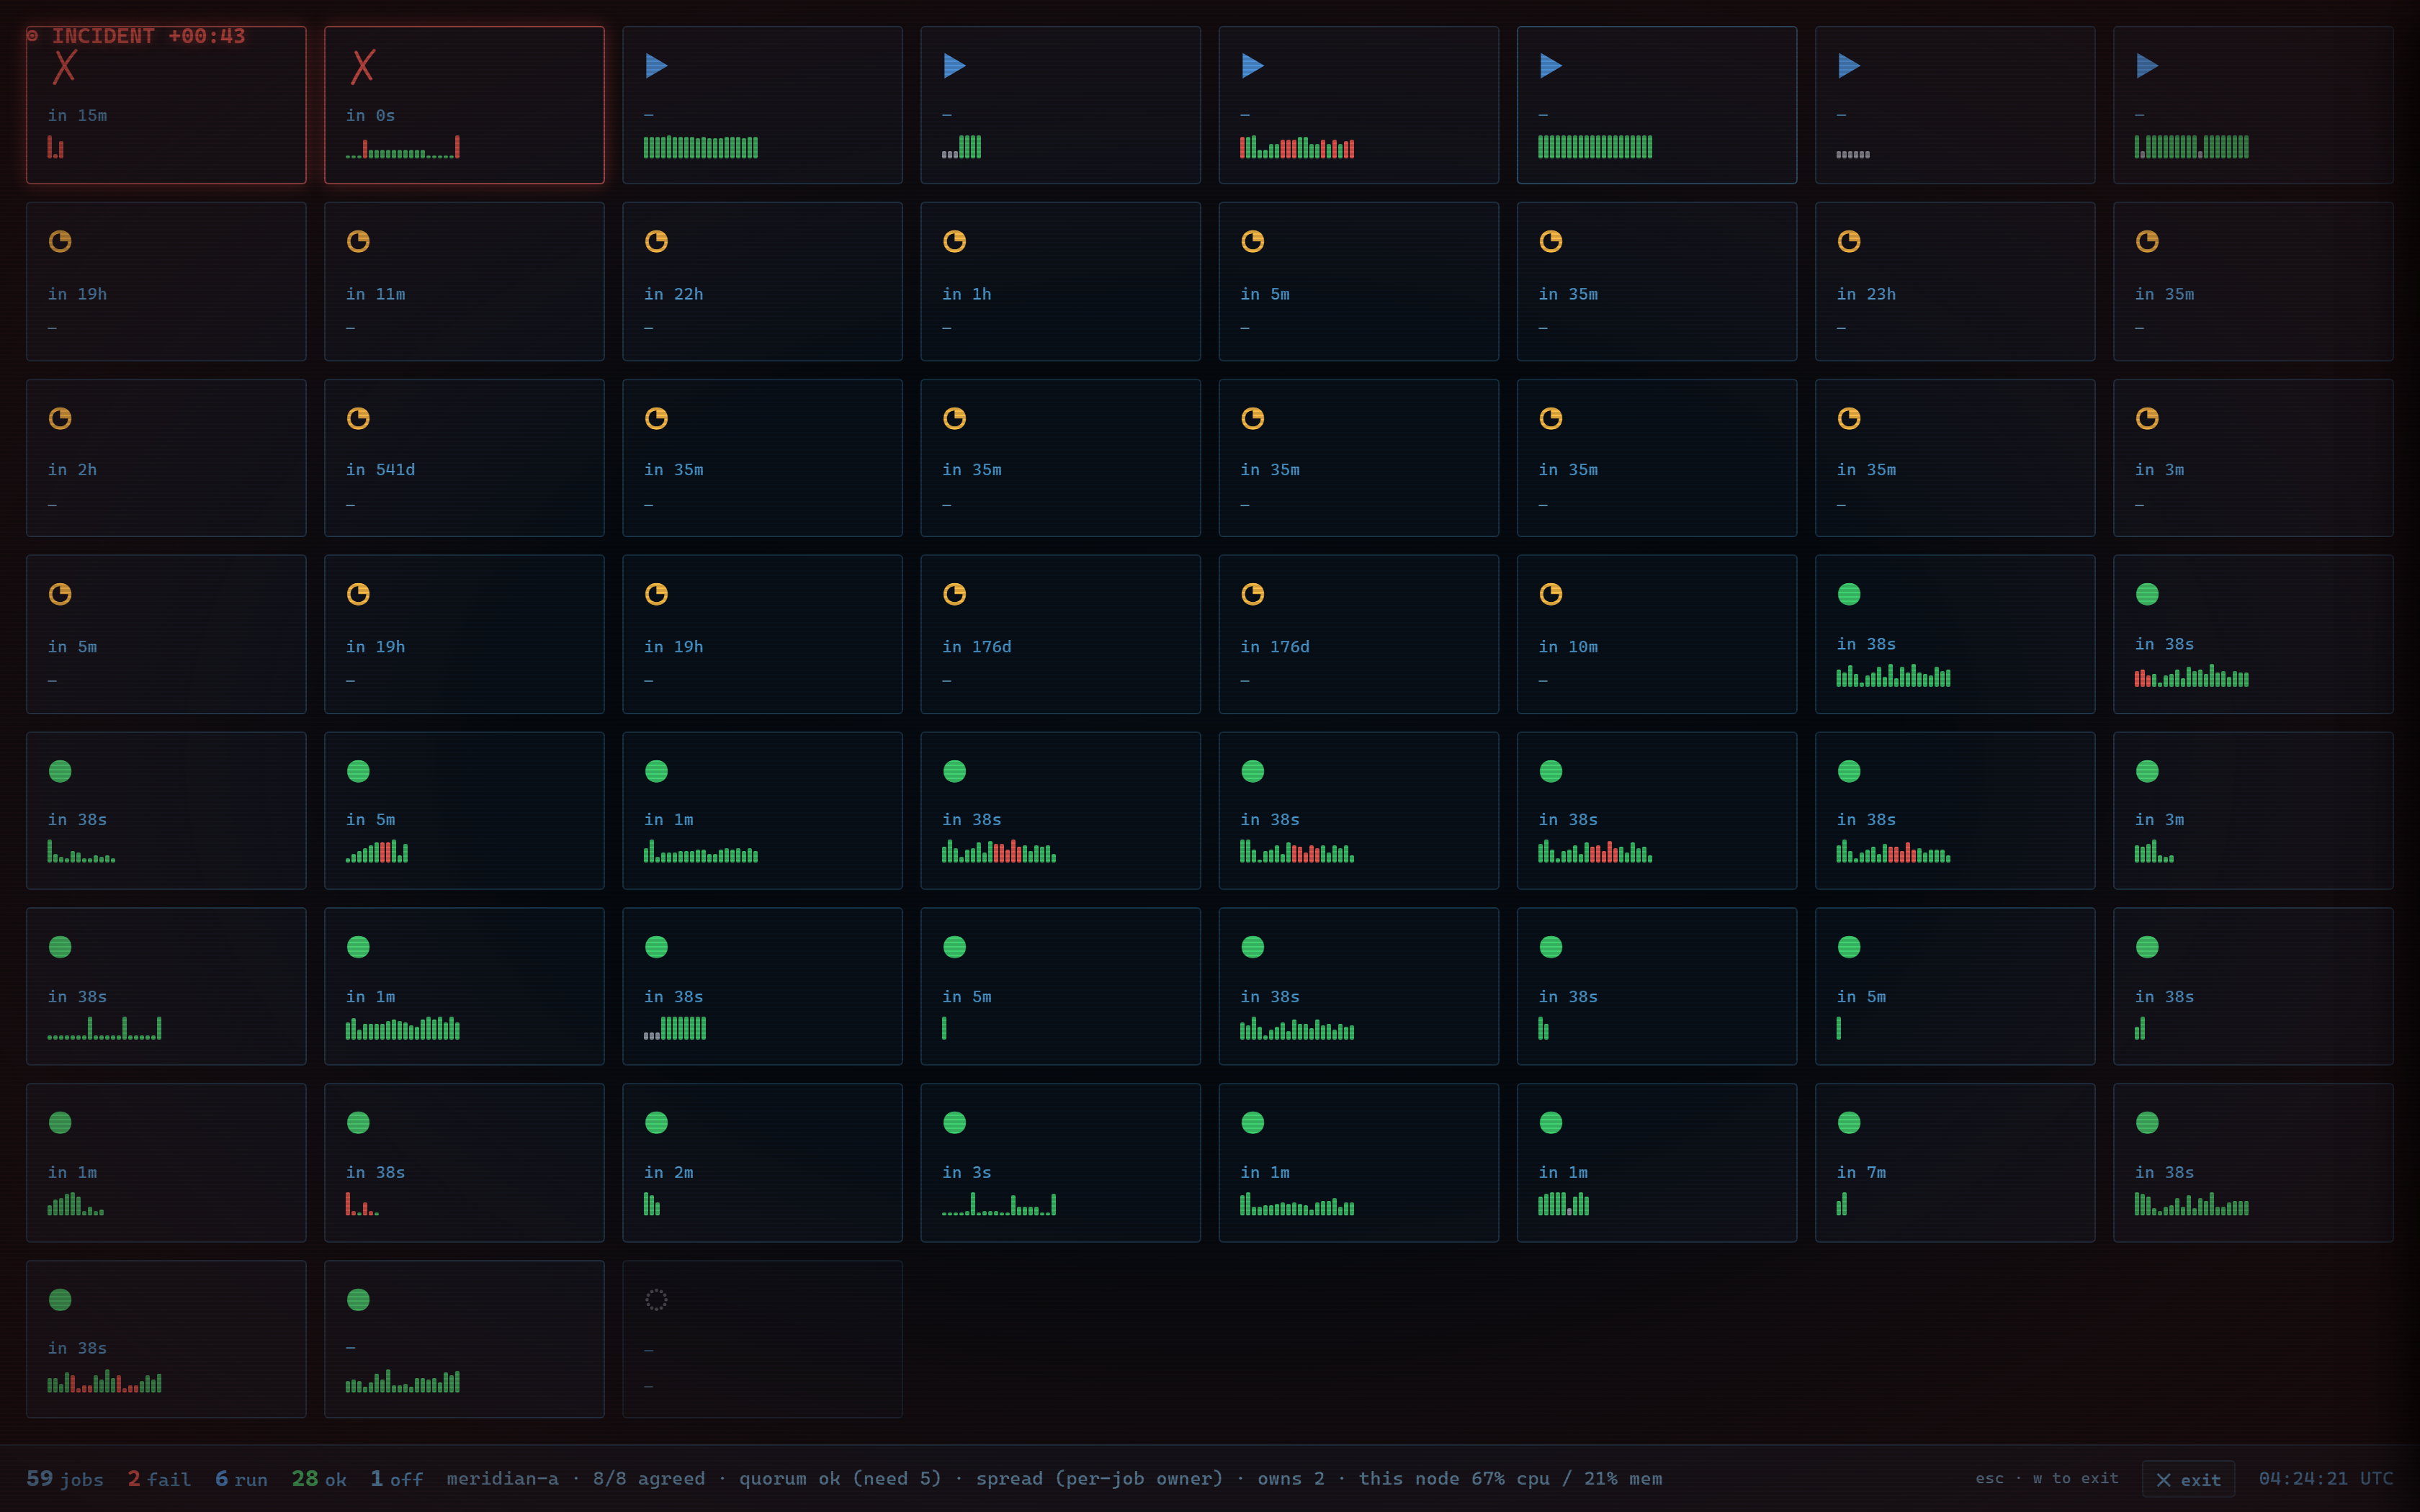
Press w for a full-screen wallboard built for a TV: worst-first tiles,
an incident stamp when something is failing, a NO SIGNAL banner when the
data goes stale (never a stale all-green), and a zen screensaver that
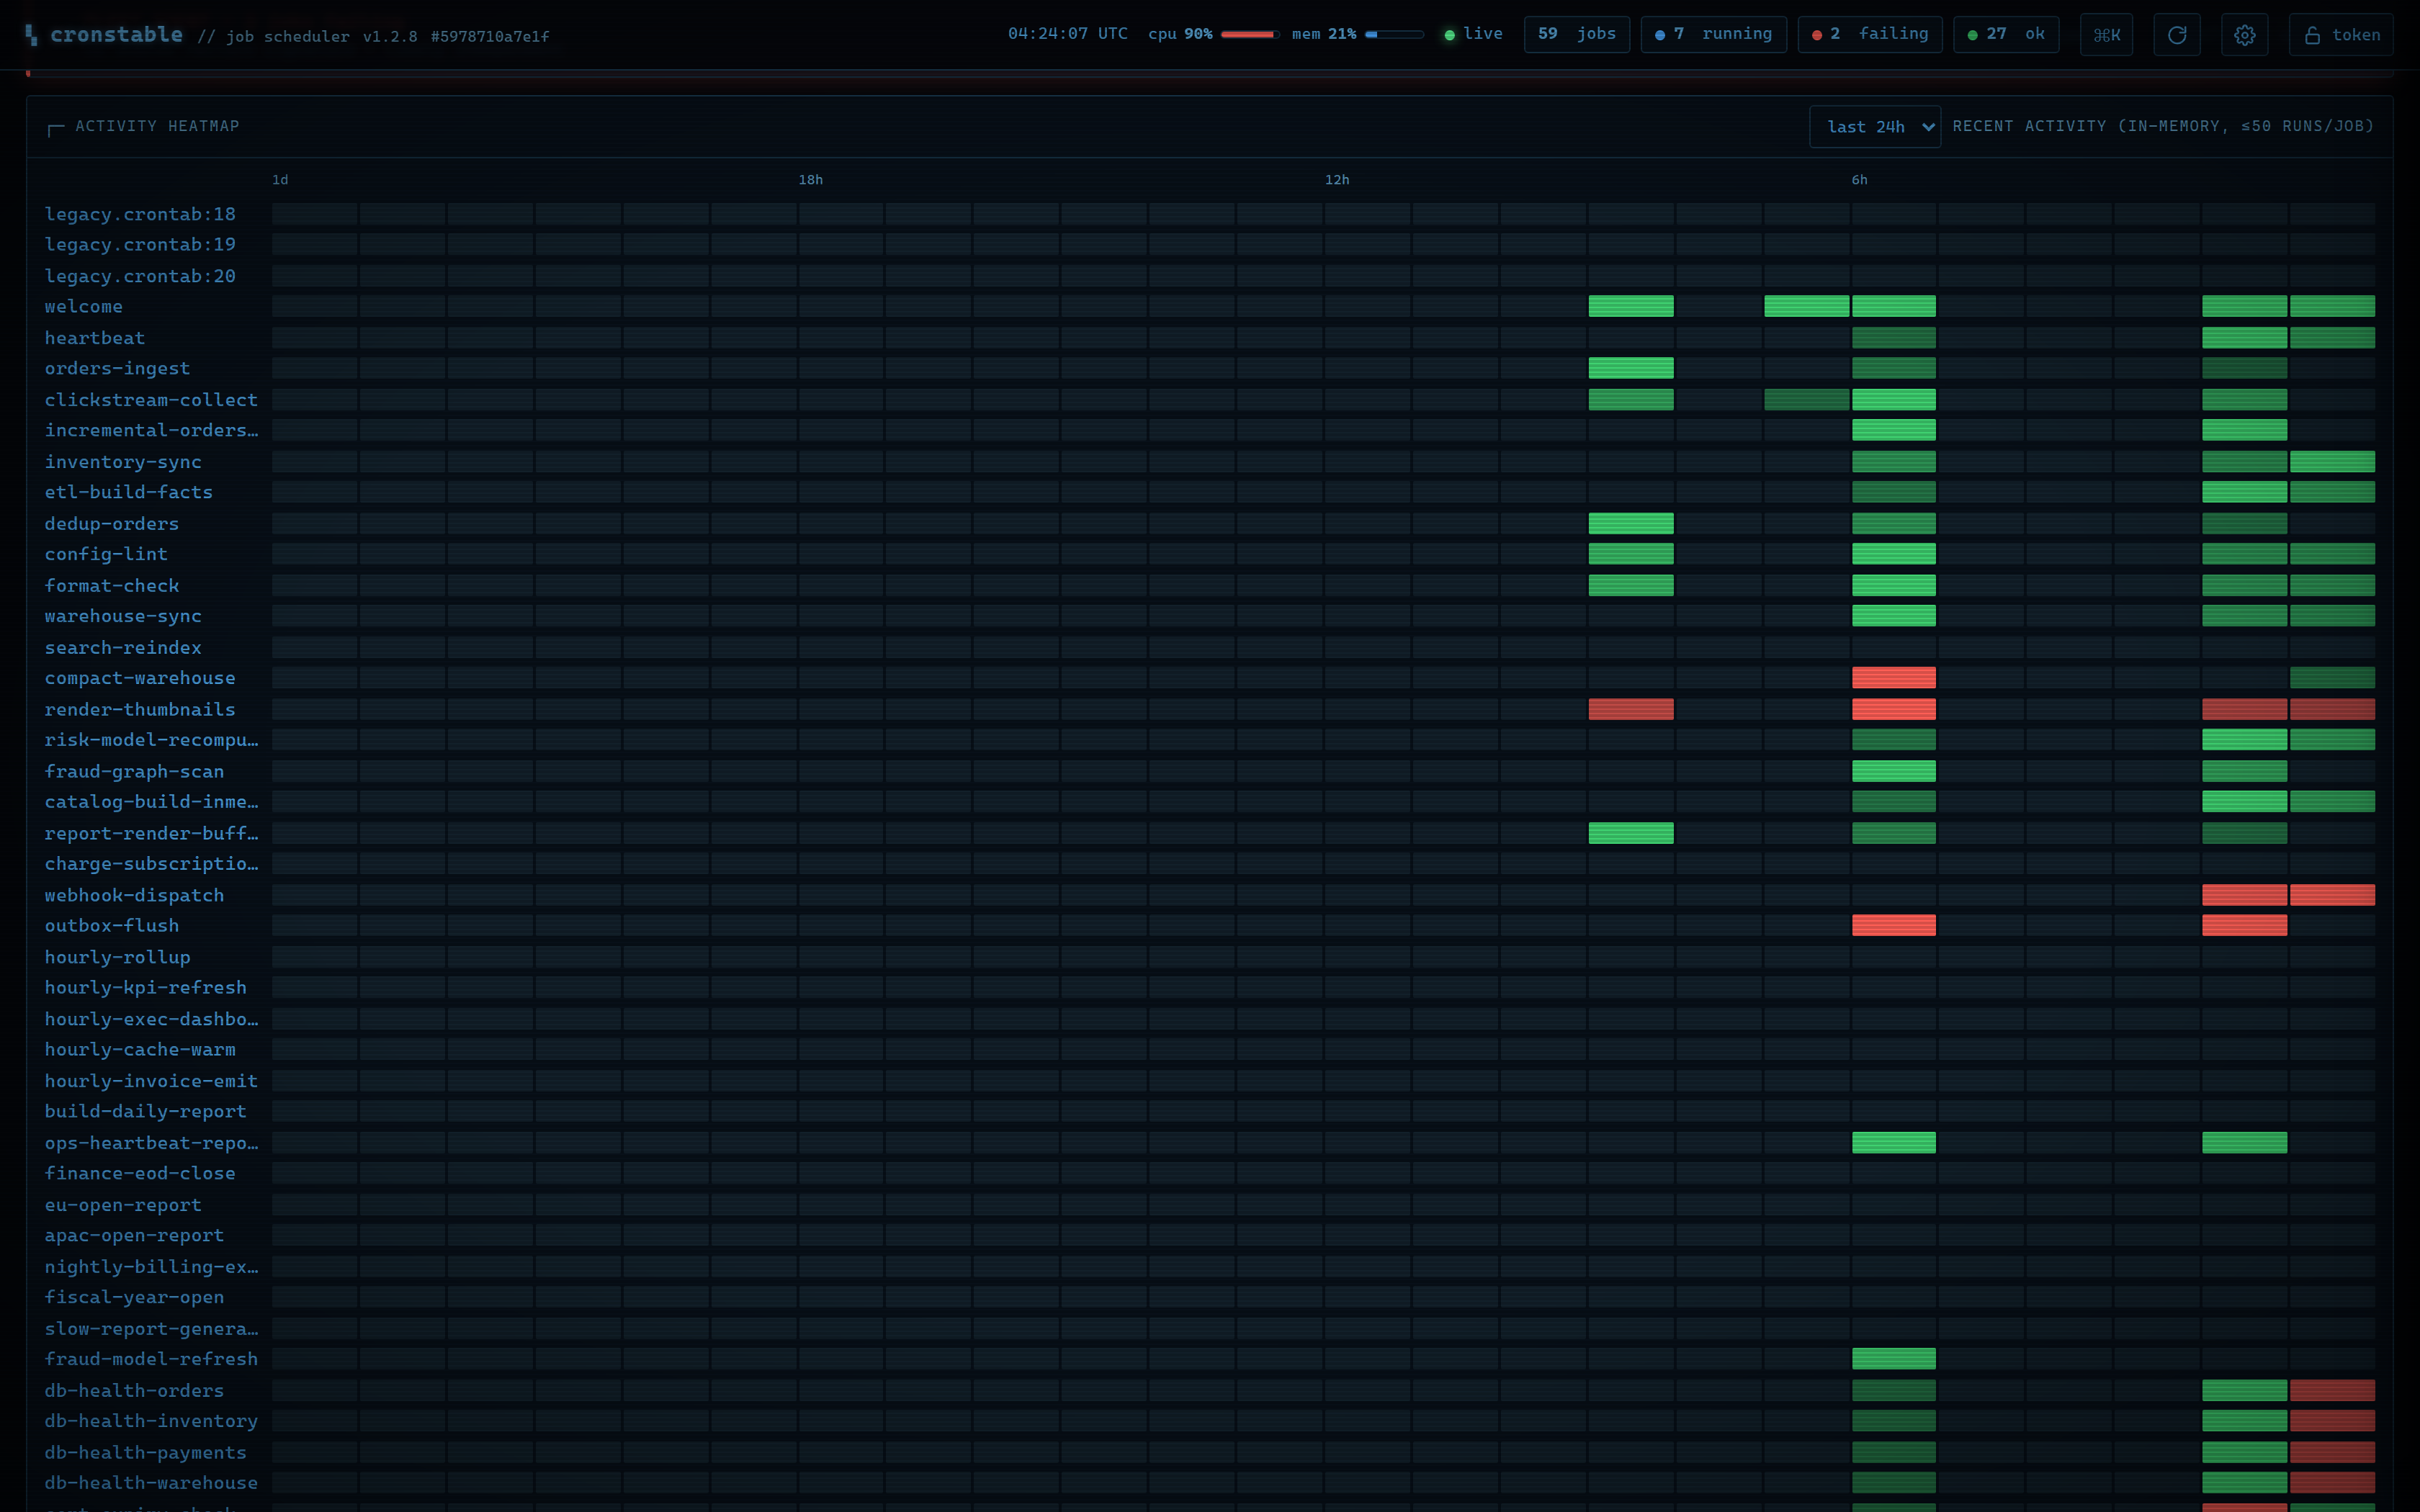
takes over when everything is healthy. The activity heatmap turns run
history into a punchcard (worst outcome per bucket, shaded by volume), and the
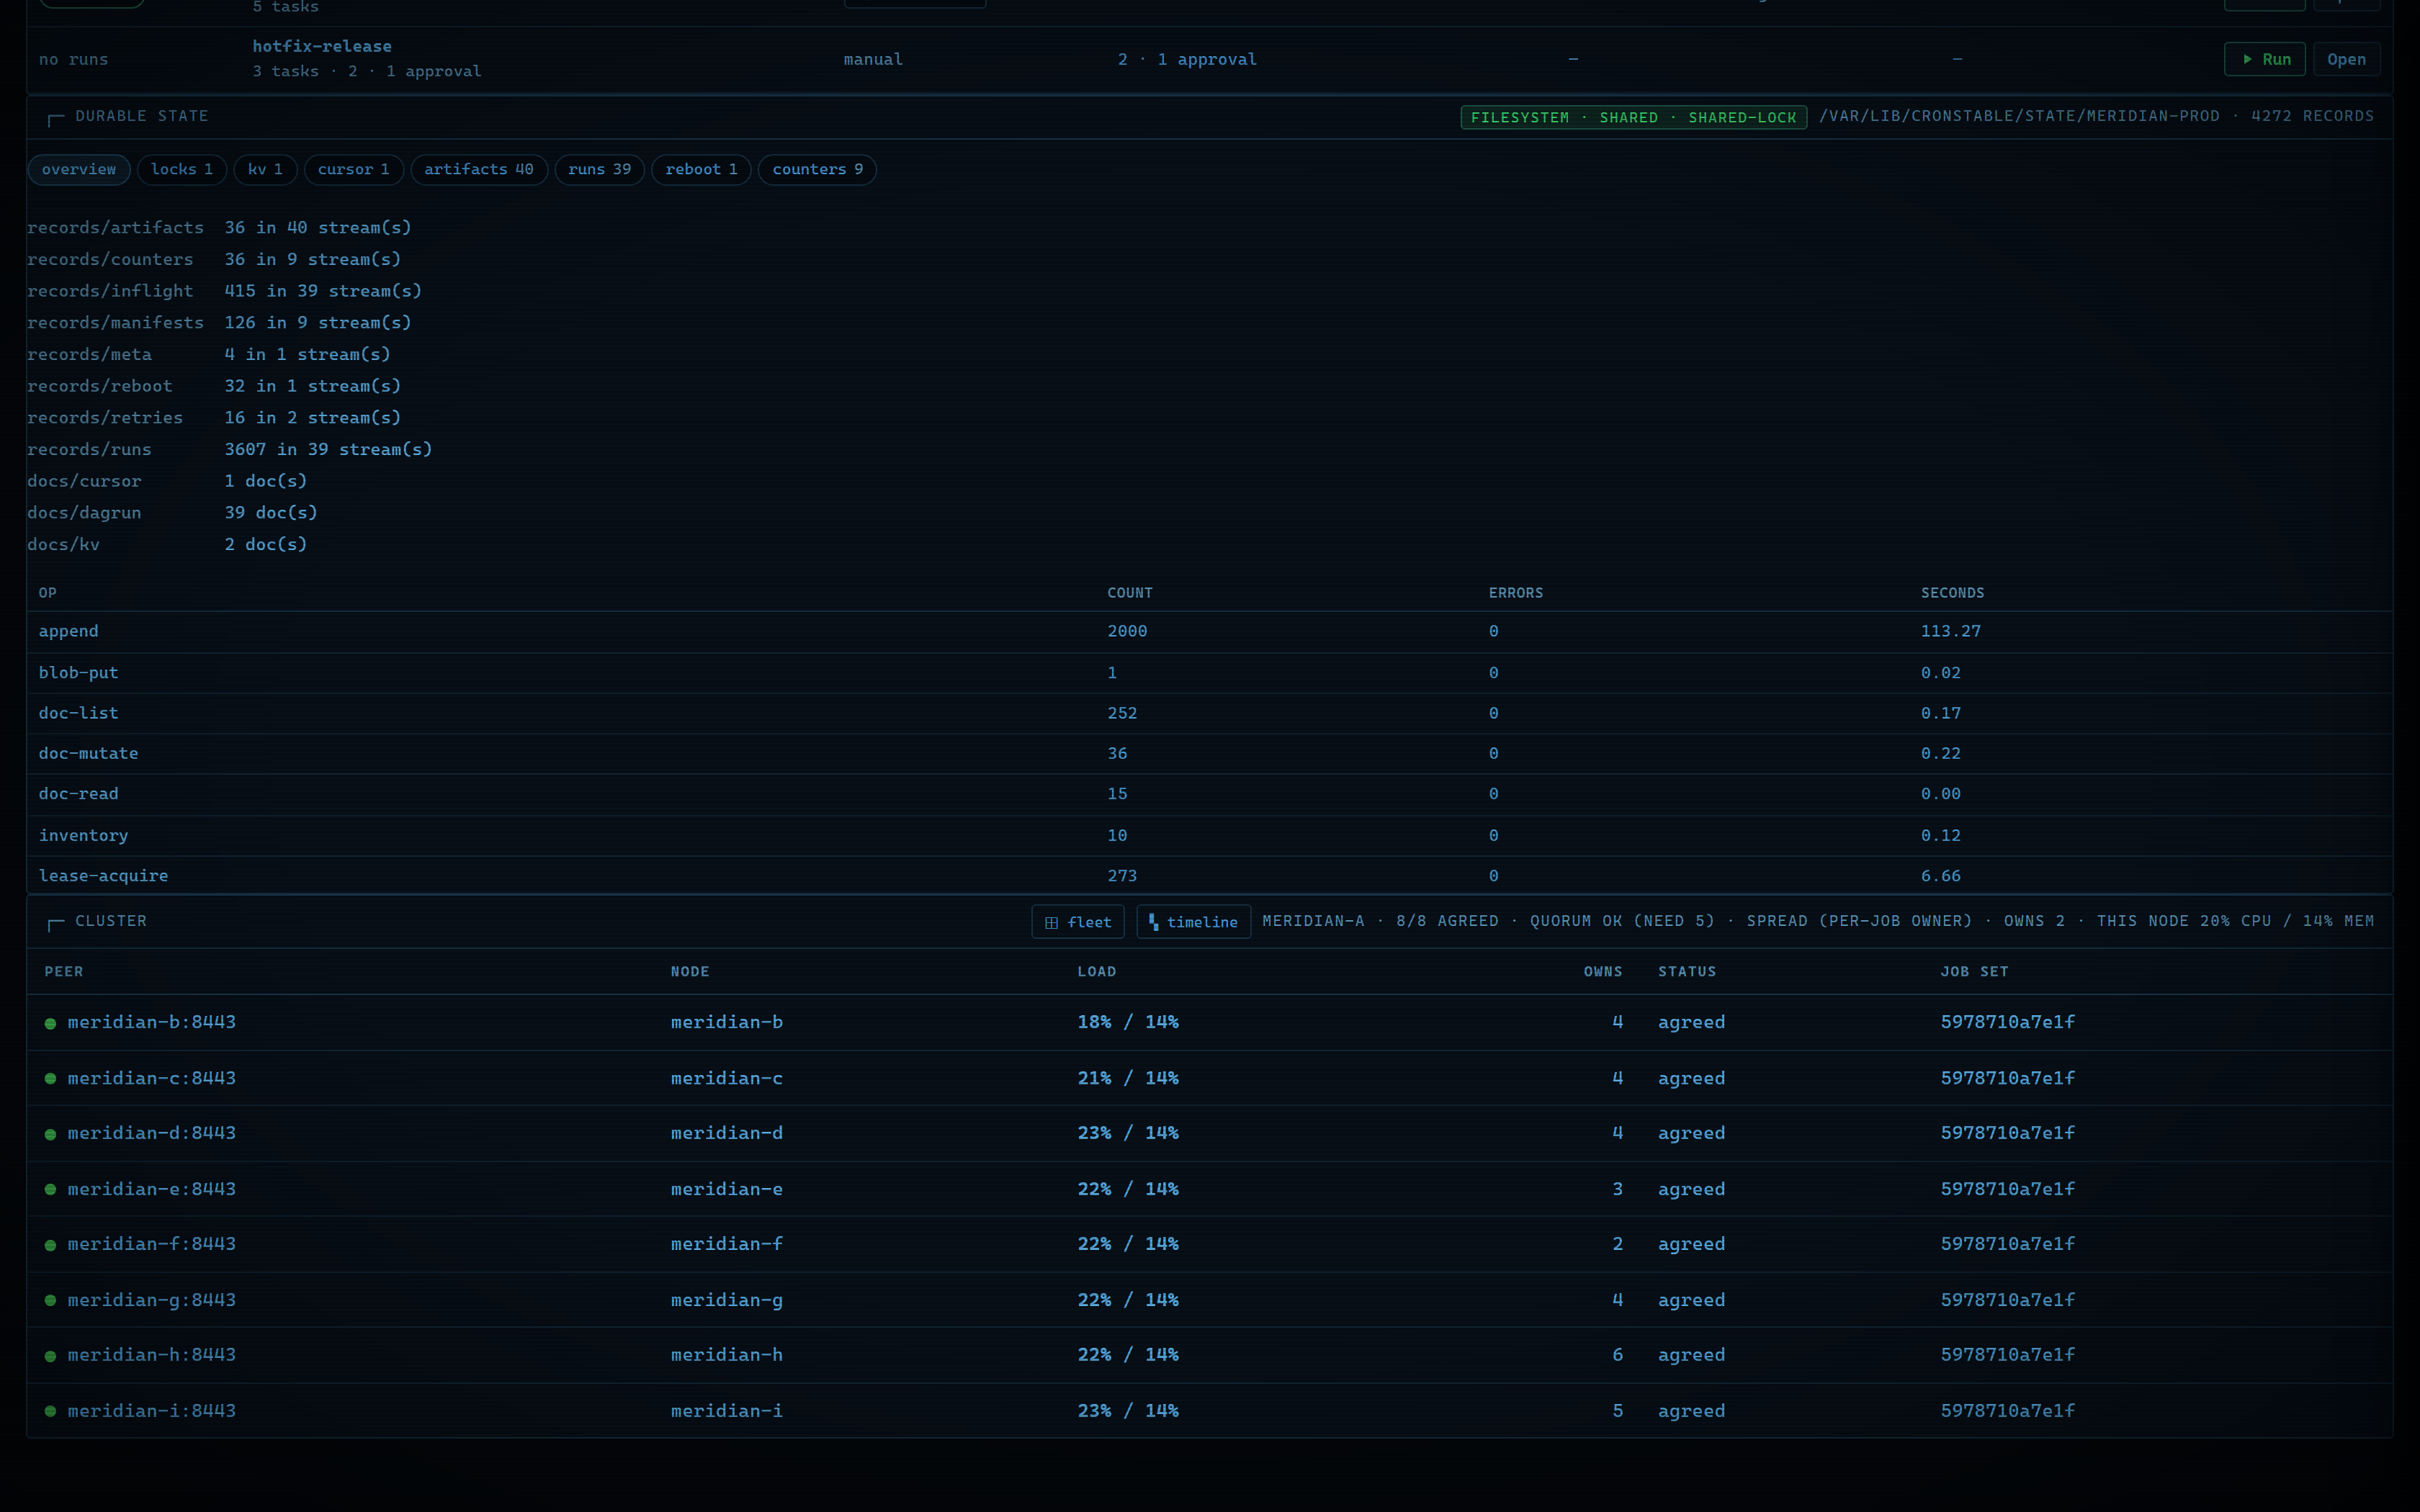
opt-in state inspector shows the durable state store's
health: record counts by kind, op latencies and errors, locks, cursors,
counters, artifacts, and quarantine.
| Wallboard / TV mode | Activity heatmap | Durable-state inspector |
|---|---|---|
 |
 |
 |
Make it yours
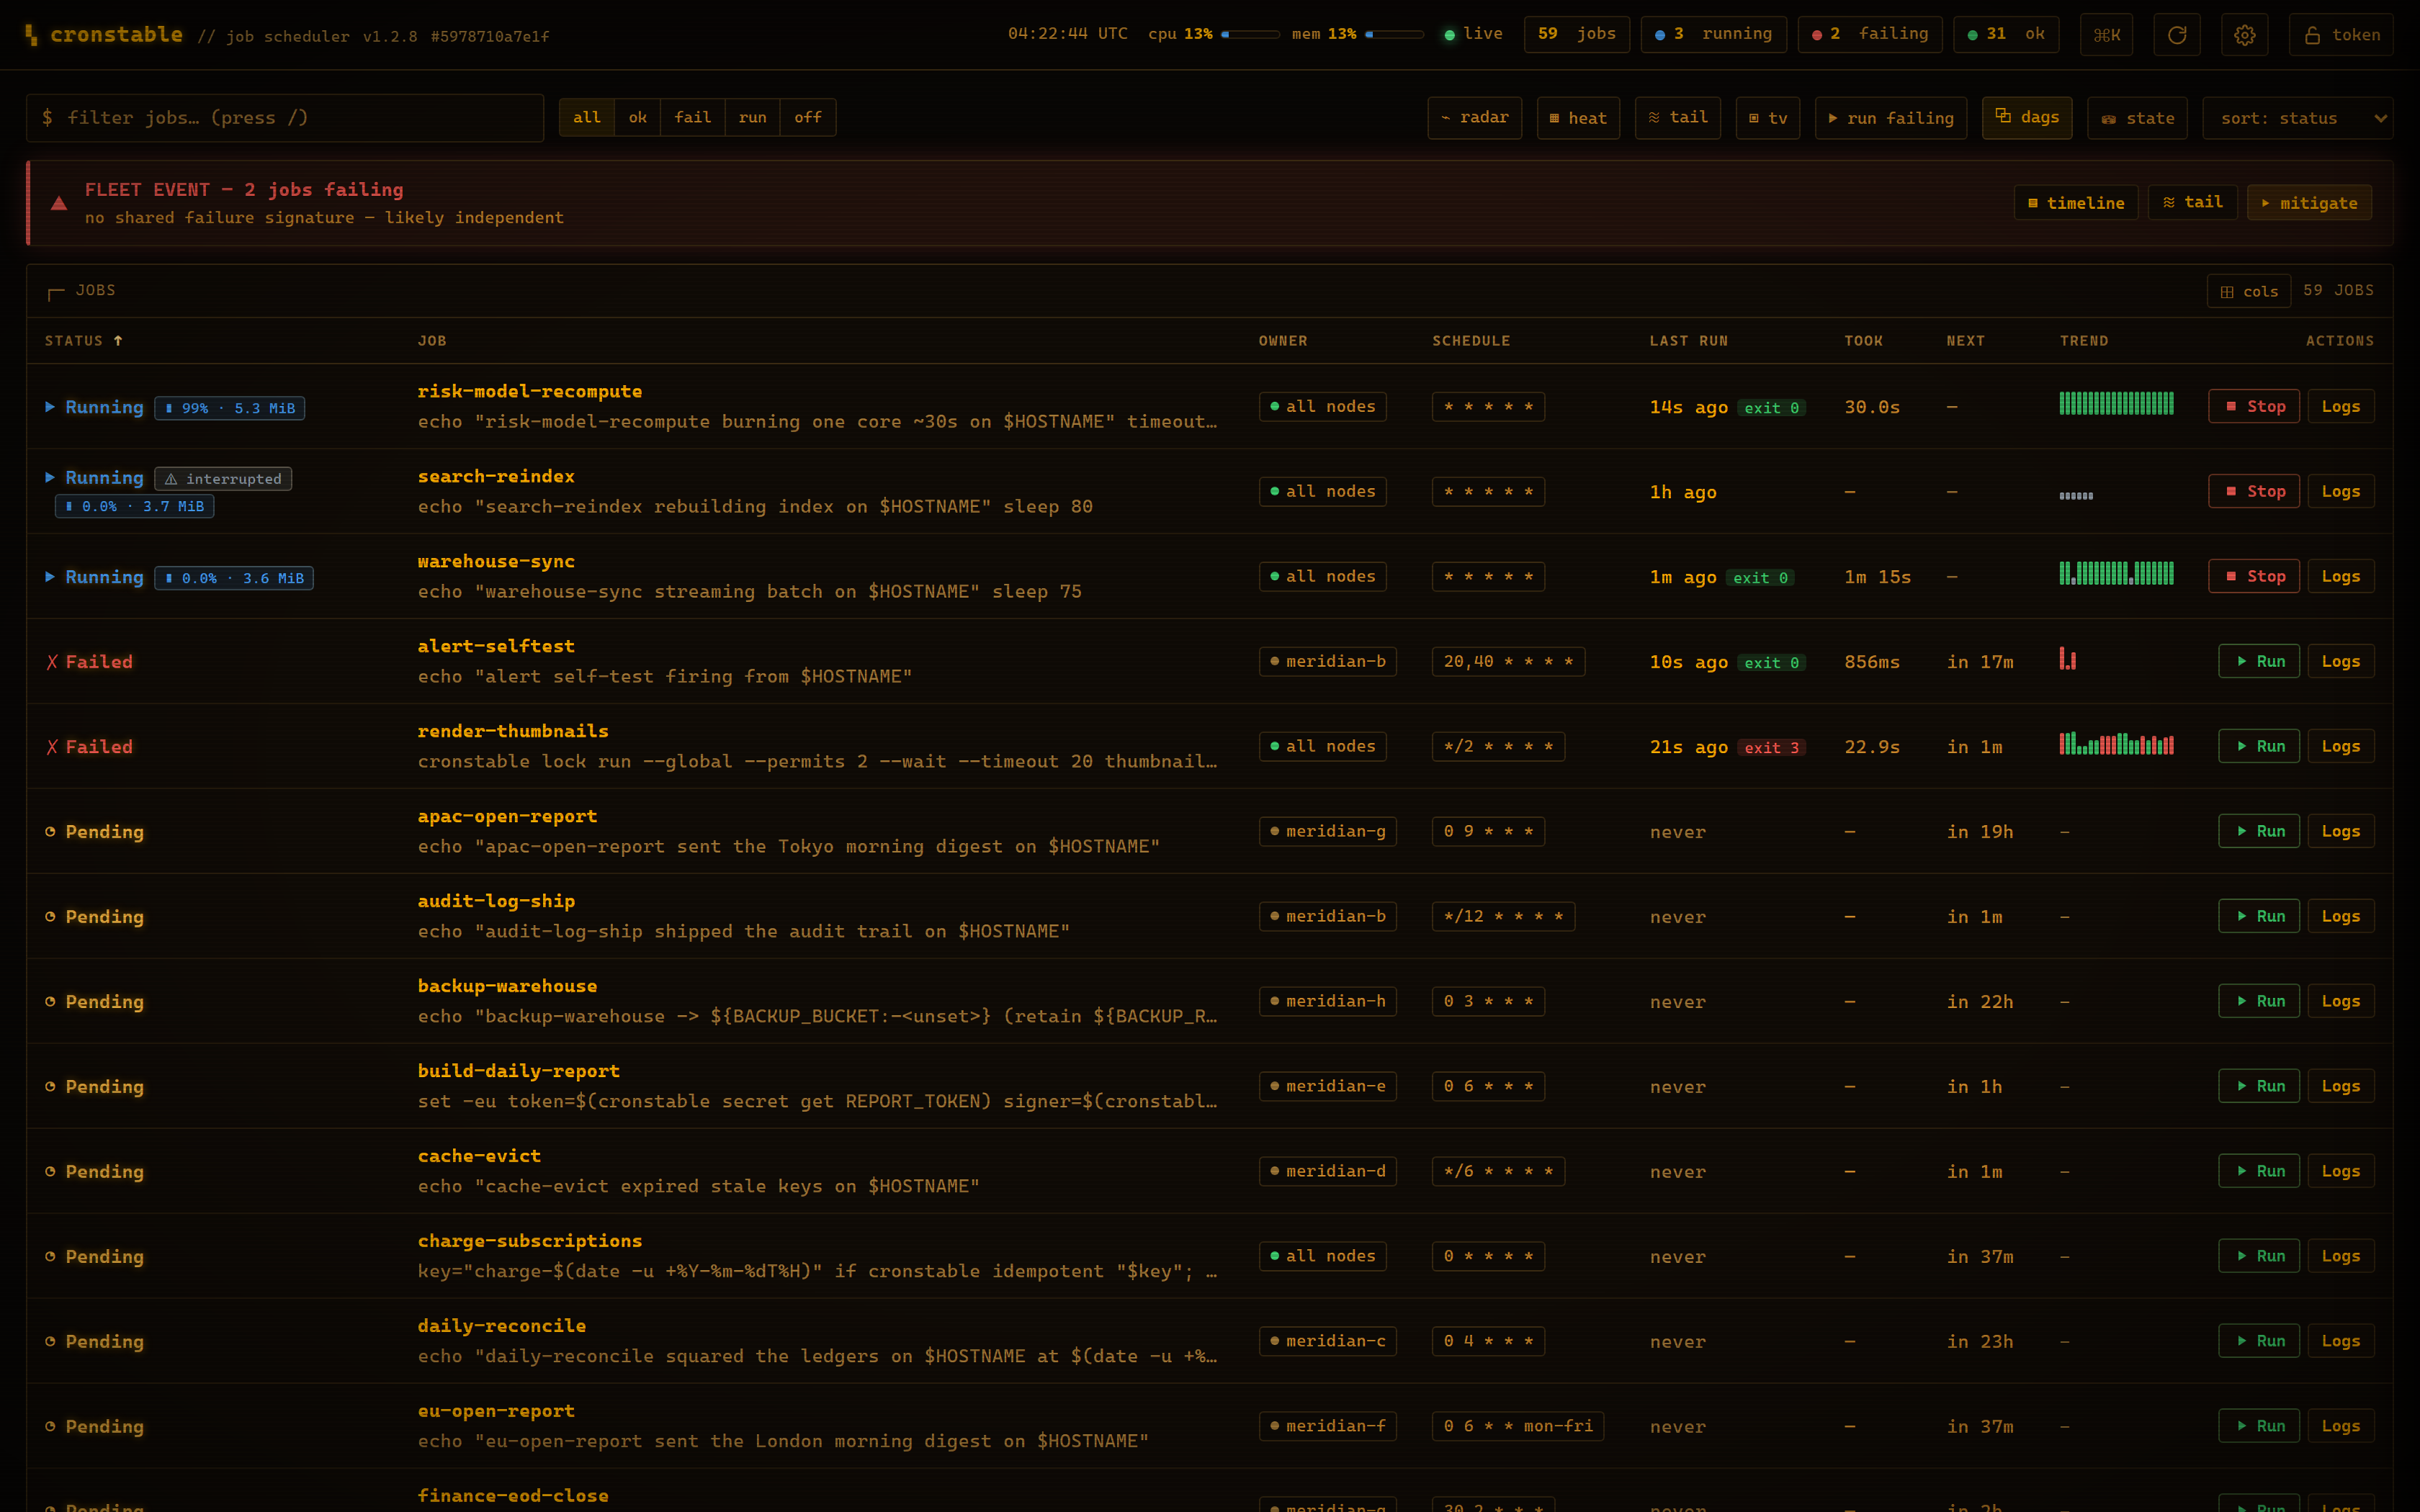
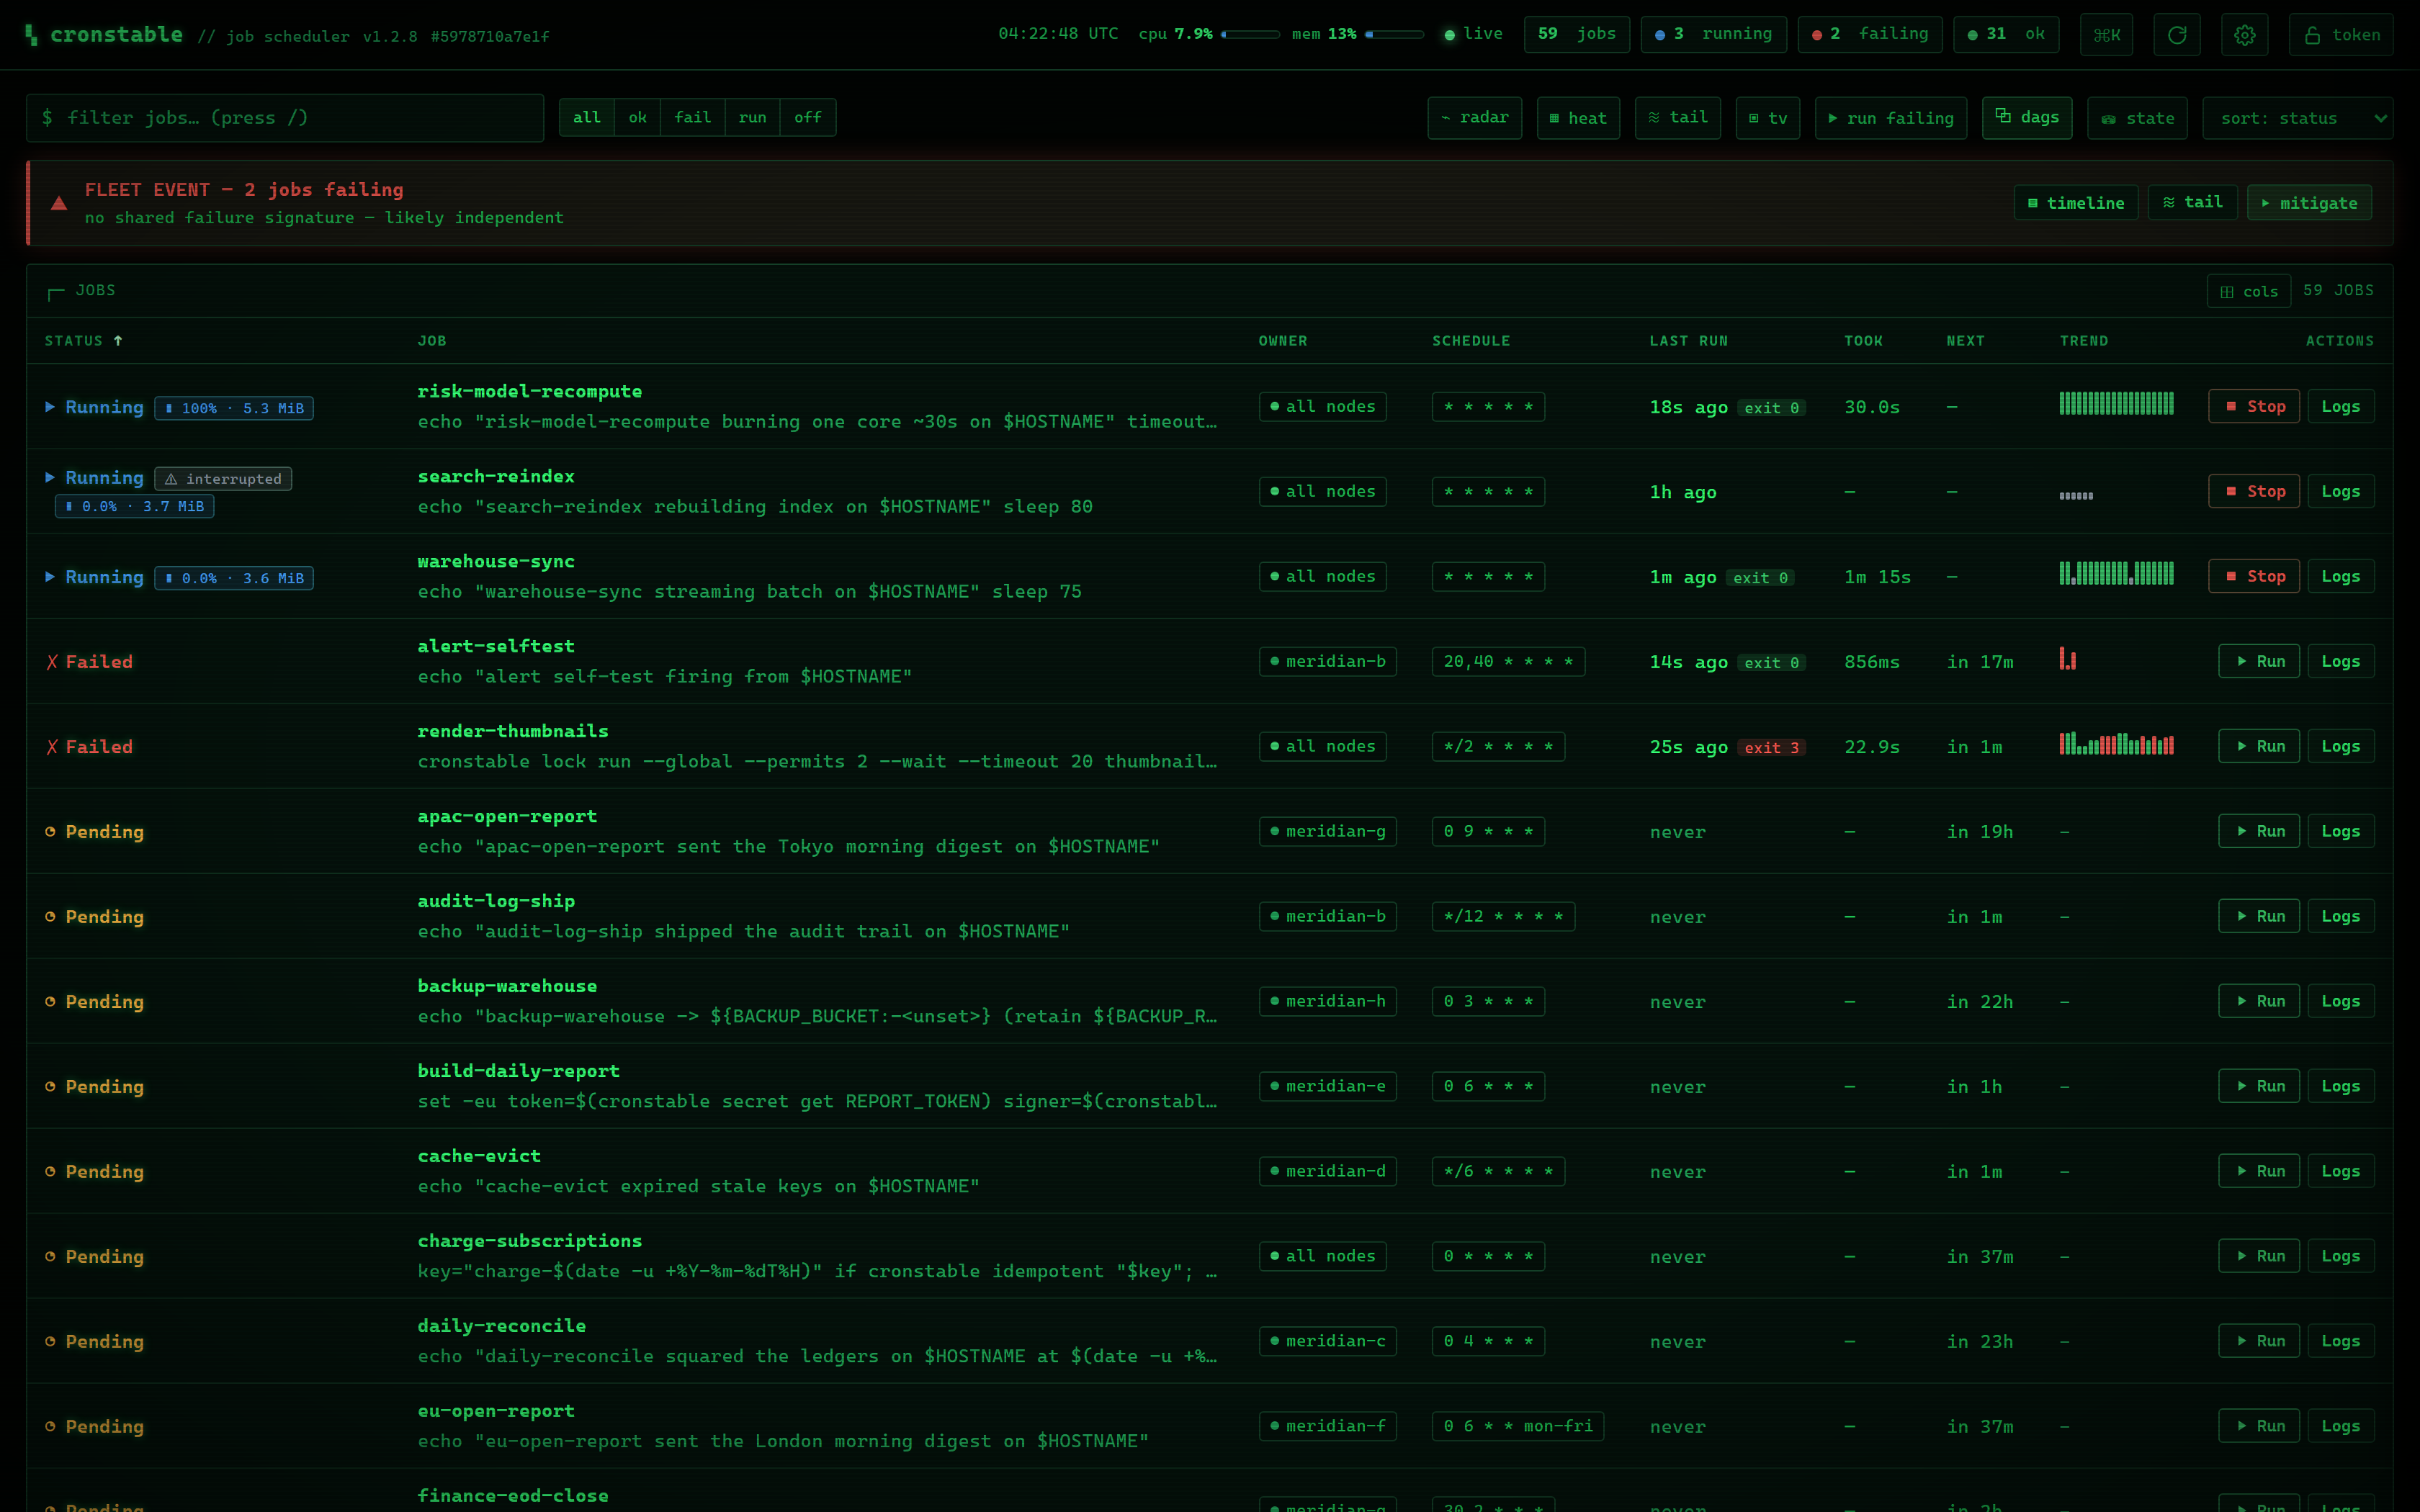
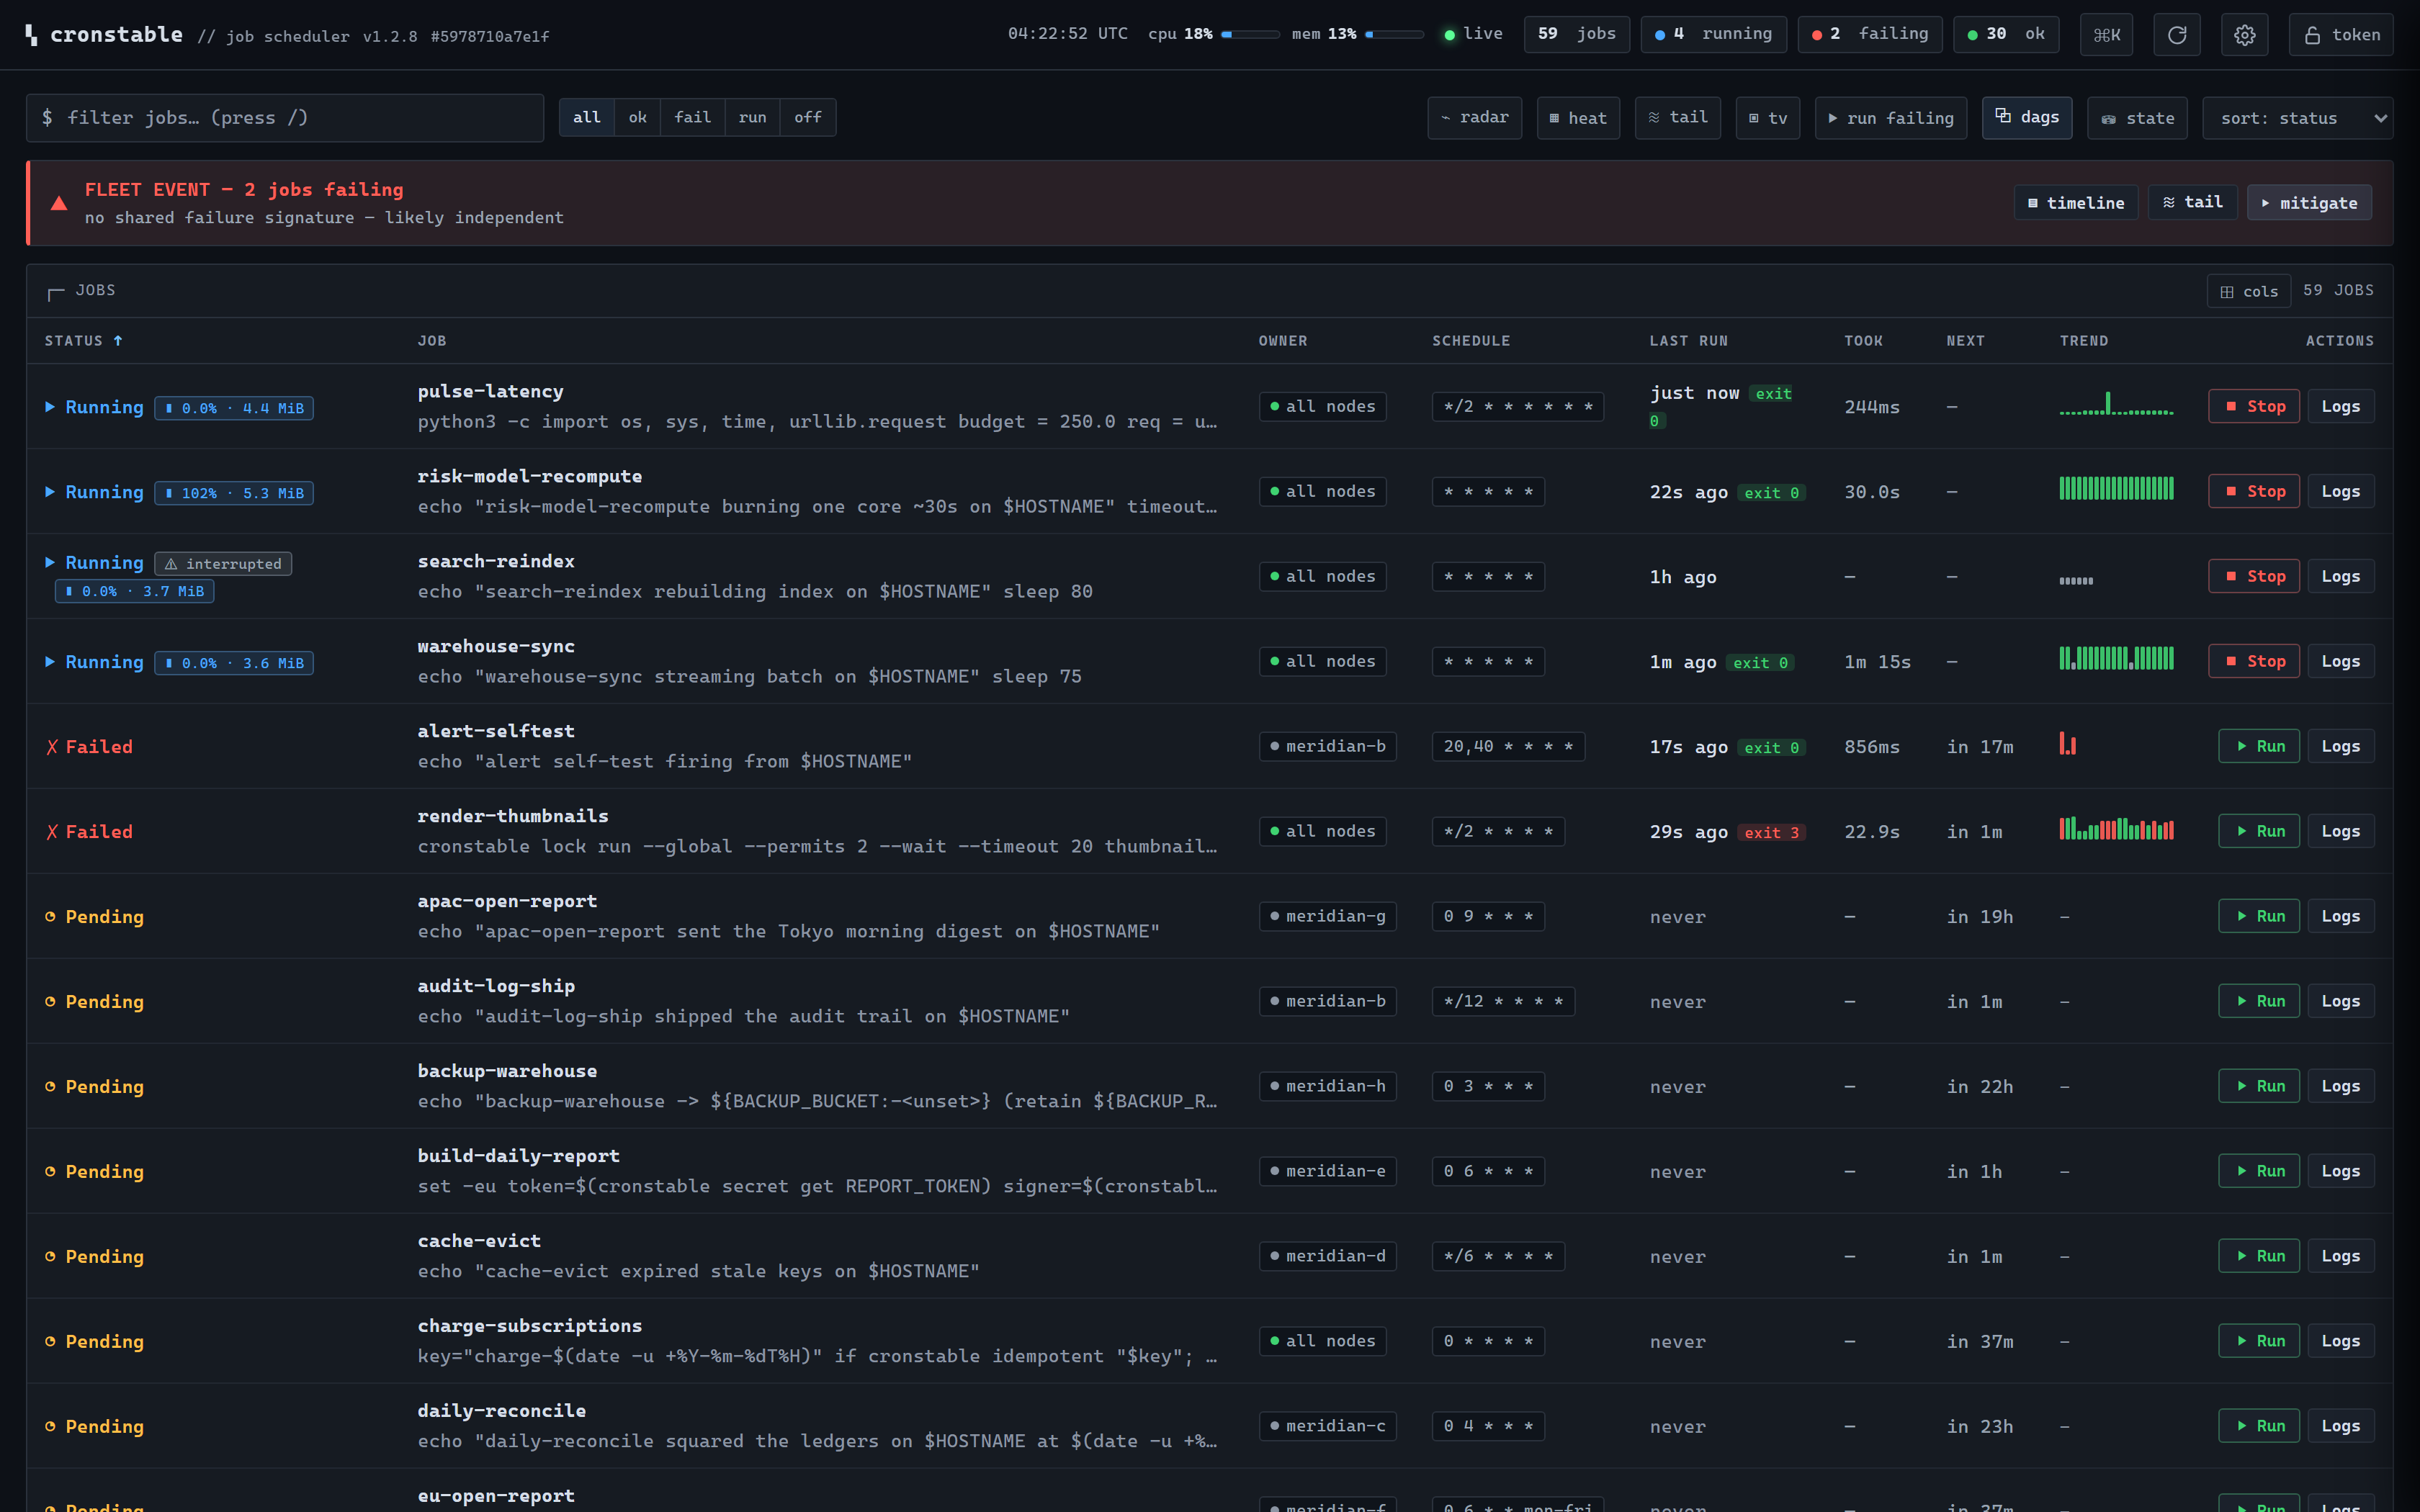
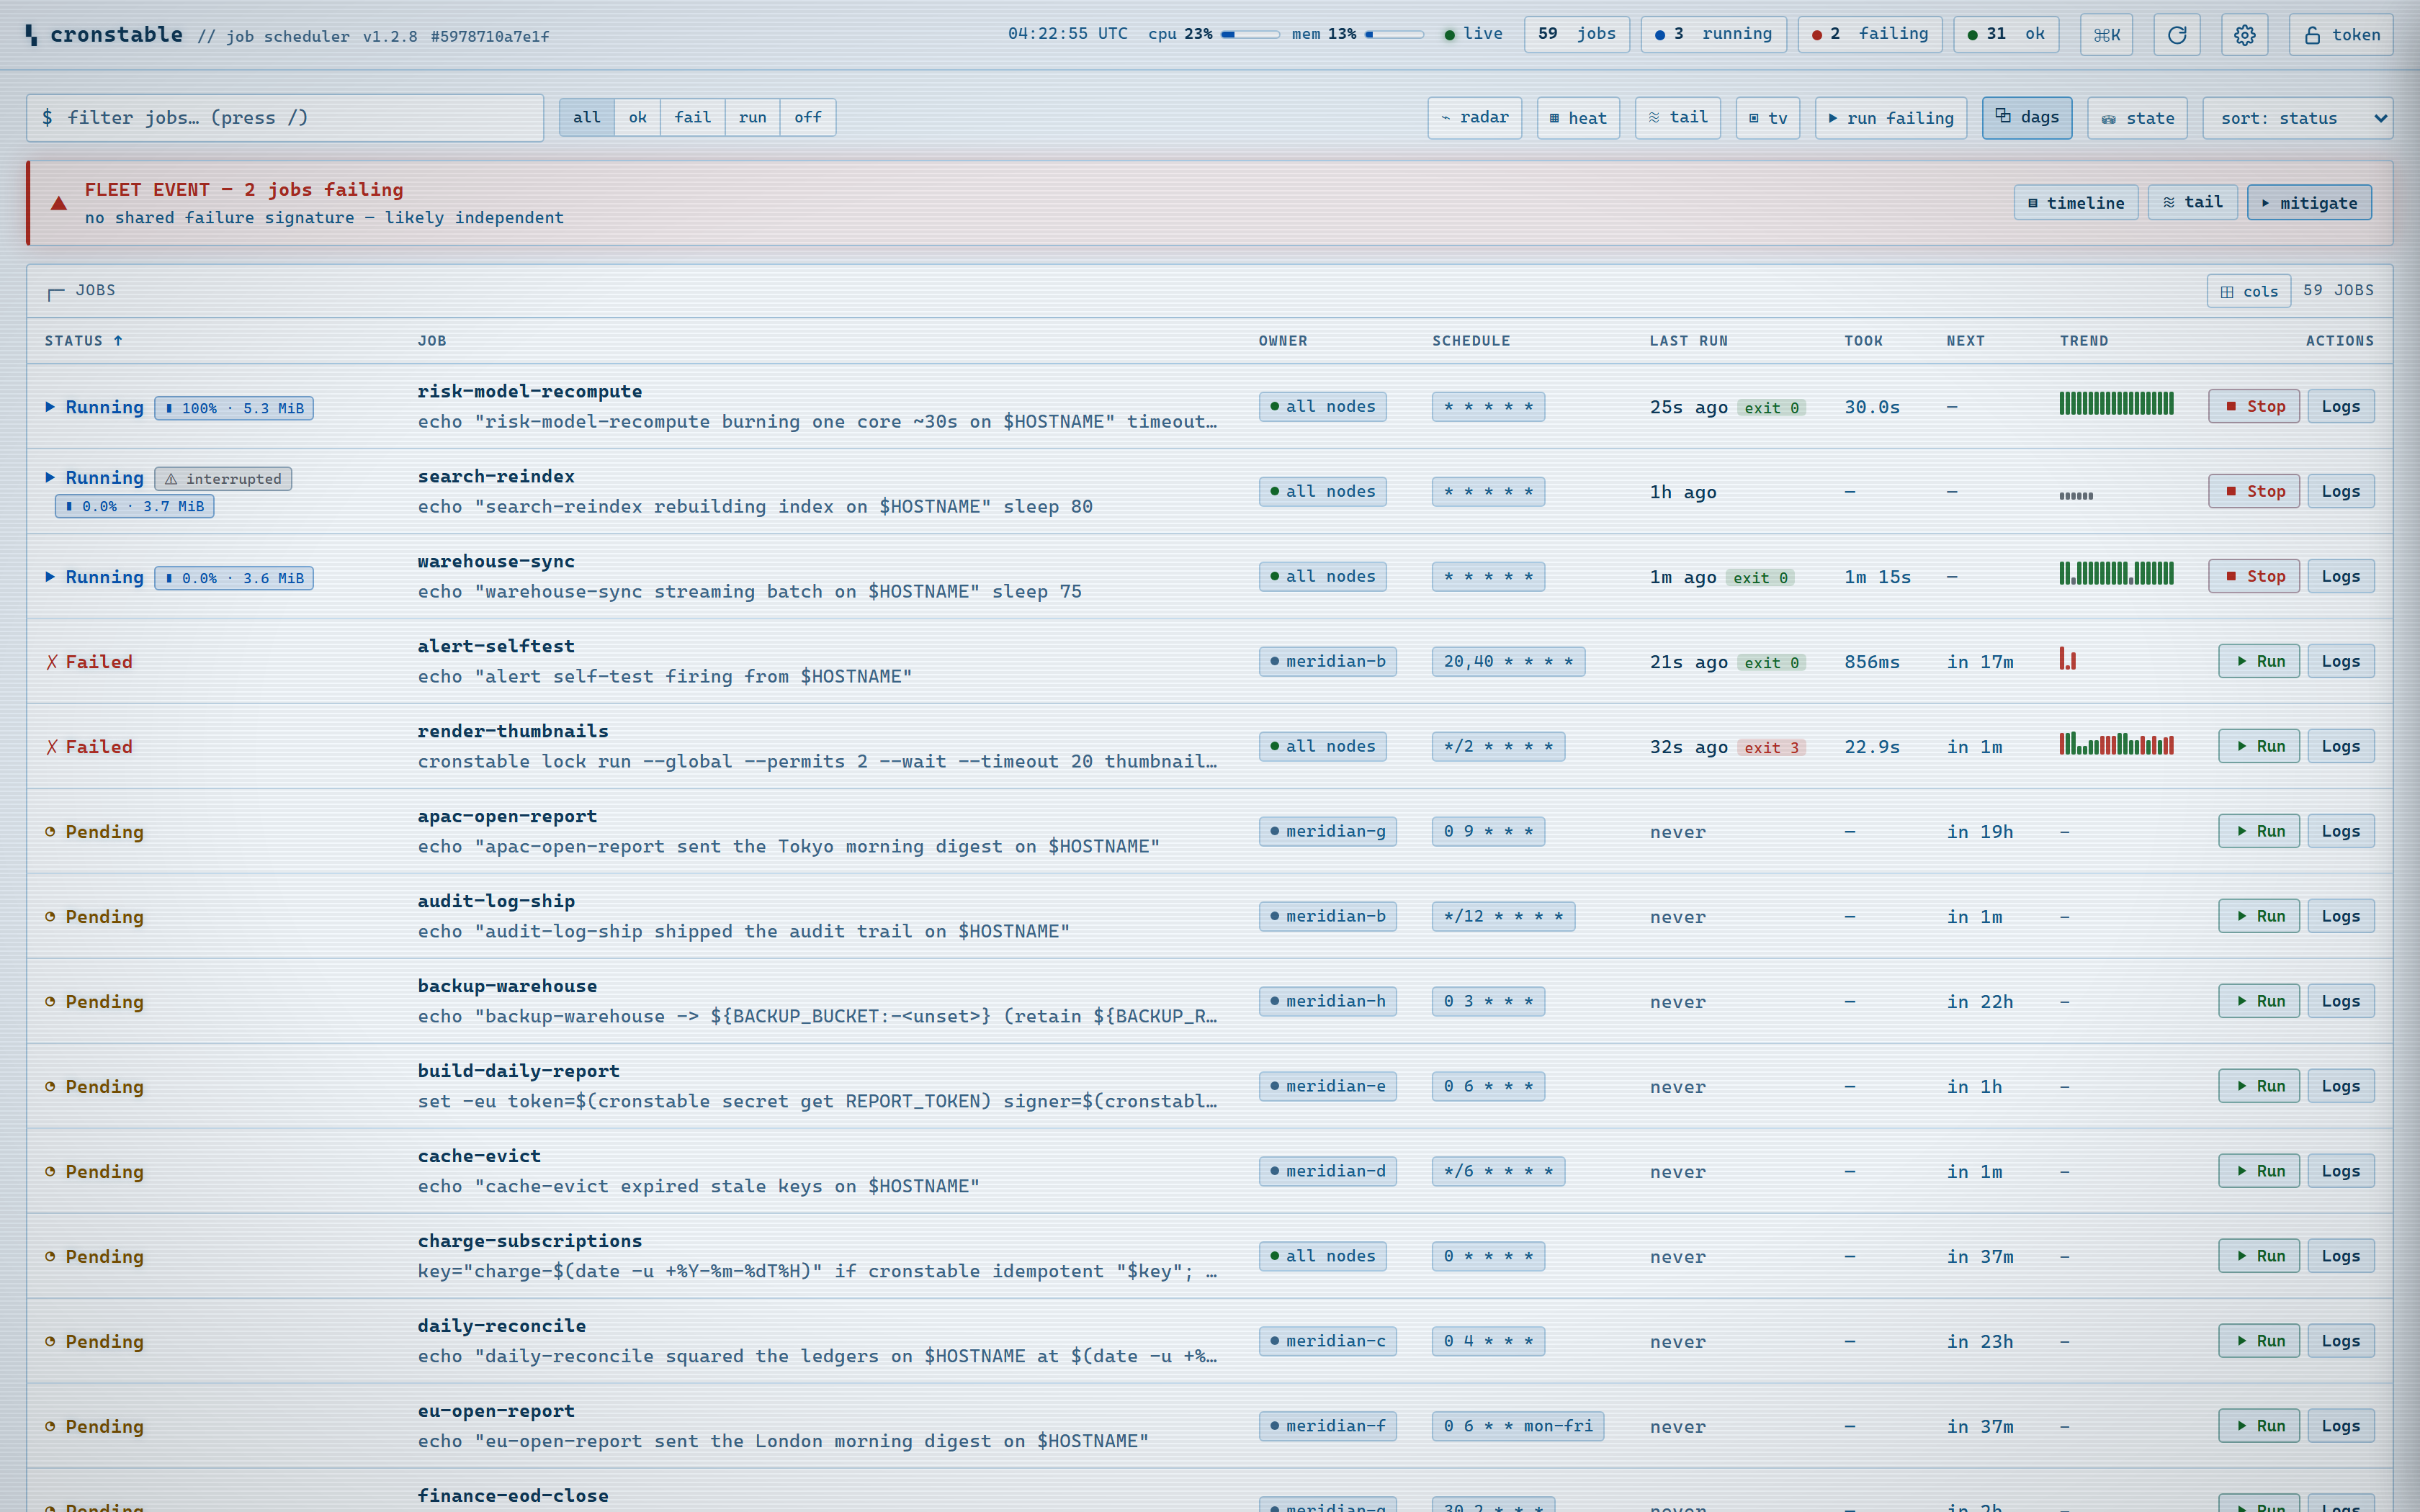
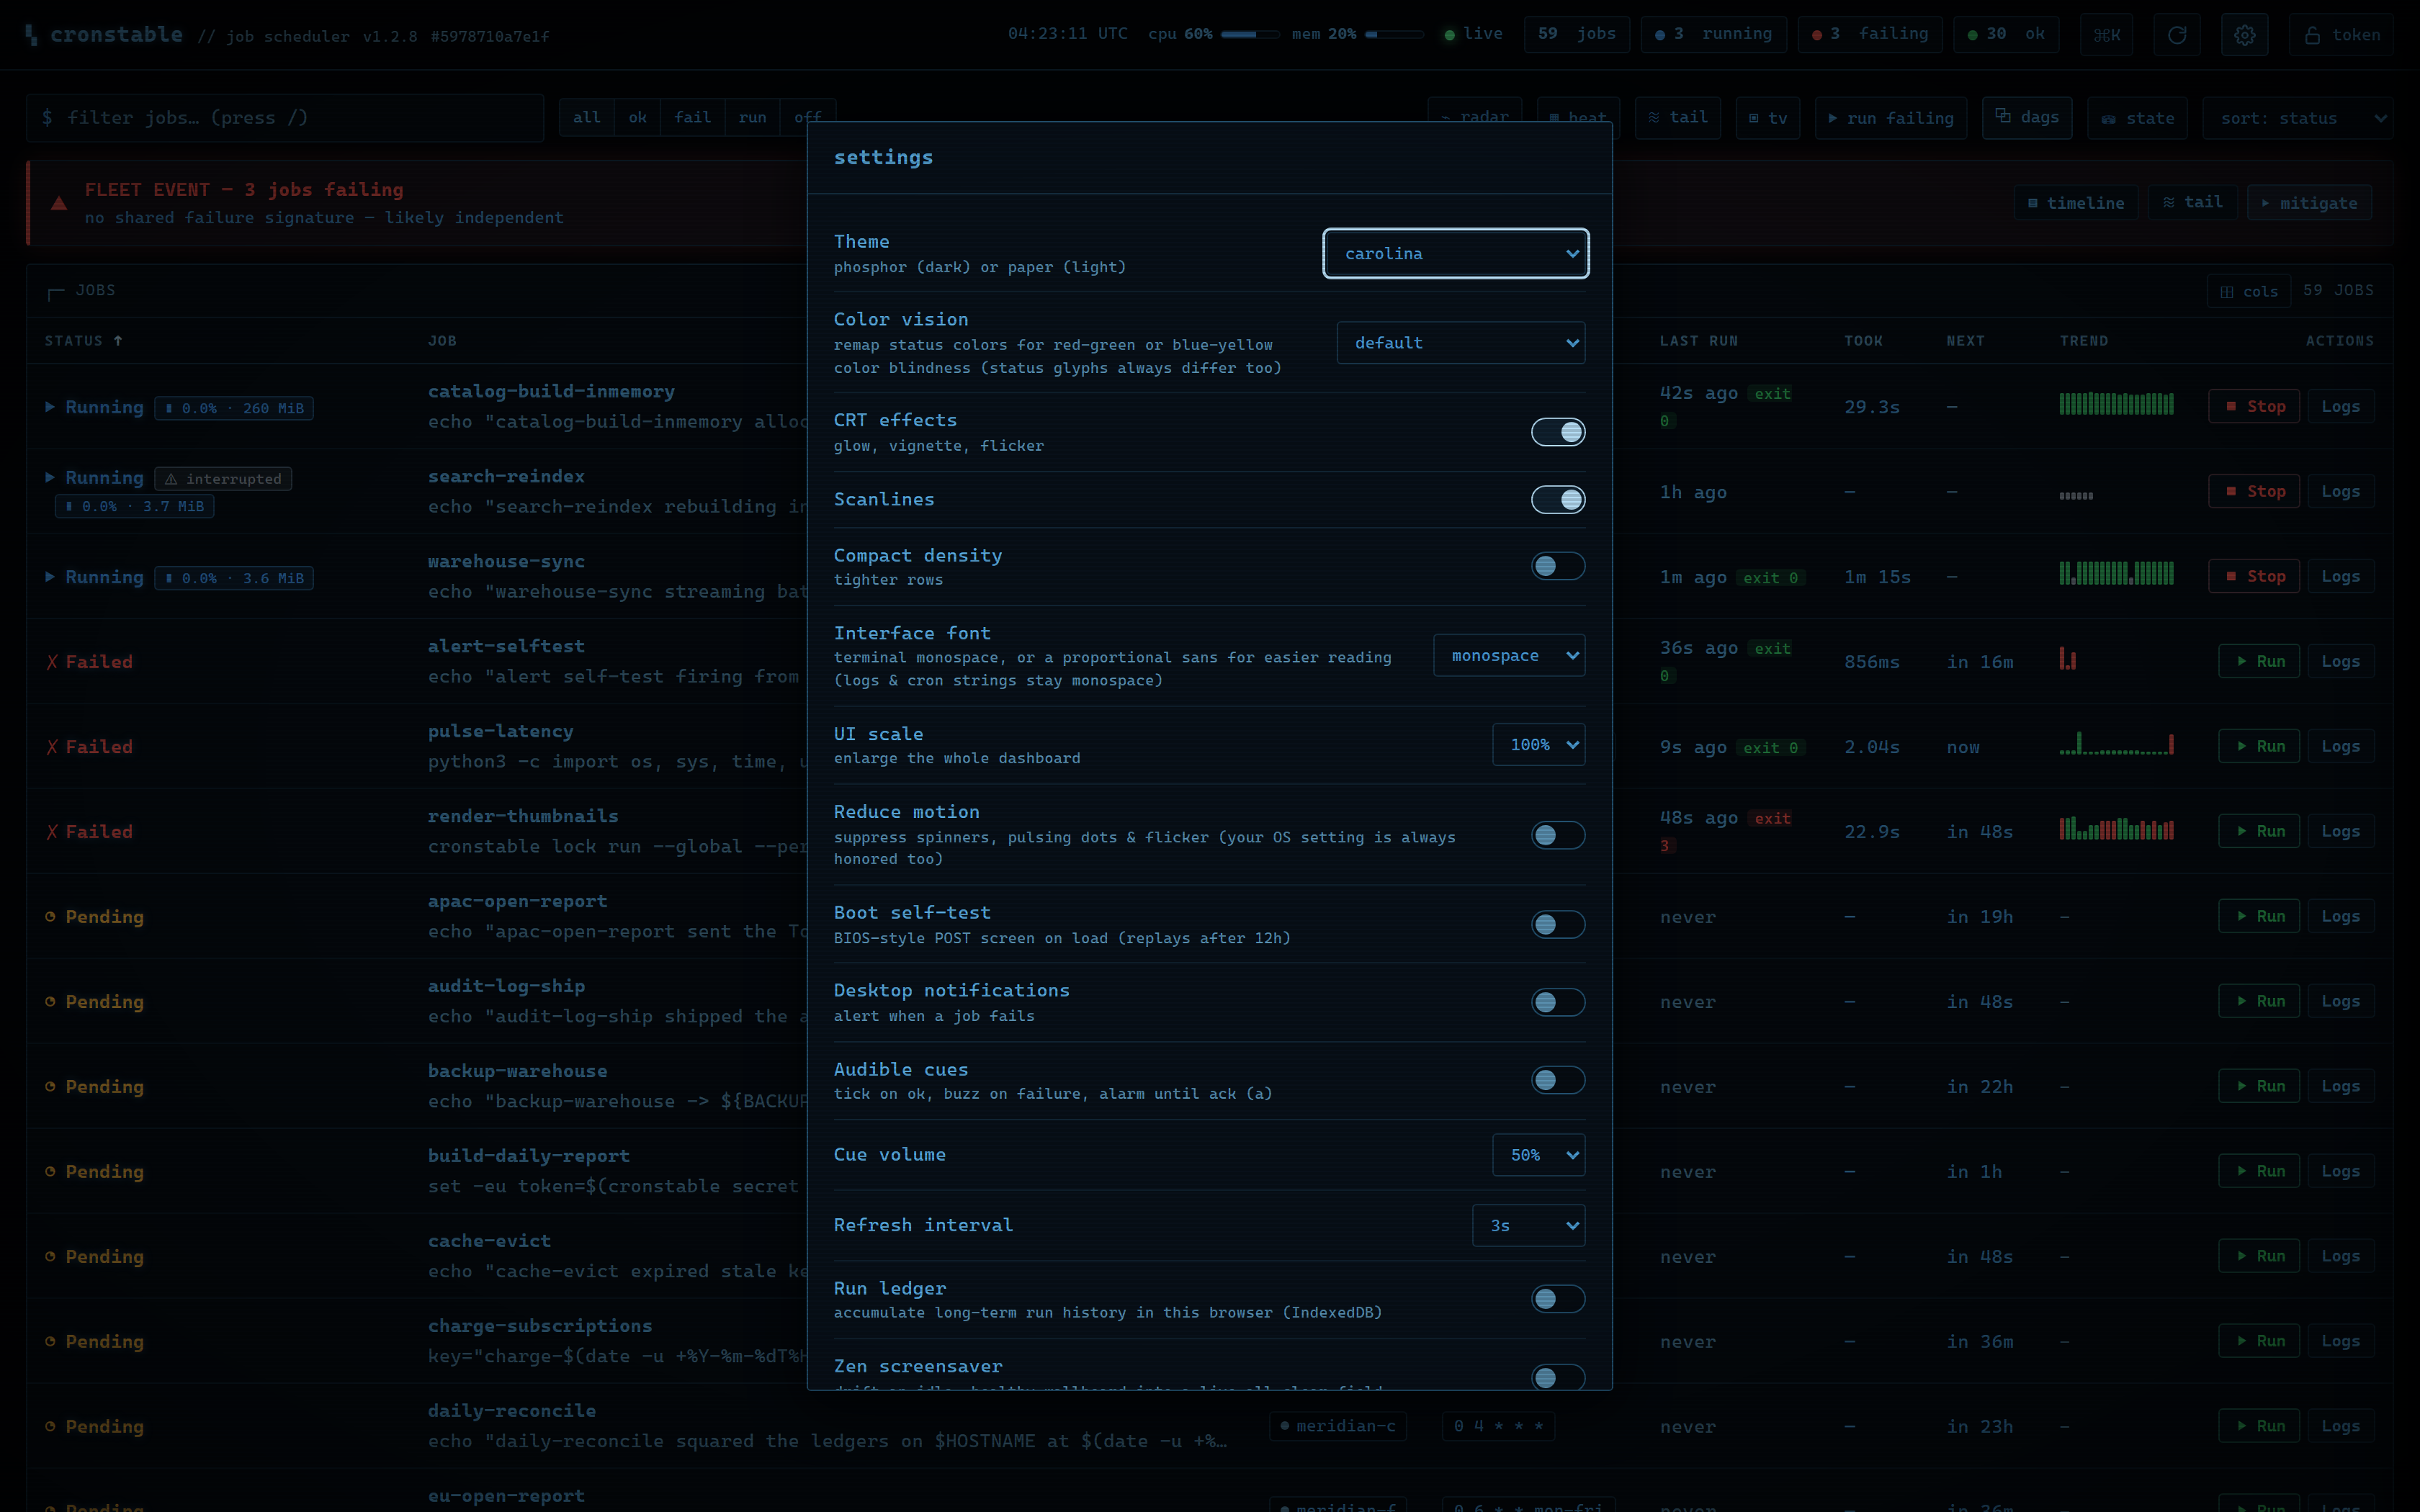
Ten themes: carolina (the default, a Carolina-blue CRT phosphor),
amber and green phosphor, and flat modern and standard looks, each in
a dark (phosphor) and a light (paper) variant. Cycle hues with t, flip
light/dark with T. CRT glow, scanlines, compact density, desktop failure
notifications, audible cues, and the polling interval are all toggles,
remembered per browser, and the CRT effects honor prefers-reduced-motion:
| Amber phosphor CRT | Green phosphor CRT |
|---|---|
 |
 |
| Flat modern theme | Carolina, on paper (light) |
|---|---|
 |
 |
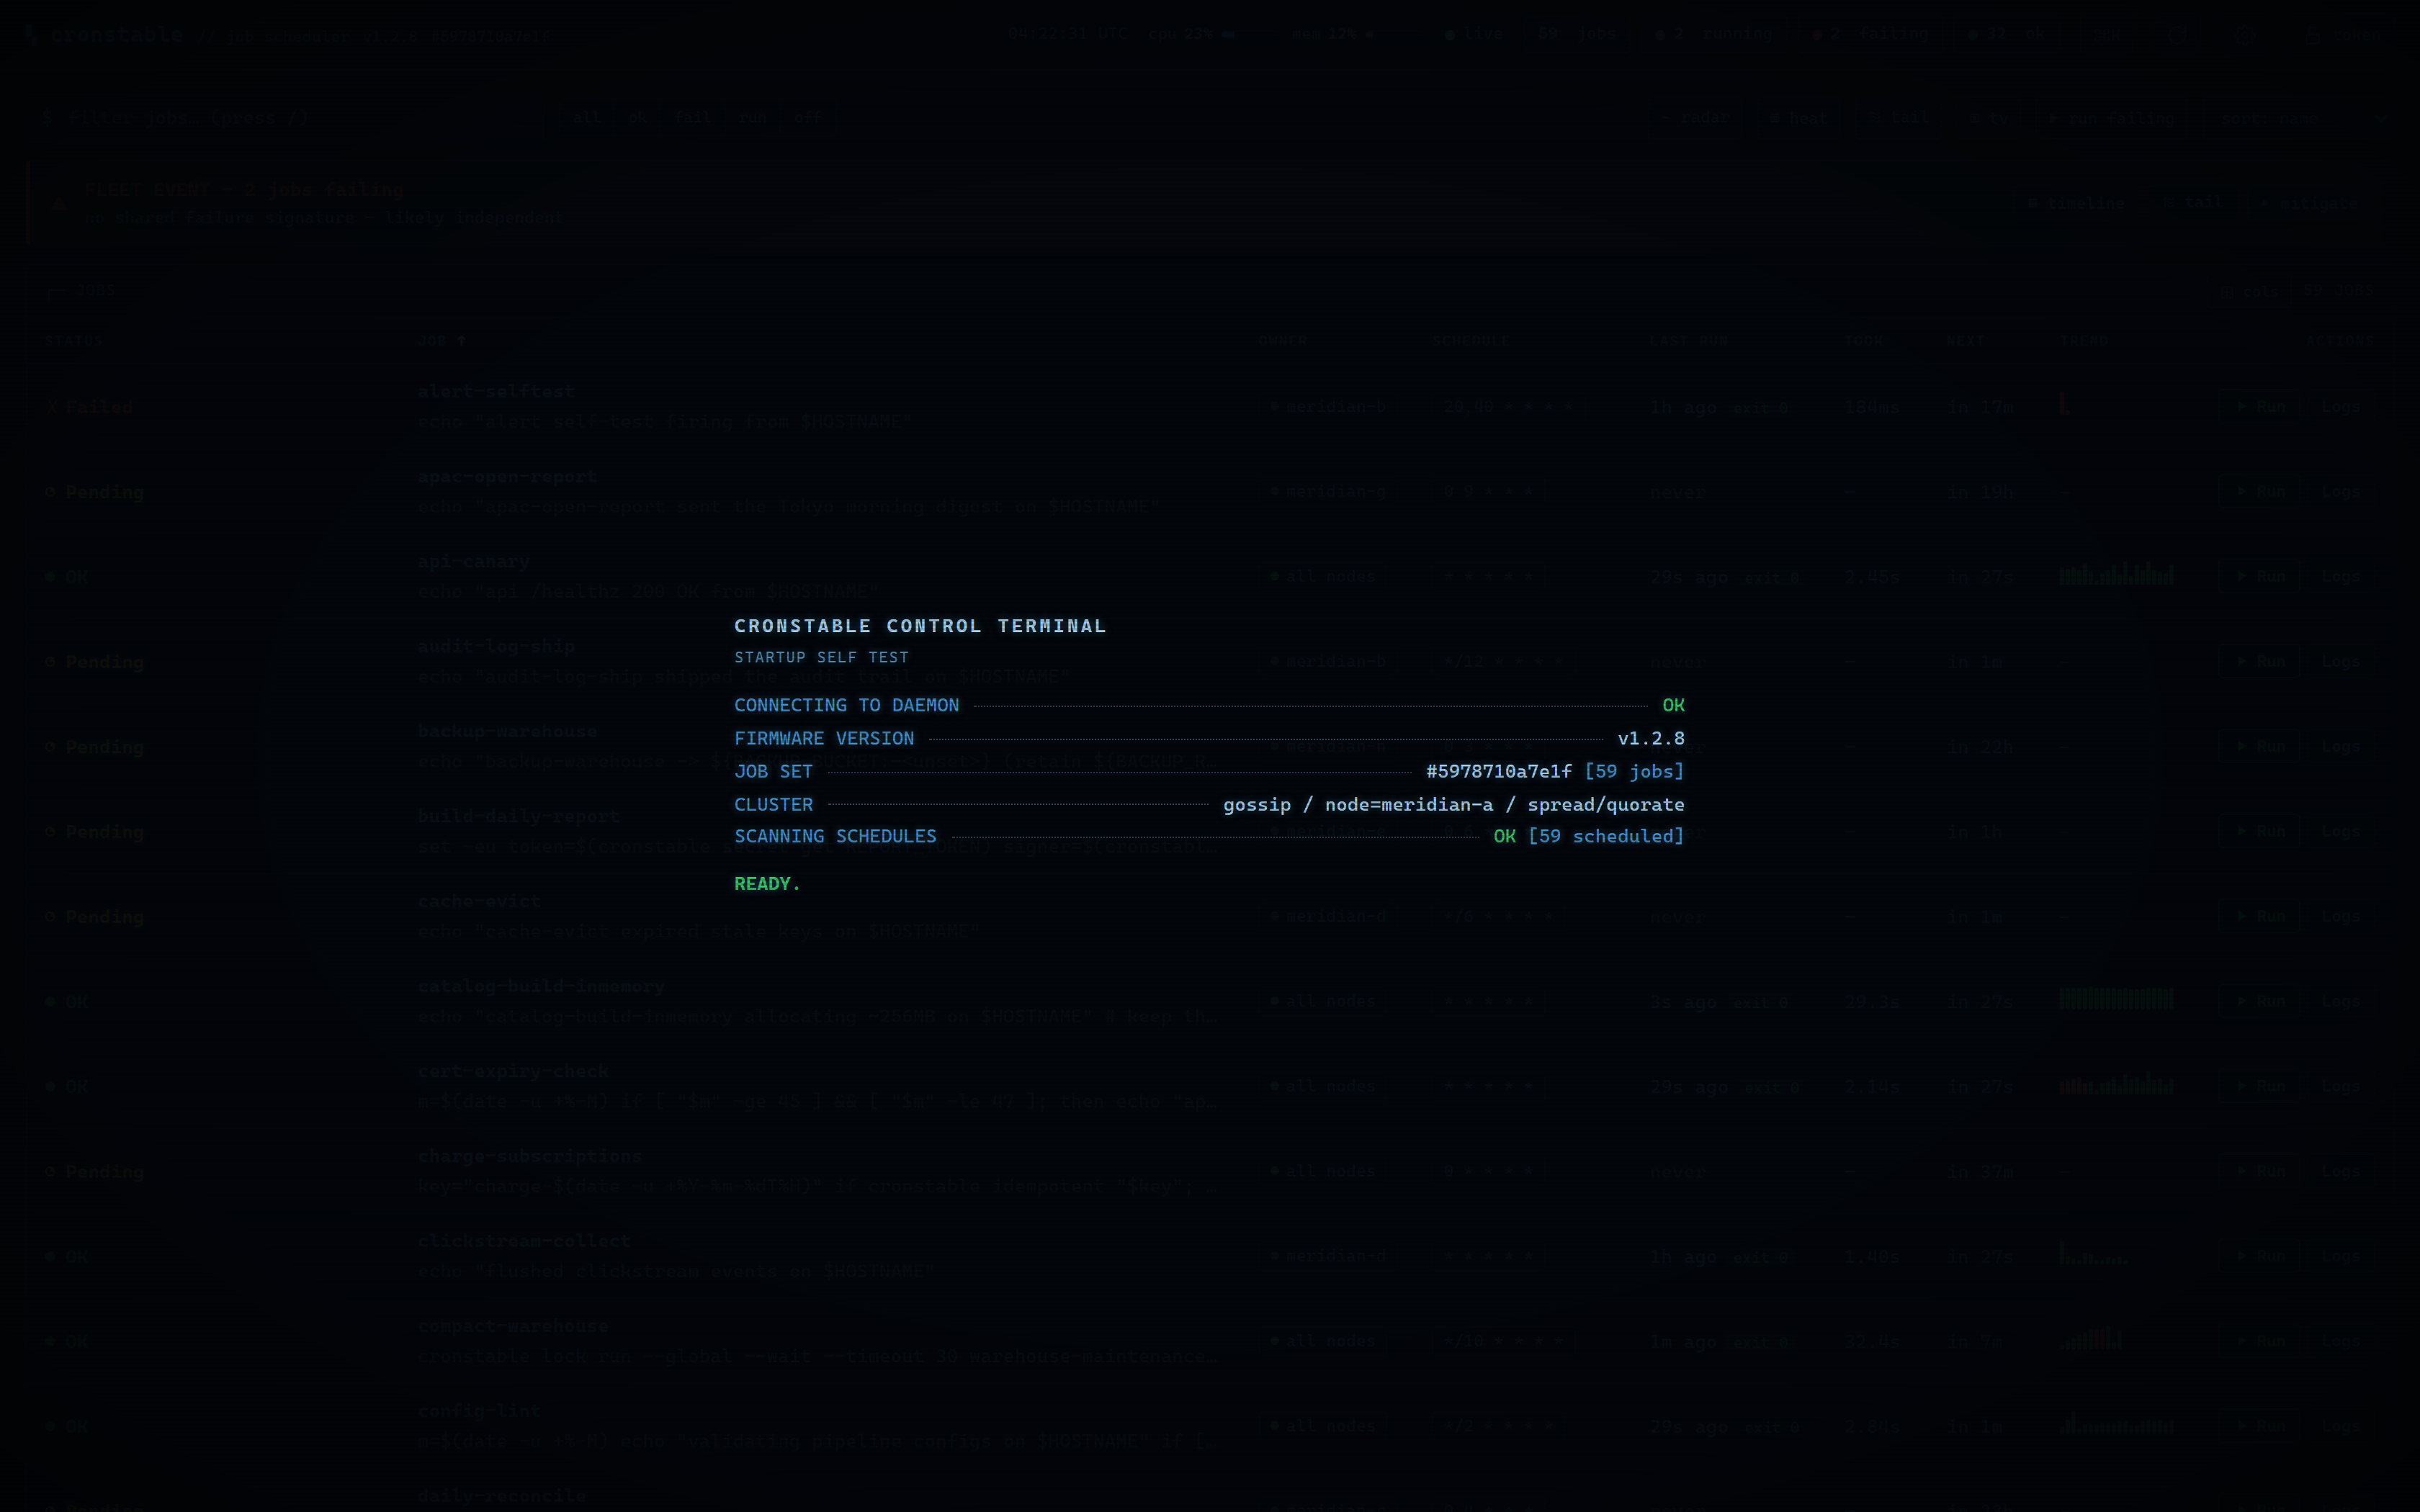
And because a control room deserves a proper power-on: an optional (on by default, once per 12 hours) BIOS-style boot self-test that checks the daemon, job set, cluster, and schedules for real while it types:
| Settings | Startup self-test |
|---|---|
 |
 |
Run history and live logs are kept in memory only (unless you opt into the
durable state store), and the page is served with a strict
Content-Security-Policy. Turn it on with a one-line web: block: the
web dashboard tour
in the wiki is the full walkthrough, and
Remote web/HTTP interface below shows how to
enable it.
Try it: docker compose -f docker-compose-zen.yml up boots a single node with a demo job set, and docker compose -f docker-compose-cluster.yml up boots a 3-node cluster (cronstable-a/cronstable-b/cronstable-c) so you can open each node's dashboard and watch the cluster panel and leader election live. For every feature at once — a 9-node mutual-TLS cluster sharing one durable state store and running the classic job set, durable-state jobs, orchestration DAGs and second-level probes together, with all four failure reporters wired to live sinks — run docker compose -f docker-compose-grand-tour.yml up --build (the grand tour; see its README). More one-command demos are in the example gallery.
Tutorials
Four short, copy-paste-runnable walkthroughs, each built on the quick start config and each ending where the wiki goes deeper.
Tutorial 1: Alert when a job fails, then retry it
Classic cron mails root and hopes. Instead: retry with exponential backoff, and page a Slack channel only if the job ultimately fails.
jobs:
  - name: nightly-backup
    command: /usr/local/bin/backup --incremental
    schedule: "0 3 * * *"
    captureStderr: true            # include stderr in the report
    onFailure:
      retry:
        maximumRetries: 5
        initialDelay: 5            # 5s, 10s, 20s, 40s, ... capped at 300s
        maximumDelay: 300
        backoffMultiplier: 2
    onPermanentFailure:            # fires once, after the last retry is spent
      report:
        webhook:
          url:
            fromEnvVar: SLACK_WEBHOOK_URL
By default a job fails when it exits non-zero or writes to a captured
stderr; tune that per job with failsWhen. The webhook's
default body is Slack-compatible (Mattermost and Teams work as-is), and mail,
Sentry, and a shell command are equally one block away, with jinja2 templating
over the run's name, output, and exit code. Deeper:
Failure Detection and Retries
and Reporting in the wiki.
Tutorial 2: Survive restarts, catch up what was missed
Stateless is the default, and a feature. But when a deploy or a reboot lands
mid-schedule, one state: block gives jobs a memory:
state:
  path: /var/lib/cronstable           # a local dir, or a shared mount for a fleet

jobs:
  - name: hourly-invoice-emit
    command: python -m billing.emit_hourly
    schedule: "0 * * * *"
    onMissed: run-all              # replay each hour missed while we were down
    startingDeadlineSeconds: 21600 # ...unless the slot is older than 6h
    onFailure:
      retry:
        maximumRetries: 10
        initialDelay: 30
        maximumDelay: 600
        backoffMultiplier: 2
With just the state.path line, run history survives restarts (the dashboard
rehydrates it), armed retries re-arm at their absolute deadlines, @reboot
means once per boot rather than once per daemon start, and Prometheus
counters stop resetting to zero. onMissed adds catch-up on top: run-once
coalesces any number of missed slots into one launch, run-all replays each
one, bounded by startingDeadlineSeconds. The same store also hands your job
commands durable primitives (key/value, cursors, fleet-wide locks,
idempotency keys, artifacts, run-scoped secrets) over a loopback endpoint:
cronstable state|cursor|lock|idempotent|artifact|secret. Deeper:
Durable State.
Tutorial 3: Your first DAG, a durable pipeline
A dags: block turns the scheduler into a small, durable workflow engine.
This one builds, waits for a human, then publishes:
state:
  path: /var/lib/cronstable           # DAGs live on the state store

dags:
  - name: release-train            # no schedule: manual-only
    tasks:
      - id: build
        command: make dist
      - id: approve
        type: approval             # parks the graph on a human decision
        dependsOn: [build]
      - id: publish
        dependsOn: [approve]
        command: make publish
        retries: 2                 # task-level retries, DAG-owned
        retryDelaySeconds: 60
Trigger it and approve the gate (or click Approve in the dashboard's DAG drawer):
curl -X POST http://127.0.0.1:8080/dags/release-train/trigger
# -> {"dag": "release-train", "runKey": "manual-..."}
curl -X POST http://127.0.0.1:8080/dags/release-train/runs/<runKey>/tasks/approve/decision \
     -H 'Content-Type: application/json' -d '{"decision": "approve", "by": "alice"}'
Every transition is durable: restart the daemon mid-run and the run resumes
exactly where it was, and across a fleet the run advances under a lease so a
task never launches twice. Scheduled DAGs add catch-up and backfill over a
date range; tasks can pass data with cronstable xcom push/pull, fan out
dynamically over a list an upstream task produced, and poll for conditions
with type: sensor. Deeper:
Orchestration and DAGs.
Tutorial 4: Two replicas, zero double-runs
Run the same config on two (or nine) hosts that share a POSIX mount, and let them elect a leader through a fenced lease file, with no certificates and no coordination service:
state:
  path: /mnt/shared/cronstable/state  # shared durable state (optional but natural here)

cluster:
  backend: filesystem
  filesystem:
    path: /mnt/shared/cronstable      # the mount is the election store
  nodeName: node-a                 # unique and stable per replica!
  electLeader: true

jobs:
  - name: charge-subscriptions
    command: python -m billing.charge
    schedule: "0 6 * * *"
    clusterPolicy: Leader          # the default: exactly the leader runs it
Only the elected leader fires Leader jobs; stop it and a follower adopts the
lease within its TTL. Per job, clusterPolicy picks the trade-off:
Leader (never double-runs, may skip when quorum is lost), PreferLeader
(never skips, may double-run under a partition), or EveryNode (genuinely
per-node work). No shared mount? The gossip backend elects over mutual TLS
with no shared store at all, kubernetes uses a coordination.k8s.io Lease,
and etcd a lease-bound key; distribution: spread load-balances job
ownership across the fleet instead of concentrating it on one leader. Deeper:
Clustering and Leader Election.
Example gallery
Every example in example/ is a self-contained, annotated,
runnable project; the compose files live in the repo root. Highlights:
| Example | One command | Shows off |
|---|---|---|
demo |
docker compose up |
The dashboard playground: varied jobs, live logs, retries, a long-runner, an on-demand job. |
grand-tour |
docker compose -f docker-compose-grand-tour.yml up --build |
Everything at once: a 9-node mTLS cluster, shared durable state, five DAG patterns, second-level probes, all four reporters wired to live sinks. |
cluster |
docker compose -f docker-compose-cluster.yml up |
A 3-node gossip cluster: peer attestation, quorum, leader election, live failover. |
cluster-large |
docker compose -f docker-compose-cluster-large.yml up |
A 10-node, CPU-heavy fleet for watching distribution: spread and the load meters. |
dag |
cronstable -c example/dag |
Orchestration alone, single node: dependencies, XCom, fan-out, a sensor, an approval gate. |
dag-cluster |
docker compose -f example/dag-cluster/docker-compose.yml up |
DAGs coordinating across three nodes on one shared store: crash-resume, exactly-once tasks. |
job-state |
cronstable -c example/job-state |
The job-facing state primitives: KV, cursors, locks, idempotency keys, artifacts, secrets. |
pulse-monitor |
docker compose -f docker-compose-pulse.yml up |
Second-level scheduling as a real-time uptime / SLA monitor. |
pulse-cluster |
docker compose -f docker-compose-pulse-cluster.yml up |
The same probes fanned across a 3-node leader-electing cluster. |
acme-platform |
docker compose -f docker-compose-acme.yml up |
A realistic 5-node "data platform back-office" showcase. |
zen-demo |
docker compose -f docker-compose-zen.yml up |
A deliberately calm board, for the wallboard's zen screensaver. |
crontab |
cronstable -c example/crontab |
Classic Vixie crontabs running as-is next to YAML jobs. |
kubernetes |
kubectl apply -f example/kubernetes/deployment.yaml |
Leader election through a coordination.k8s.io/v1 Lease. |
etcd |
docker compose -f example/etcd/docker-compose.yml up |
Leader election through an etcd lease, over plain HTTP. |
docker |
docker build |
The minimal "add cronstable to your own image" recipe. |
Usage
Configuration is in YAML format. To start cronstable, give it a configuration file
or directory path as the -c argument. For example:
cronstable -c /tmp/my-crontab.yaml
This starts cronstable (always in the foreground!), reading
/tmp/my-crontab.yaml as configuration file. If the path is a directory,
any *.yaml or *.yml files inside this directory are taken as
configuration files, along with any classic crontabs (*.crontab, *.cron,
or a file named crontab; see
Classic crontab files).
Configuration basics
This configuration runs a command every 5 minutes:
jobs:
  - name: test-01
    command: echo "foobar"
    shell: /bin/bash
    schedule: "*/5 * * * *"
The command can be a string or a list of strings. If command is a string,
cronstable runs it through a shell, which is /bin/bash in the above example, but
is /bin/sh by default.
If the command is a list of strings, the command is executed directly, without a shell. The ARGV of the command to execute is extracted directly from the configuration:
jobs:
  - name: test-01
    command:
      - echo
      - foobar
    schedule: "*/5 * * * *"
The schedule option can be a string in the classic crontab format (5, 6 or 7 fields; ranges, steps, lists and jan/mon names), parsed by cronstable's built-in cron engine — see Schedules and Timezones for the full dialect.
Additionally @reboot can be included , which will only run the job when cronstable is initially
executed. Further schedule can be an object with properties. The following configuration
runs a command every 5 minutes, but only on the specific date 2017-07-19, and
doesn't run it in any other date:
jobs:
  - name: test-01
    command: echo "foobar"
    schedule:
      minute: "*/5"
      dayOfMonth: 19
      month: 7
      year: 2017
      dayOfWeek: "*"
Second-level schedules
Schedules are minute-granular by default, but cronstable can also run jobs at second granularity. There are two equivalent spellings:
- a full seven-field crontab string, where the first field is the second
(
second minute hour dayOfMonth month dayOfWeek year); or - the object form with a
second:property.
Both of the jobs below run every 15 seconds (at seconds 0, 15, 30 and 45 of every minute):
jobs:
  - name: every-15s-string
    command: echo "tick"
    schedule: "*/15 * * * * * *"   # 7 fields: the leading field is seconds
  - name: every-15s-object
    command: echo "tick"
    schedule:
      second: "*/15"
The second field accepts the same syntax as the others (*, */5, 0,30,
10-20, ...). second: "*" (or * * * * * * *) fires every second.
While any enabled job specifies seconds, the scheduler wakes once per second instead of once per minute; minute-granular jobs are unaffected and still fire exactly once in their scheduled minute. If no job uses seconds, cronstable keeps its original once-a-minute cadence, so there is no overhead for the common case.
Second-level scheduling is a YAML feature: classic crontab files
keep their standard five-field, minute-granular format. (A six-field string
is read as the classic five fields plus a trailing year column, not as
seconds; seconds require the full seven fields.)
For a runnable end-to-end example, see
example/pulse-monitor — a small real-time uptime / SLA
monitor that probes a service every few seconds
(docker compose -f docker-compose-pulse.yml up) — and its clustered sibling
example/pulse-cluster, which fans the probes across a
three-node leader-electing cluster
(docker compose -f docker-compose-pulse-cluster.yml up).
Important: by default all time is interpreted to be in UTC, but you can
request to use local time instead. For instance, the cron job below runs
every day at 19h27 local time because of the utc: false option:
jobs:
  - name: test-01
    command: echo "hello"
    schedule: "27 19 * * *"
    utc: false
    captureStdout: true
You can also request that the schedule be
interpreted in an arbitrary timezone, using the timezone attribute:
jobs:
  - name: test-01
    command: echo "hello"
    schedule: "27 19 * * *"
    timezone: America/Los_Angeles
    captureStdout: true
You can ask for environment variables to be defined for command execution:
jobs:
  - name: test-01
    command: echo "foobar"
    shell: /bin/bash
    schedule: "*/5 * * * *"
    environment:
      - key: PATH
        value: /bin:/usr/bin
You can also provide an environment file to define environments for command execution:
jobs:
  - name: test-01
    command: echo "foobar"
    shell: /bin/bash
    schedule: "*/5 * * * *"
    env_file: .env
The env file must be a list of KEY=VALUE pairs. Empty lines and lines starting with # will be ignored.
Variables declared in the environment option will override those found in the env_file.
Classic crontab files
Already have a crontab? cronstable runs it as-is. A file named *.crontab,
*.cron, or just crontab (so -c /etc/crontab works) is read in the
classic Vixie format, whether passed directly to -c, dropped into a config
directory next to YAML files, or pulled in with include::
SHELL=/bin/bash
PATH=/usr/local/bin:/usr/bin:/bin

# m h dom mon dow command
*/15 * * * *  /usr/local/bin/backup --incremental
30 4 * * mon-fri  /usr/local/bin/report --daily
@daily  /usr/local/bin/rotate-logs
0 0 * * *  pg_dump mydb > /backup/mydb-$(date +\%F).sql
Comments, NAME=value environment lines (position-sensitive, SHELL and
CRON_TZ honored), the @reboot/@daily/... nicknames, and \% escapes
all work as in man 5 crontab. Each entry becomes an ordinary cronstable job
named <file>:<line>, configured to cronstable's standard defaults rather than
an emulation of cron's environment: schedules run in UTC unless the
crontab sets CRON_TZ, failure means a non-zero exit or stderr output (no
MAILTO mail), and the %-as-stdin feature is a load-time error instead of
a silent surprise (\% still gives a literal %). When an entry needs
retries, reporting, timeouts, or any other per-job option, move it to YAML.
The full mapping and every deviation are documented in the
Classic Crontabs
wiki page, and a runnable example (a config directory mixing a crontab with
YAML and the dashboard) lives in example/crontab.
Specifying defaults
There can be a special defaults section in the config. Any attributes
defined in this section provide default values for cron jobs to inherit.
Although cron jobs can still override the defaults, as needed:
defaults:
    environment:
      - key: PATH
        value: /bin:/usr/bin
    shell: /bin/bash
    utc: false
jobs:
  - name: test-01
    command: echo "foobar"  # runs with /bin/bash as shell
    schedule: "*/5 * * * *"
  - name: test-02  # runs with /bin/sh as shell
    command: echo "zbr"
    shell: /bin/sh
    schedule: "*/5 * * * *"
Note: if the configuration option is a directory and there are multiple configuration files in that directory, then the defaults section in each configuration file provides default options only for cron jobs inside that same file; the defaults have no effect beyond any individual YAML file.
Reporting
Cronstable has builtin support for reporting jobs failure (more on that below) by email, Sentry, shell command, and HTTP webhook (Slack-compatible out of the box):
- name: test-01
  command: |
    echo "hello" 1>&2
    sleep 1
    exit 10
  schedule:
    minute: "*/2"
  captureStderr: true
  onFailure:
    report:
      sentry:
        dsn:
          value: example
          # Alternatively:
          # fromFile: /etc/secrets/my-secret-dsn
          # fromEnvVar: SENTRY_DSN
        fingerprint:  # optional
          - cronstable
          - "{{ environment.HOSTNAME }}"
          - "{{ name }}"
        extra:
          foo: bar
          zbr: 123
        level: warning
        environment: production
      mail:
        from: example@foo.com
        to: example@bar.com
        smtpHost: 127.0.0.1
        # optional fields:
        username: "username1"  # set username and password to enable login
        password:
          value: example
          # Alternatively:
          # fromFile: /etc/secrets/my-secret-password
          # fromEnvVar: MAIL_PASSWORD
        tls: false  # set to true to enable TLS
        starttls: false  # set to true to enable StartTLS
      shell:
        shell: /bin/bash
        command: ...
      webhook:
        url:
          fromEnvVar: SLACK_WEBHOOK_URL
Here, the onFailure object indicates that what to do when a job failure
is detected. In this case we ask for it to be reported both to sentry and by
sending an email.
The captureStderr: true part instructs cronstable to capture output from the the
program's standard error, so that it can be included in the report. We could
also turn on standard output capturing via the captureStdout: true option.
By default, cronstable captures only standard error. If a cron job's standard error
or standard output capturing is not enabled, these streams will simply write to
the same standard output and standard error as cronstable itself.
Both stdout and stderr stream lines are by default prefixed with
[{job_name} {stream_name}], i.e. [test-01 stdout], if for any reason you
need to change this, provide the option streamPrefix
with your own custom string.
- name: test-01
  command: echo "hello world"
  schedule:
    minute: "*/2"
  captureStdout: true
  streamPrefix: "[{job_name} job]"
In some cases, for instance when you're logging JSON objects you might want to completely get rid of the prefix altogether:
- name: test-01
  command: echo "hello world"
  schedule:
    minute: "*/2"
  captureStdout: true
  streamPrefix: ""
It is possible also to report job success, as well as failure, via the
onSuccess option.
- name: test-01
  command: echo "hello world"
  schedule:
    minute: "*/2"
  captureStdout: true
  onSuccess:
    report:
      mail:
        from: example@foo.com
        to: example@bar.com
        smtpHost: 127.0.0.1
It is possible to customize the format of the report. For
mail reporting, the option subject indicates what is the subject of the
email, while body formats the email body. For Sentry reporting, there is
only body. In all cases, the values of those options are strings that are
processed by the jinja2 templating engine. The following variables are
available in templating:
- name(str): name of the cron job
- success(bool): whether or not the cron job succeeded
- stdout(str): standard output of the process
- stderr(str): standard error of the process
- exit_code(int): process exit code
- command(str): cron job command
- shell(str): cron job shell
- environment(dict): subprocess environment variables
Example:
- name: test-01
  command: |
    echo "hello" 1>&2
    sleep 1
    exit 10
  schedule:
    minute: "*/2"
  captureStderr: true
  onFailure:
    report:
      mail:
        from: example@foo.com
        to: example@bar.com
        smtpHost: 127.0.0.1
        subject: Cron job '{{name}}' {% if success %}completed{% else %}failed{% endif %}
        body: |
          {{stderr}}
          (exit code: {{exit_code}})
The shell reporter executes a user given shell command in the specified shell. It passes all environment variables from the python executable and specifies some additional ones to inform about the state of the job:
- CRONSTABLE_FAIL_REASON (str)
- CRONSTABLE_FAILED ("1" or "0")
- CRONSTABLE_JOB_NAME (str)
- CRONSTABLE_JOB_COMMAND (str)
- CRONSTABLE_JOB_SCHEDULE (str)
- CRONSTABLE_RETCODE (str)
- CRONSTABLE_STDERR (str)
- CRONSTABLE_STDOUT (str)
A simple example configuration:
- name: test-01
  command: echo "foobar" && exit 123
  shell: /bin/bash
  schedule: "* * * * *"
  onFailure:
    report:
      shell:
        shell: /bin/bash
        command: echo "Error code $CRONSTABLE_RETCODE"
The webhook reporter sends an HTTP POST to a URL of your choice. The default
body is a Slack-compatible {"text": ...} JSON payload, so pointing it at a
Slack, Mattermost, or Teams incoming-webhook URL works with no further
configuration; method, contentType, headers, timeout, and the jinja2
body template are all configurable for other services (Discord, ntfy, or
your own endpoint). Like the other secrets, the URL can come from value,
fromFile, or fromEnvVar:
- name: test-01
  command: echo "foobar" && exit 123
  schedule: "* * * * *"
  onFailure:
    report:
      webhook:
        url:
          fromEnvVar: SLACK_WEBHOOK_URL
See Reporting in the wiki for all webhook options and per-service examples.
It is possible to send emails formatted as html, by adding
the html: true property. For example, here the standard output of a shell
command is captured and interpreted as html and placed in the email message:
- name: test-01
  command: echo "hello <b>world</b>"
  schedule: "@reboot"
  captureStdout: true
  onSuccess:
    report:
      mail:
        from: example@foo.com
        to: example@bar.com, zzz@sleep.com
        html: true
        smtpHost: 127.0.0.1
        smtpPort: 1025
        subject: This is a cron job with html body
Metrics
Cronstable natively exposes Prometheus metrics whenever the HTTP REST API is enabled -- no exporter sidecar needed:
web:
  listen:
    - http://127.0.0.1:8080
GET /metrics then serves job run outcomes, duration histograms, retries,
next-run times, config-reload health, and cluster/leader-election state, in
both the Prometheus text format and OpenMetrics. See
Metrics with Prometheus
for the full metric reference, scrape configuration, and example alert rules.
Cronstable also has builtin support for pushing per-job metrics to Statsd:
jobs:
  - name: test01
    command: echo "hello"
    schedule: "* * * * *"
    statsd:
      host: my-statsd.example.com
      port: 8125
      prefix: my.cron.jobs.prefix.test01
With this config Cronstable will write the following metrics over UDP
to the Statsd listening on my-statsd.example.com:8125:
my.cron.jobs.prefix.test01.start:1|g  # this one is sent when the job starts
my.cron.jobs.prefix.test01.stop:1|g   # the rest are sent when the job stops
my.cron.jobs.prefix.test01.success:1|g
my.cron.jobs.prefix.test01.duration:3|ms|@0.1
Resource monitoring
Ever wondered which cron job is eating the box?! Turn on per-job resource
accounting with a single flag (or once under defaults: for every job):
jobs:
  - name: nightly-model-refresh
    command: python -m models.refresh
    schedule: "0 4 * * *"
    monitorResources: true
While the job runs, cronstable samples its whole process tree (children and shell-outs included) with psutil, and the run ends with its total CPU time (user + system) and peak resident memory. The numbers surface everywhere the run does:
- live on the dashboard job row and drawer while it runs (
cpu 61% · 288 MiB); - per run and aggregated (avg/max CPU, peak memory) in the dashboard
History tab and
GET /jobs/{name}/runs; - as CPU/memory charts in the dashboard's Resources tab — a live
view of the running instance, the recorded profile of any recent run, and
per-run trend strips — plus a node-wide history chart behind the header
meter (
GET /jobs/{name}/resources,GET /node/history); - as Prometheus families on
GET /metrics(cronstable_job_cpu_seconds_total,cronstable_job_last_run_max_rss_bytes, ...) and over statsd when the job has a sink; - in the durable run record's
resourcesobject when a state store is configured, so it survives restarts; - in report templates (
cpu_seconds/max_rss_bytes) and the shell reporter's environment (CRONSTABLE_CPU_SECONDS/CRONSTABLE_MAX_RSS_BYTES), so a failure page can say how big the run was when it died.
It is observability only (it never changes a run's verdict), it is off by
default with zero overhead when off, and the numbers are sampled, so
short-lived runs are approximate while the long, heavy runs that matter are
sampled many times. The map form tunes the sampling cadence and how many
chart points each run keeps (monitorResources: { interval: 0.5, history: 240 }); series are downsampled in place so even a days-long run stays a few
KB. DAG tasks accept the same flag; their usage lands in the
task record of the dag_run document. On a cluster,
cluster.observability additionally shares each node's whole-host
CPU/memory so the dashboard's cluster panel and fleet view show where the
load actually is. The full semantics live in the
Configuration Reference.
Handling failure
By default, cronstable considers that a job has failed if either the process returns a non-zero code or if it generates output to standard error (and standard error capturing is enabled, of course).
You can instruct cronstable how to determine if a job has failed or not via the
failsWhen option:
failsWhen:
  producesStdout: false
  producesStderr: true
  nonzeroReturn: true
  always: false
producesStdout : If true, any captured standard output causes cronstable to consider the job as failed. This is false by default.
producesStderr : If true, any captured standard error causes cronstable to consider the job as failed. This is true by default.
nonzeroReturn : If true, if the job process returns a code other than zero causes cronstable to consider the job as failed. This is true by default.
always : If true, if the job process exits that causes cronstable to consider the job as failed. This is false by default.
It is possible to instruct cronstable to retry failing cron jobs by adding a
retry option inside onFailure:
- name: test-01
  command: |
    echo "hello" 1>&2
    sleep 1
    exit 10
  schedule:
    minute: "*/10"
  captureStderr: true
  onFailure:
    report:
      mail:
        from: example@foo.com
        to: example@bar.com
        smtpHost: 127.0.0.1
    retry:
      maximumRetries: 10
      initialDelay: 1
      maximumDelay: 30
      backoffMultiplier: 2
The above settings tell cronstable to retry the job up to 10 times, with the delay between retries defined by an exponential backoff process: initially 1 second, doubling for every retry up to a maximum of 30 seconds. A value of -1 for maximumRetries will mean cronstable will keep retrying forever, this is mostly useful with a schedule of "@reboot" to restart a long running process when it has failed.
Retries are in-memory by default: a daemon restart forgets an armed retry. With
a state: section configured, armed retries survive restarts and resume where
they left off; see Durable State
in the wiki.
If the cron job is expected to fail sometimes, you may wish to report only in
the case the cron job ultimately fails after all retries and we give up on it.
For that situation, you can use the onPermanentFailure option:
- name: test-01
  command: |
    echo "hello" 1>&2
    sleep 1
    exit 10
  schedule:
    minute: "*/10"
  captureStderr: true
  onFailure:
    retry:
      maximumRetries: 10
      initialDelay: 1
      maximumDelay: 30
      backoffMultiplier: 2
  onPermanentFailure:
    report:
      mail:
        from: example@foo.com
        to: example@bar.com
        smtpHost: 127.0.0.1
Concurrency
Sometimes it may happen that a cron job takes so long to execute that when the moment its next scheduled execution is reached a previous instance may still be running. How cronstable handles this situation is controlled by the option concurrencyPolicy, which takes one of the following values:
Allow : allows concurrently running jobs (default)
Forbid : forbids concurrent runs, skipping next run if previous hasn't finished yet
Replace : cancels currently running job and replaces it with a new one
Execution timeout
If you have a cron job that may possibly hang sometimes, you can instruct cronstable
to terminate the process after N seconds if it's still running by then, via the
executionTimeout option. For example, the following cron job takes 2
seconds to complete, cronstable will terminate it after 1 second:
- name: test-03
  command: |
    echo "starting..."
    sleep 2
    echo "all done."
  schedule:
    minute: "*"
  captureStderr: true
  executionTimeout: 1  # in seconds
When terminating a job, it is always a good idea to give that job process some time to terminate properly. For example, it may have opened a file, and even if you tell it to shutdown, the process may need a few seconds to flush buffers and avoid losing data.
On the other hand, there are times when programs are buggy and simply get stuck,
refusing to terminate nicely no matter what. For this reason, cronstable always
checks if a process exited some time after being asked to do so. If it hasn't,
it tries to forcefully kill the process. The option killTimeout option
indicates how many seconds to wait for the process to gracefully terminate
before killing it more forcefully. In Unix systems, we first send a SIGTERM,
but if the process doesn't exit after killTimeout seconds (30 by default)
then we send SIGKILL. For example, this cron job ignores SIGTERM, and so cronstable
will send it a SIGKILL after half a second:
- name: test-03
  command: |
    trap "echo '(ignoring SIGTERM)'" TERM
    echo "starting..."
    sleep 10
    echo "all done."
  schedule:
    minute: "*"
  captureStderr: true
  executionTimeout: 1
  killTimeout: 0.5
Change to another user/group
You can request that Cronstable change to another user and/or group for a specific
cron job. The field user indicates the user (uid or userame) under which
the subprocess must be executed. The field group (gid or group name)
indicates the group id. If only user is given, the group defaults to the
main group of that user. Example:
- name: test-03
  command: id
  schedule:
    minute: "*"
  captureStderr: true
  user: www-data
Naturally, cronstable must be running as root in order to have permissions to change to another user.
This feature is POSIX-only (it relies on setuid/setgid). On Windows, a job
with user or group set is rejected with a configuration error; see
Running on Windows.
Remote web/HTTP interface
If you wish to remotely control cronstable, you can optionally enable an HTTP REST interface, with the following configuration (example):
web:
  listen:
     - http://127.0.0.1:8080
     - unix:///tmp/cronstable.sock
Enabling the web dashboard
With the web interface enabled, cronstable also serves the web dashboard
(showcased near the top of this README) at the root path (/) of any http://
listener. Open http://127.0.0.1:8080/ in the example above, and see the
full dashboard tour in
the wiki. It is a single self-contained page (no build step or external assets)
that watches every job's status, tails its logs live, runs or cancels jobs on
demand, and shows run history and a plain-English schedule preview. Logs are
shown for the streams a job captures, so enable captureStdout /
captureStderr on jobs whose output you want to watch here.
The run history and logs are kept in memory only. Nothing is written to disk, so the dashboard does not change cronstable's read-only-filesystem deployment story. History resets when cronstable restarts.
If you have enabled bearer-token authentication for the web API (the
web.authToken option), the dashboard page itself loads without a token, then
prompts you for one and stores it only in that browser tab; every data request
it makes is authenticated with that token.
To disable the dashboard and expose only the REST API, set ui: false:
web:
  listen:
     - http://127.0.0.1:8080
  ui: false
Now you have the following options to control it (using HTTPie as example):
Get the version of cronstable
$ http get http://127.0.0.1:8080/version
HTTP/1.1 200 OK
Content-Length: 22
Content-Type: text/plain; charset=utf-8
Date: Sun, 03 Nov 2019 19:48:15 GMT
Server: Python/3.7 aiohttp/3.6.2

0.10.0b3.dev7+g45bc4ce
Get the status of cron jobs
$ http get http://127.0.0.1:8080/status
HTTP/1.1 200 OK
Content-Length: 104
Content-Type: text/plain; charset=utf-8
Date: Sun, 03 Nov 2019 19:44:45 GMT
Server: Python/3.7 aiohttp/3.6.2

test-01: scheduled (in 14 seconds)
test-02: scheduled (in 74 seconds)
test-03: scheduled (in 14 seconds)
You may also get status info in json format:
$ http get http://127.0.0.1:8080/status Accept:application/json
HTTP/1.1 200 OK
Content-Length: 206
Content-Type: application/json; charset=utf-8
Date: Sun, 03 Nov 2019 19:45:53 GMT
Server: Python/3.7 aiohttp/3.6.2

[
    {
        "job": "test-01",
        "scheduled_in": 6.16588,
        "status": "scheduled"
    },
    {
        "job": "test-02",
        "scheduled_in": 6.165787,
        "status": "scheduled"
    },
    {
        "job": "test-03",
        "scheduled_in": 6.165757,
        "status": "scheduled"
    }
]
Start a job right now
Sometimes it's useful to start a cron job right now, even if it's not scheduled to run yet, for example for testing:
$ http post http://127.0.0.1:8080/jobs/test-02/start
HTTP/1.1 200 OK
Content-Length: 0
Content-Type: application/octet-stream
Date: Sun, 03 Nov 2019 19:50:20 GMT
Server: Python/3.7 aiohttp/3.6.2
Cancel a running job
POST /jobs/{name}/cancel terminates any currently-running instances of a job
(the same graceful SIGTERM-then-SIGKILL sequence, honoring the job's
killTimeout, that cronstable uses elsewhere). A job cancelled this way is recorded
in its history with the outcome cancelled; unlike a failure it is not
reported and does not trigger retries. It returns 409 Conflict if the job
is not currently running, and 404 Not Found for an unknown job.
$ http post http://127.0.0.1:8080/jobs/test-03/cancel
HTTP/1.1 200 OK
Get detailed job info (used by the dashboard)
GET /jobs returns a JSON array describing every job: its schedule and
timezone, whether it is enabled/running, the time until its next scheduled run, a
summary of its most recent finished run (outcome, exit code, start/finish times
and duration), and a compact history of recent outcomes for the trend
sparkline. This is what the web dashboard polls.
$ http get http://127.0.0.1:8080/jobs
[
    {
        "name": "test-01",
        "enabled": true,
        "schedule": "*/5 * * * *",
        "command": "echo foobar",
        "captureStdout": true,
        "captureStderr": true,
        "utc": true,
        "timezone": "UTC",
        "running": false,
        "pids": [],
        "scheduled_in": 42.1,
        "last_run": {
            "outcome": "success",
            "exit_code": 0,
            "started_at": "2026-06-21T12:00:00+00:00",
            "finished_at": "2026-06-21T12:00:01+00:00",
            "duration": 1.02,
            "fail_reason": null
        },
        "history": [
            {"outcome": "success", "duration": 0.98},
            {"outcome": "failure", "duration": 1.21},
            {"outcome": "success", "duration": 1.02}
        ]
    }
]
Get a job's run history
GET /jobs/{name}/runs returns the job's retained run history (oldest first,
bounded and in memory only) together with aggregate statistics. Each run carries
the same fields as last_run above; stats summarizes them. The success_rate
is computed over runs that ran to completion (cancellations are excluded).
Returns 404 Not Found for an unknown job.
$ http get http://127.0.0.1:8080/jobs/test-01/runs
{
    "name": "test-01",
    "runs": [
        {
            "outcome": "success",
            "exit_code": 0,
            "started_at": "2026-06-21T12:00:00+00:00",
            "finished_at": "2026-06-21T12:00:01+00:00",
            "duration": 1.02,
            "fail_reason": null
        }
    ],
    "stats": {
        "total": 1,
        "success": 1,
        "failure": 0,
        "cancelled": 0,
        "success_rate": 1.0,
        "avg_duration": 1.02,
        "min_duration": 1.02,
        "max_duration": 1.02,
        "last_duration": 1.02
    }
}
Tail a job's logs
GET /jobs/{name}/logs is a
Server-Sent Events
stream of a job's captured output: the most recent buffered lines first, then
new lines live as a running job produces them, and finally an end event when
the run finishes. Each line arrives as an event: line whose data is a JSON
object {"stream": "stdout"|"stderr", "line": "..."}. Only output from the
streams a job captures (captureStdout / captureStderr) is available here.
$ curl -N http://127.0.0.1:8080/jobs/test-01/logs
event: line
data: {"stream": "stdout", "line": "foobar"}

event: end
data: {}
Job-set id
The job-set id is an order-independent fingerprint of the set of jobs a cronstable instance is running. Two instances produce the same id if and only if they hold the same set of jobs, which lets several replicas deployed from the same configuration confirm they are running the same thing, or detect that one has drifted from the others.
The id is taken over the effective (post-merge) configuration of every job, which gives it some useful properties:
- it is independent of job order, and of whether a setting was written
inline on each job or hoisted into a
defaultsblock; - equivalent schedule spellings match: the
minute:/hour:object form fingerprints the same as the equivalent five-field crontab string; - it covers every behavior-affecting field (command, schedule, shell, the
names of
environmentvariables, capture flags,failsWhen, retry/reporting policy, timezone,enabled, and so on), so any meaningful change to a job changes the id; user/groupare fingerprinted as configured (e.g.www-data), not as the resolved numeric uid/gid, which can differ host to host;- secret/value material is never embedded: inline reporting secrets
(Sentry DSN, mail password, webhook URL and header values) are redacted,
and only the names of
environmentvariables are hashed, not their values (env commonly holds secrets, and a per-host value, e.g. fromenv_file, would otherwise make identical configs differ across hosts). The id is safe to log and serve, and rotating a secret or changing an env value does not change it.
Because it reflects effective config, it also reflects platform-dependent
defaults (the default shell is /bin/sh on POSIX, cmd.exe on Windows), so
compare instances running on the same platform, which replicas are. The scheme
is versioned with a v1: prefix; ids are only comparable within a scheme
version.
It is available three ways:
-
CLI: print it and exit (handy in scripts / health checks):
$ cronstable -c /etc/cronstable.d --job-set-id
v1:b834d7565aee0da50cd017f666651a5ba3b2e6b161daf0cb6e430f23f51ce90b
-
HTTP:
GET /job-set-idon the web interface (alsoapplication/json), and shown in the dashboard header:$ http get http://127.0.0.1:8080/job-set-id v1:b834d7565aee0da50cd017f666651a5ba3b2e6b161daf0cb6e430f23f51ce90b $ http get http://127.0.0.1:8080/job-set-id Accept:application/json {"job_set_id": "v1:b834d7…51ce90b", "jobs": 3}
-
Logs: it is logged once at startup, and again whenever a config reload changes it.
Clustering and leader election
By default cronstable runs as a single instance and every replica runs every job.
An optional cluster section lets several replicas coordinate: each node serves
a small GET /peer endpoint over mutual TLS and periodically polls its
configured peers, comparing job-set ids so they can confirm they
are running the same set of jobs (cluster peer attestation). Turning on
electLeader promotes that same attestation into a quorum-gated leader
election, so you can run more than one replica from one config without
double-running scheduled jobs:
cluster:
  listen: "0.0.0.0:8443"          # the mTLS listener for this node
  tls:
    ca:   /etc/cronstable/cluster-ca.pem   # trust anchor for peer certificates
    cert: /etc/cronstable/this-node.pem    # this node's certificate
    key:  /etc/cronstable/this-node.key
  peers:
    - host: cronstable-b.internal:8443
    - host: cronstable-c.internal:8443
  nodeName: cronstable-a              # optional; defaults to the system hostname
  interval: 30                    # optional; seconds per round (default 30)
  connectTimeout: 10              # optional; per-peer connect timeout (default 10)
  driftAfter: 3                   # optional; rounds before "drifted" (default 3)
  electLeader: true               # observe-only if false (the default)
Each node independently elects, as leader, the lowest nodeName among the
members it currently sees agreeing on the job-set id, but only if that set is a
quorum (a strict majority) of the cluster, so under a clean partition at
most one side leads. This is best-effort (the default gossip backend keeps no
shared state); for a fenced, exactly-once guarantee set
cluster.backend: kubernetes or cluster.backend: etcd
to elect through a coordination.k8s.io/v1 Lease or a lease-bound etcd key
instead.
Each job can override the cluster-wide default with a per-job clusterPolicy,
picking its own point on the liveness-vs-duplication trade-off:
clusterPolicy |
healthy (quorate) | partitioned / sub-quorum | use for |
|---|---|---|---|
Leader (default) |
leader runs once | nobody runs (skips) | non-idempotent jobs where a duplicate is harmful and an occasional skip is OK (billing, outbound email) |
PreferLeader |
lowest node runs once | each side's lowest node runs (may double-run) | important and idempotent jobs that should never skip |
EveryNode |
every node runs | every reachable node runs | genuinely per-node work (local log rotation), or fully idempotent jobs |
The current view (members, elected leader, quorum, and any conflicts) is
available at GET /cluster and shown as a panel in the dashboard. This is a
teaser: the full trust model, per-peer status table, quorum math, sizing
guidance, distribution: spread load-balancing, and the fenced lease backends
are all covered in depth in the
Clustering and Leader Election
guide in the wiki. To watch it live, see Try it below.
Includes
You may have a use case where it's convenient to have multiple config files, and choose at runtime which one to use. In that case, it might be useful if you can put common definitions (such as defaults for reporting, shell, etc.) in a separate file, that is included by the other files.
To support this use case, it is possible to ask one config file to include
another one, via the include directive. It takes a list of file names:
those files will be parsed as configuration and merged in with this file.
Example, your main config file could be:
include:
  - _inc.yaml

jobs:

  - name: my job
    ...
And your included _inc.yaml file could contain some useful defaults:
defaults:
  shell: /bin/bash
  onPermanentFailure:
    report:
      sentry:
        ...
Custom logging
It's possible to provide a custom logging configuration, via the logging
configuration section. For example, the following configuration displays log lines with
an embedded timestamp for each message.
logging:
  # In the format of:
  # https://docs.python.org/3/library/logging.config.html#dictionary-schema-details
  version: 1
  disable_existing_loggers: false
  formatters:
    simple:
      format: '%(asctime)s [%(processName)s/%(threadName)s] %(levelname)s (%(name)s): %(message)s'
      datefmt: '%Y-%m-%d %H:%M:%S'
  handlers:
    console:
      class: logging.StreamHandler
      level: DEBUG
      formatter: simple
      stream: ext://sys.stdout
  root:
    level: INFO
    handlers:
      - console
Obscure configuration options
enabled: true|false (default true)
It is possible to disable a specific cron job by adding a enabled: false option. Jobs
with enabled: false will simply be skipped, as if they aren't there, apart from
validating the configuration.
jobs:
  - name: test-01
    enabled: false  # this cron job will not run until you change this to `true`
    command: echo "foobar"
    shell: /bin/bash
    schedule: "* * * * *"
Documentation map
The wiki:
- Run it: Installation · Production and Container Deployment · Running on Windows · Migration from yacron
- Configure it: Configuration Reference · Schedules and Timezones · Classic Crontabs · Includes and Defaults · Commands and Environment · Output Capturing · Logging
- Trust it: Failure Detection and Retries · Reporting · Concurrency and Timeouts · Troubleshooting
- Watch it: Web Dashboard · HTTP API · Metrics with Prometheus · Metrics with Statsd · CLI Reference
- Scale it: Durable State · Orchestration and DAGs · Clustering and Leader Election · Architecture and Internals
Contributing and license
Bug reports, feature ideas, and pull requests are welcome; see CONTRIBUTING.md for the development setup and Contributing and Releasing for how releases work. cronstable is MIT-licensed.
Project details
Verified details
These details have been verified by PyPIProject links
GitHub Statistics
Maintainers
Release history Release notifications | RSS feed

Download files
Download the file for your platform. If you're not sure which to choose, learn more about installing packages.
Source Distribution
Built Distribution
Filter files by name, interpreter, ABI, and platform.
If you're not sure about the file name format, learn more about wheel file names.
Copy a direct link to the current filters
File details
Details for the file cronstable-1.2.12.tar.gz.
File metadata
- Download URL: cronstable-1.2.12.tar.gz
- Upload date:
- Size: 31.7 MB
- Tags: Source
- Uploaded using Trusted Publishing? Yes
- Uploaded via: twine/6.1.0 CPython/3.13.13
File hashes
| Algorithm | Hash digest | |
|---|---|---|
| SHA256 |
3429b20f517c24b4a91ccec718481df1c27b78b52d36efd715873b793912ccd0
|
|
| MD5 |
65ce147d0734cc1378a38acf7f4e99d7
|
|
| BLAKE2b-256 |
e00a438bf95a5192c22627f5fdba9da2f2c745959d00f0c088a6e2d4a3651d64
|
Provenance
The following attestation bundles were made for cronstable-1.2.12.tar.gz:
Publisher:
release.yml on ptweezy/cronstable
-
Statement:
-
Statement type:
https://in-toto.io/Statement/v1 -
Predicate type:
https://docs.pypi.org/attestations/publish/v1 -
Subject name:
cronstable-1.2.12.tar.gz -
Subject digest:
3429b20f517c24b4a91ccec718481df1c27b78b52d36efd715873b793912ccd0 - Sigstore transparency entry: 2112653484
- Sigstore integration time:
-
Permalink:
ptweezy/cronstable@c9a0375ac216d03116cc81cc491913ce544cee0f -
Branch / Tag:
refs/heads/main - Owner: https://github.com/ptweezy
-
Access:
public
-
Token Issuer:
https://token.actions.githubusercontent.com -
Runner Environment:
github-hosted -
Publication workflow:
release.yml@c9a0375ac216d03116cc81cc491913ce544cee0f -
Trigger Event:
push
-
Statement type:
File details
Details for the file cronstable-1.2.12-py3-none-any.whl.
File metadata
- Download URL: cronstable-1.2.12-py3-none-any.whl
- Upload date:
- Size: 567.2 kB
- Tags: Python 3
- Uploaded using Trusted Publishing? Yes
- Uploaded via: twine/6.1.0 CPython/3.13.13
File hashes
| Algorithm | Hash digest | |
|---|---|---|
| SHA256 |
8ea4970fa40277de7ed17386fec32d0a7c0b2d3c44037a217dcebd559802ad84
|
|
| MD5 |
8be0bd621d4c4bf0ed2bd8f9ff5c9780
|
|
| BLAKE2b-256 |
2ee8d2eaeb01077eb9ecc676190b47d76c78c71d1a522ed2bdcd84e5d1405fda
|
Provenance
The following attestation bundles were made for cronstable-1.2.12-py3-none-any.whl:
Publisher:
release.yml on ptweezy/cronstable
-
Statement:
-
Statement type:
https://in-toto.io/Statement/v1 -
Predicate type:
https://docs.pypi.org/attestations/publish/v1 -
Subject name:
cronstable-1.2.12-py3-none-any.whl -
Subject digest:
8ea4970fa40277de7ed17386fec32d0a7c0b2d3c44037a217dcebd559802ad84 - Sigstore transparency entry: 2112653521
- Sigstore integration time:
-
Permalink:
ptweezy/cronstable@c9a0375ac216d03116cc81cc491913ce544cee0f -
Branch / Tag:
refs/heads/main - Owner: https://github.com/ptweezy
-
Access:
public
-
Token Issuer:
https://token.actions.githubusercontent.com -
Runner Environment:
github-hosted -
Publication workflow:
release.yml@c9a0375ac216d03116cc81cc491913ce544cee0f -
Trigger Event:
push
-
Statement type:






