GUI for the scipy.optimize.curve_fit() function

Project description
A GUI for scipy's curve_fit() function
curvefitgui is a graphical interface to the non-linear curvefit function scipy.optimise.curve_fit API reference of the scipy.optimize package. Currently, only the Levenberg-Marquard optimizer is supported. The GUI is based on PyQt5.
Installation
You can install the curvefitgui form PyPi:
pip install curvefitgui
The GUI is supported on Python 3.7 and above.
Note: only curvefitgui is installed without any required dependencies. Depending on if you are using pip or conda to manage your environment you should manually install the following additional packages:
-
Using
pip:pip install numpy scipy matplotlib PyQt5 -
Using
conda:conda install numpy scipy matplotlib qtpy pyqt
Basic usage
A minimum example to use curvefitgui.curve_fit_gui is:
from curvefitgui import curve_fit_gui
import numpy as np

# define a function for fitting
def f(x, a, b):
    '''
    Linear fit
    function: y = ax + b
    a: slope
    b: intercept
    '''
    return a * x + b

# define x and y data as 1 dimensional numpy arrays of equal length
xdata = np.array([1, 2, 3, 4, 5])
ydata = np.array([-3.5, -2.4, -1, 0.5, 1.8])

# execute the function
curve_fit_gui(f, xdata, ydata)
Arguments
popt, pcov = curve_fit_gui(f, xdata, ydata, xerr=None, yerr=None, p0=None,
                           xlabel='x-axis', ylabel='y-axis', absolute_sigma=False,
                           jac=None, showgui=True, **kwargs)
curve_fit_gui accepts the following arguments:
f: callable function that defines the fitfunction. The first argument offshould be the independent variable; other arguments (at least one) are considered to be the fitparameters.xdata: 1-D numpy array x-coordinates of the dataydata: 1-D numpy array y-coordinates of the data
curve_fit_gui accepts the following keyword
arguments:
yerr: 1-D numpy array, optional (default:None) error/uncertainty in y-values used for weighted fit with a relative weight defined as 1/yerr**2
(for compatibility also the use of the keyword sigma can be used for the same)xerr: 1-D numpy array, optional (default:None) error in x-values. For plotting errorbars only and ignored during fittingxlabel: string, optional (default:'x-values') x-axis title in the plotylabel: string, optional (default:'y-values') y-axis title in the plotp0: array-like, optional initial values for fit parameters, if not specified 1 is used for each parametershowgui: boolean, optional (default=True) if True, the gui is shown, otherwise notabsolute_sigma: boolean, optional see doc-string scipy.optimize.curve_fit()jac: callable, optional see doc-string scipy.optimize.curve_fit()kwargs: keyword arguments for compatibility (e.g. you can use sigma to specify the error in y)
Returns
popt: The values of the fitparameters that minimised the squared residuals if a succesful fit was performed, else None.pcov: The estimated covariance of popt. (see also: scipy.optimise.curve_fit API reference)
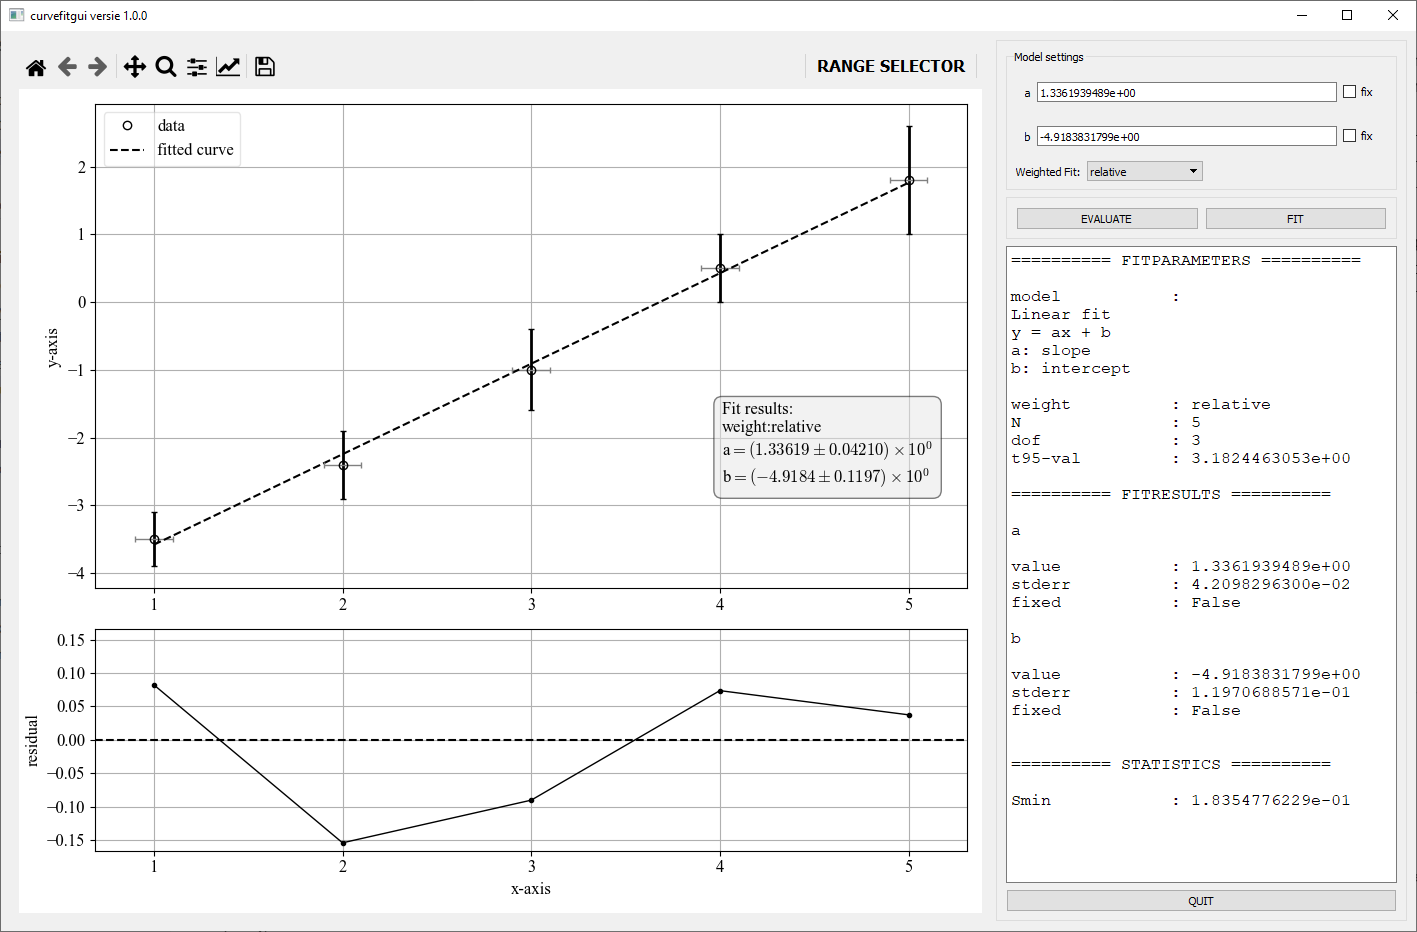
GUI interface
Once the gui is executed the following window is visible. An explanation of the different controls is described below the figure.
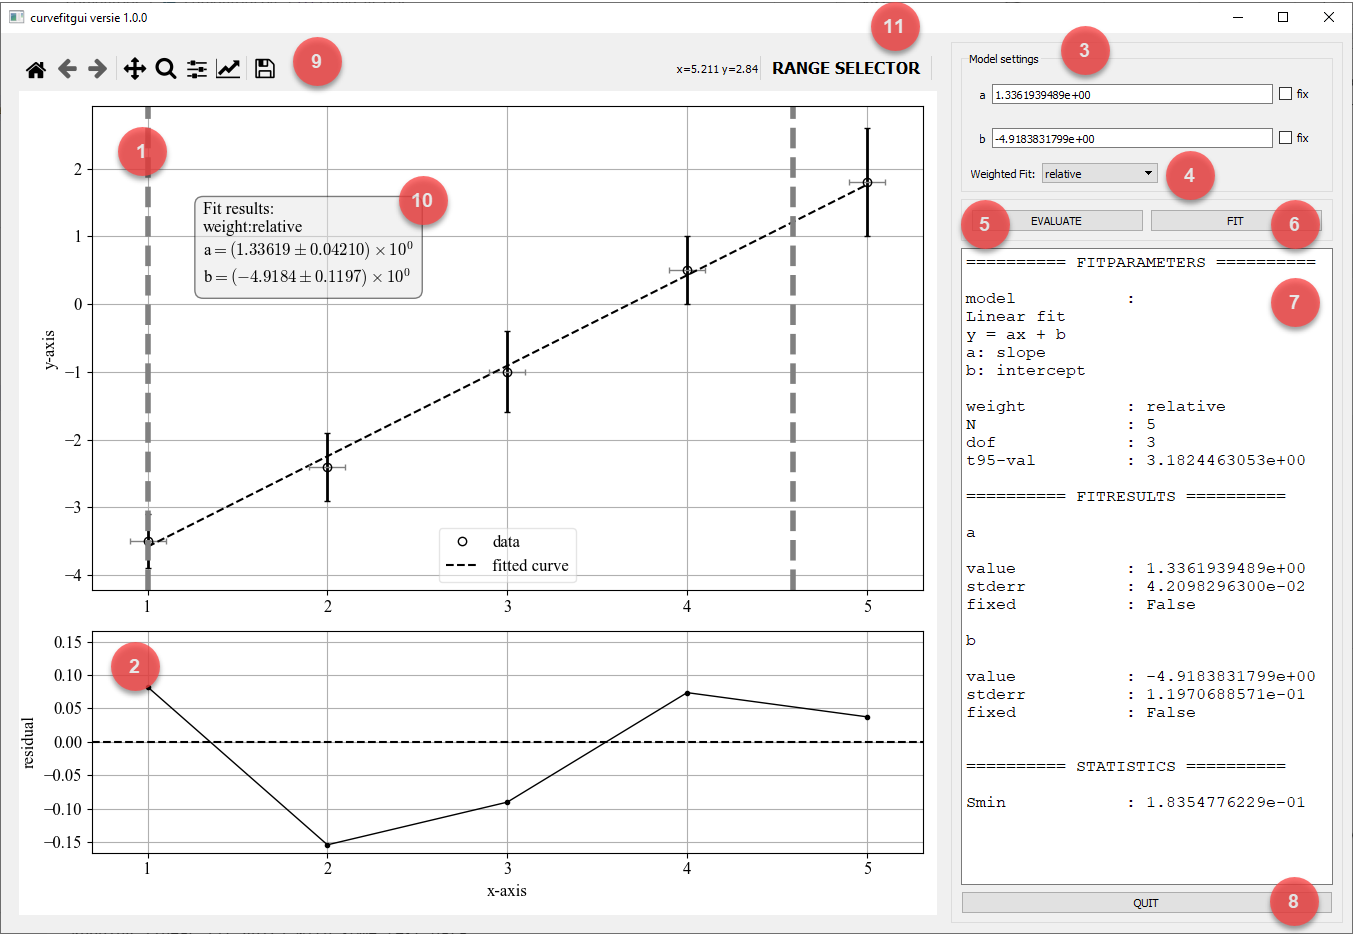
GUI controls
- Data plot: A matplotlib plot that shows the data as solid dots and both y-error and x-error errorbars if provided. A fitted curve as a dashed line is shown if a fit is performed.
- Residual plot A matplotlib plot that shows the residuals as the difference between the measured and fitted values:
residual = ydata - f(xdata, *fitparameters) - Model settings: Here you can enter inital values for the fitparameters. By ticking the chcekbox
fixyou can set a parameter to fixed:e.g. the parameter is not optmised during the fit. - Weight settings: If error data on the y-values are passed using the keyword argument
yerryou can use the dropdownbox to set how the error data is treated:- None: the error data is ignored
- Relative: Use the error data for a relative weight. Corresponds to setting scipy's curve_fit() function keyword
absolute_sigma = False. - Standard deviation: Treat the error data as being standard deviations. Corresponds to setting scipy's curve_fit() function keyword
absolute_sigma = True.
- Evaluate: Use this button to compute the model function given the current values of the parameters (set in the model settings panel)
- Fit: Performs the fit and updates the parameter values.
- Report: When a fit is performed, the results are shown here. The information on the model is actually the provided docstring of the function
fthat is passed to thecurvefitguifunction. - Quit: Quits the gui and returns the fitparameters
poptandpcov. - Toolbar: This is the standard matplotlib toolbar to adjust some plot properties and provides zoom/pan and save options.
- FitTextbox: This textbox is generated if a valid fit is performed. It can be moved by the mouse to any convenient positions in the plot.
- Range Selector Activates/deactivates the range-selector. The range-selector allows to select a datarange used for fitting. Only datapoints that are within the two vertical dashed lines are considered during fitting. The lines can be moved using the mouse.


Download files
Download the file for your platform. If you're not sure which to choose, learn more about installing packages.
Source Distribution
Built Distribution
Filter files by name, interpreter, ABI, and platform.
If you're not sure about the file name format, learn more about wheel file names.
Copy a direct link to the current filters
File details
Details for the file curvefitgui-1.1.11.tar.gz.
File metadata
- Download URL: curvefitgui-1.1.11.tar.gz
- Upload date:
- Size: 19.9 kB
- Tags: Source
- Uploaded using Trusted Publishing? No
- Uploaded via: twine/6.2.0 CPython/3.11.5
File hashes
| Algorithm | Hash digest | |
|---|---|---|
| SHA256 |
153973fb3a17858b79cf1c28db23491308e5945fb4e7c73711a207cee34ed62d
|
|
| MD5 |
ac107e0e3633506d824c46ab920a9923
|
|
| BLAKE2b-256 |
f60d86f3013b1f4d10fd89f344fd11047805c98953da3d383fa107b5ce25eeab
|
File details
Details for the file curvefitgui-1.1.11-py3-none-any.whl.
File metadata
- Download URL: curvefitgui-1.1.11-py3-none-any.whl
- Upload date:
- Size: 18.6 kB
- Tags: Python 3
- Uploaded using Trusted Publishing? No
- Uploaded via: twine/6.2.0 CPython/3.11.5
File hashes
| Algorithm | Hash digest | |
|---|---|---|
| SHA256 |
bcbf2712d98e845e0541964963f5e57c0e55f6a458ce1c4f5adf22b2a23e9248
|
|
| MD5 |
b09b01139024305a19c2a99f971dc95a
|
|
| BLAKE2b-256 |
932afb463098dbea1fd63c2b60c02a0e9557e1e0ecb930b3a76ec19964cfd85f
|


