Cluster significance analysis in scRNA-seq

Project description
Cytocipher - detection of significantly different cell populations in scRNA-seq
For a complete tutorial that installs cytocipher & reproduces the pancreas development analysis, please see here.
Installation
!pip install cytocipher
import cytocipher as cc
Expected Input
An AnnData object, data, that has been processed similarly to the scanpy standard workflow to produce log-cpm normalised data with tentative cluster labels (e.g. from Leiden clustering). It's better if the Leiden resolution is high, so that there is alot of over-clustering. Cytocipher merges the non-significantly different clusters.
Code Scoring Minimal Example
Functions below run the marker gene identification, code scoring, & subsequent visualisation of the resulting cell by cluster enrichment scores.
cc.tl.get_markers(data, 'leiden')
cc.tl.code_enrich(data, 'leiden')
cc.pl.enrich_heatmap(data, 'leiden')
In a jupyter notebook, you can see documentation using, for example:
?cc.tl.get_markers
Cluster Merging Minimal Example
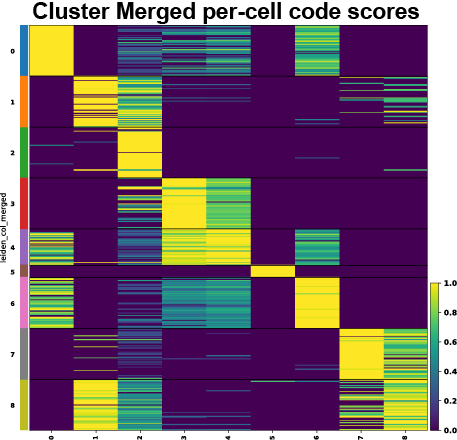
Below runs the cluster merging and visualises the heatmap of enrichment scores per cell for each of the new merged clusters.
cc.tl.merge_clusters(data, 'leiden')
cc.pl.enrich_heatmap(data, 'leiden_merged')
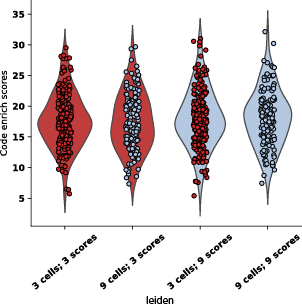
To visualise the scores being compared for a given pair of clusters, the following visualises the scores as violin plots of the enrichment scores & prints the p-values determined by comparing the scores:
cc.pl.sig_cluster_diagnostics(data, 'leiden', plot_pair=('3', '9'))
p=0.9132771265170103 (3 cells; 3 scores) vs (9 cells; 3 scores)
p=0.8128313109661132 (3 cells; 9 scores) vs (9 cells; 9 scores)
To get an sense of the upper- and lower- bounds for what is considered a significant cluster, default parameters plot the violins illustrated above for the upper- and lower- bounds of significant versus non-significant cluster pairs:
cc.pl.sig_cluster_diagnostics(data, 'leiden')
See the pancreas tutorial for more example Cytocipher functionality, including; visual bias checks, Sankey diagrams to visualise cluster merging, volcano plots, and more!
Issues
Please feel free to post an issue on the github if there is a problem, & I'll help you out ASAP.
Release history Release notifications | RSS feed


Download files
Download the file for your platform. If you're not sure which to choose, learn more about installing packages.
Source Distribution
File details
Details for the file cytocipher-0.1.20.tar.gz.
File metadata
- Download URL: cytocipher-0.1.20.tar.gz
- Upload date:
- Size: 738.2 kB
- Tags: Source
- Uploaded using Trusted Publishing? No
- Uploaded via: twine/4.0.2 CPython/3.8.12
File hashes
| Algorithm | Hash digest | |
|---|---|---|
| SHA256 |
ba59e45de39f6104271195a3ced3e61d9c4c3cffc8c81b5facddea1039a90915
|
|
| MD5 |
c20a057b04fb9c78b0568ac48cd4a642
|
|
| BLAKE2b-256 |
a865171cc9a77cc9057df6c8307f1dad0ffd1df5f97122bc57c2f85a5a13748e
|


