




A minimal Python package that produces slice plots through h5m DAGMC geometry files
Installation
pip install dagmc_geometry_slice_plotter
Graphical User Interface Usage
Once installed you will be able to launch a browser based GUI from the terminal with the command ...
dagmc_geometry_slice_plotter
Python API Usage
These examples assume you have a h5m file called dagmc.h5m in the same
folder that the Python script is being run from.
The plot_axis_slice method allows simple axis aligned plots to be made
with minimal user effort.
Create a plot of a slice through the geometry perpendicular to the Z axis and
default settings elsewhere. This will slice through the the center of the
geometry as plane_origin has not been specified in this example.
from dagmc_geometry_slice_plotter import plot_axis_slice

plot = plot_axis_slice(
    dagmc_file_or_trimesh_object='dagmc.h5m',
    view_direction='z',
)

plot.show()
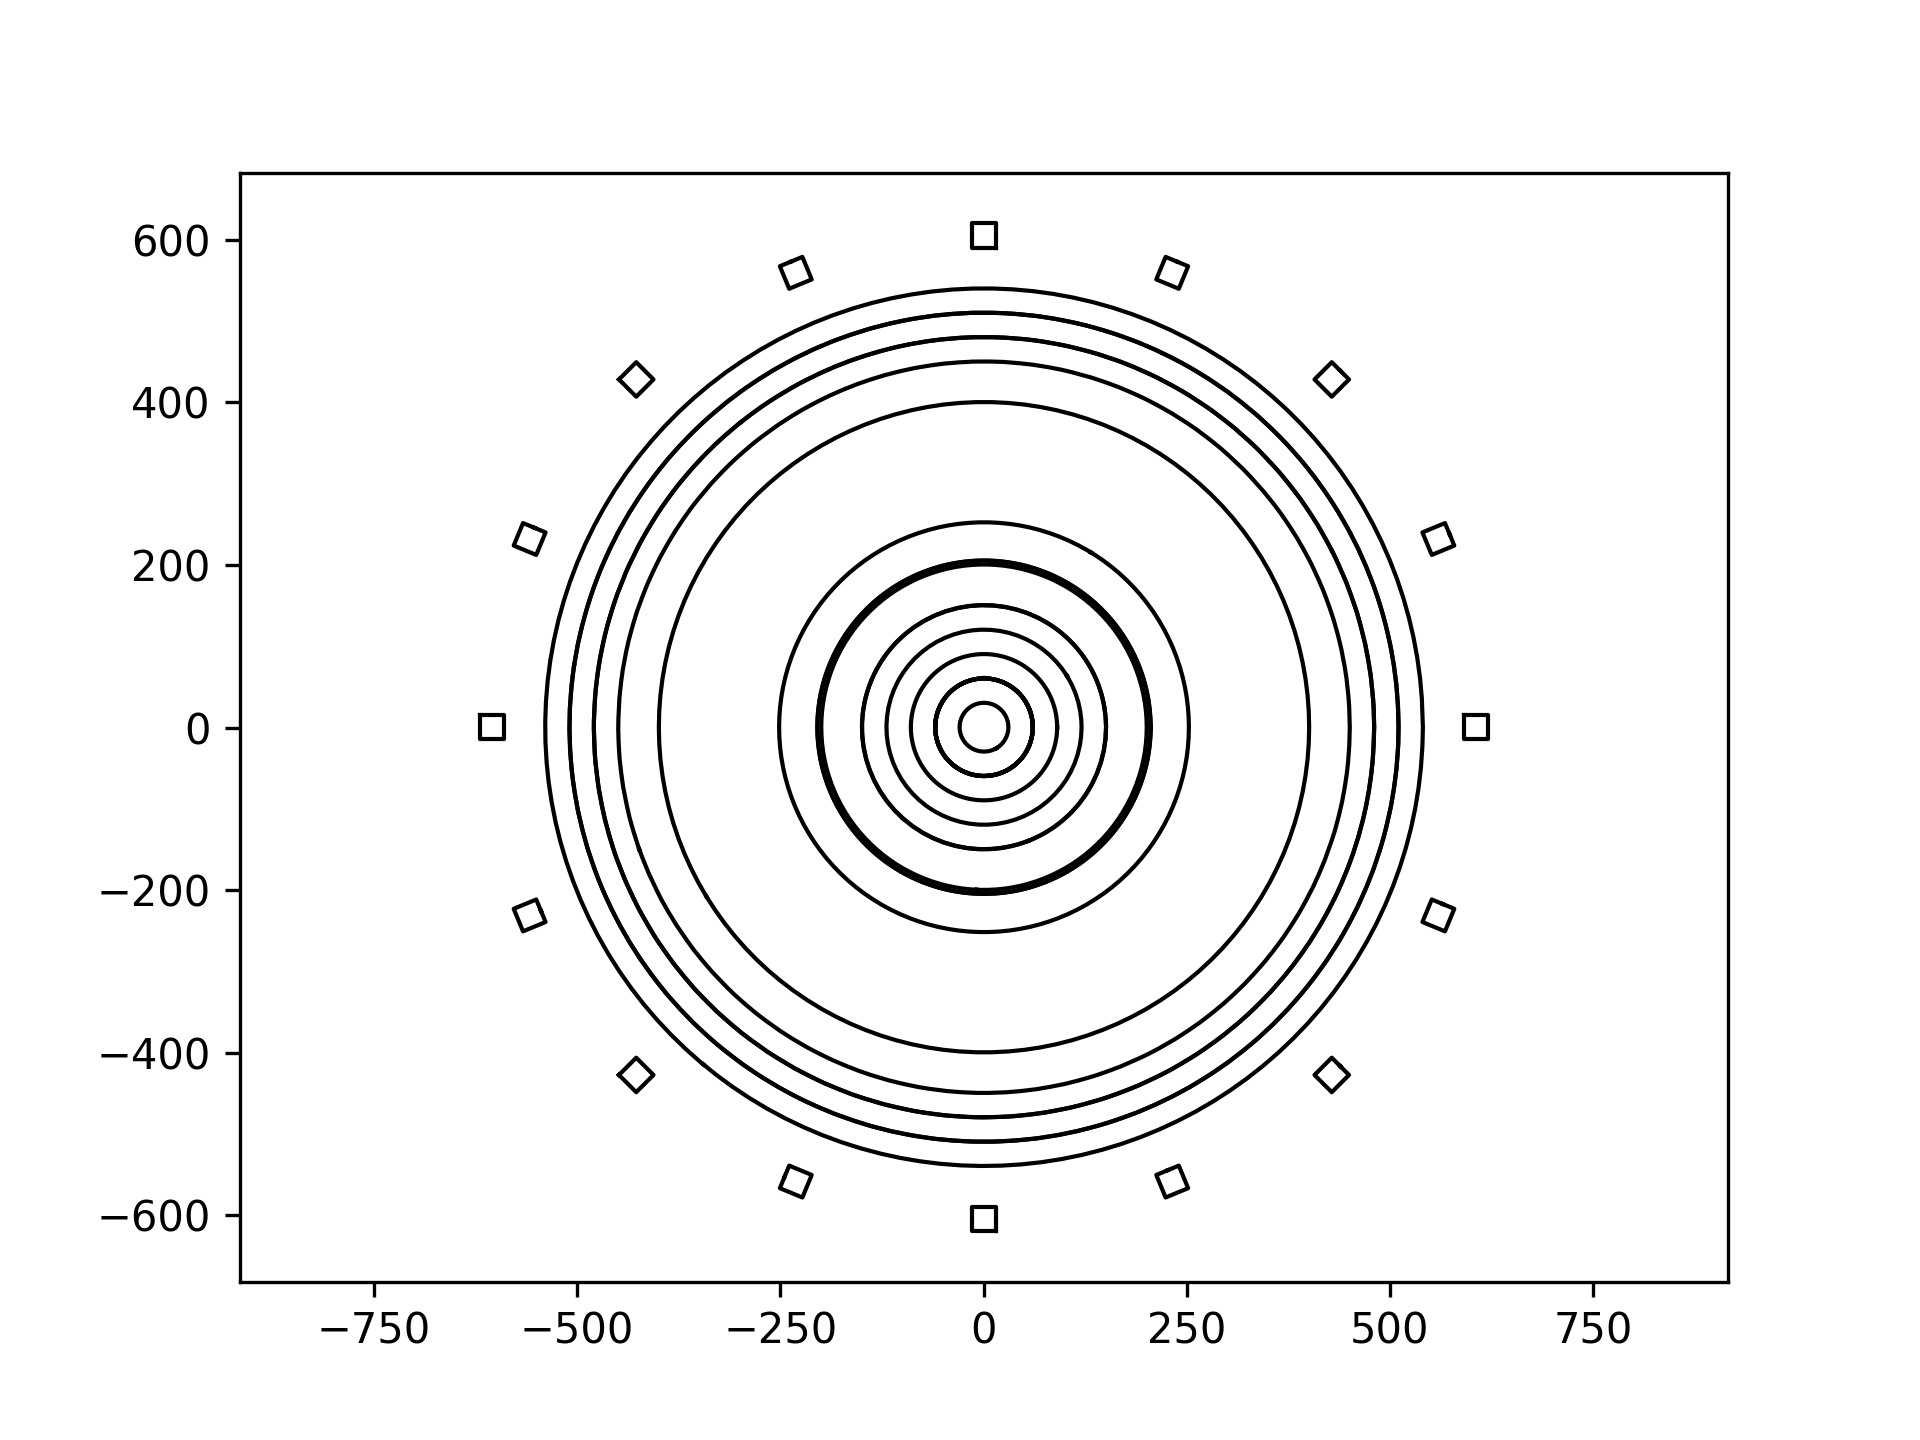
Create a plot of a slice through the geometry perpendicular to the Z axis, offset by 200cm and with default settings elsewhere.
from dagmc_geometry_slice_plotter import plot_axis_slice

plot = plot_axis_slice(
    dagmc_file_or_trimesh_object='dagmc.h5m',
    plane_origin=[0, 0, 200],
    view_direction='z'
)

plot.show()
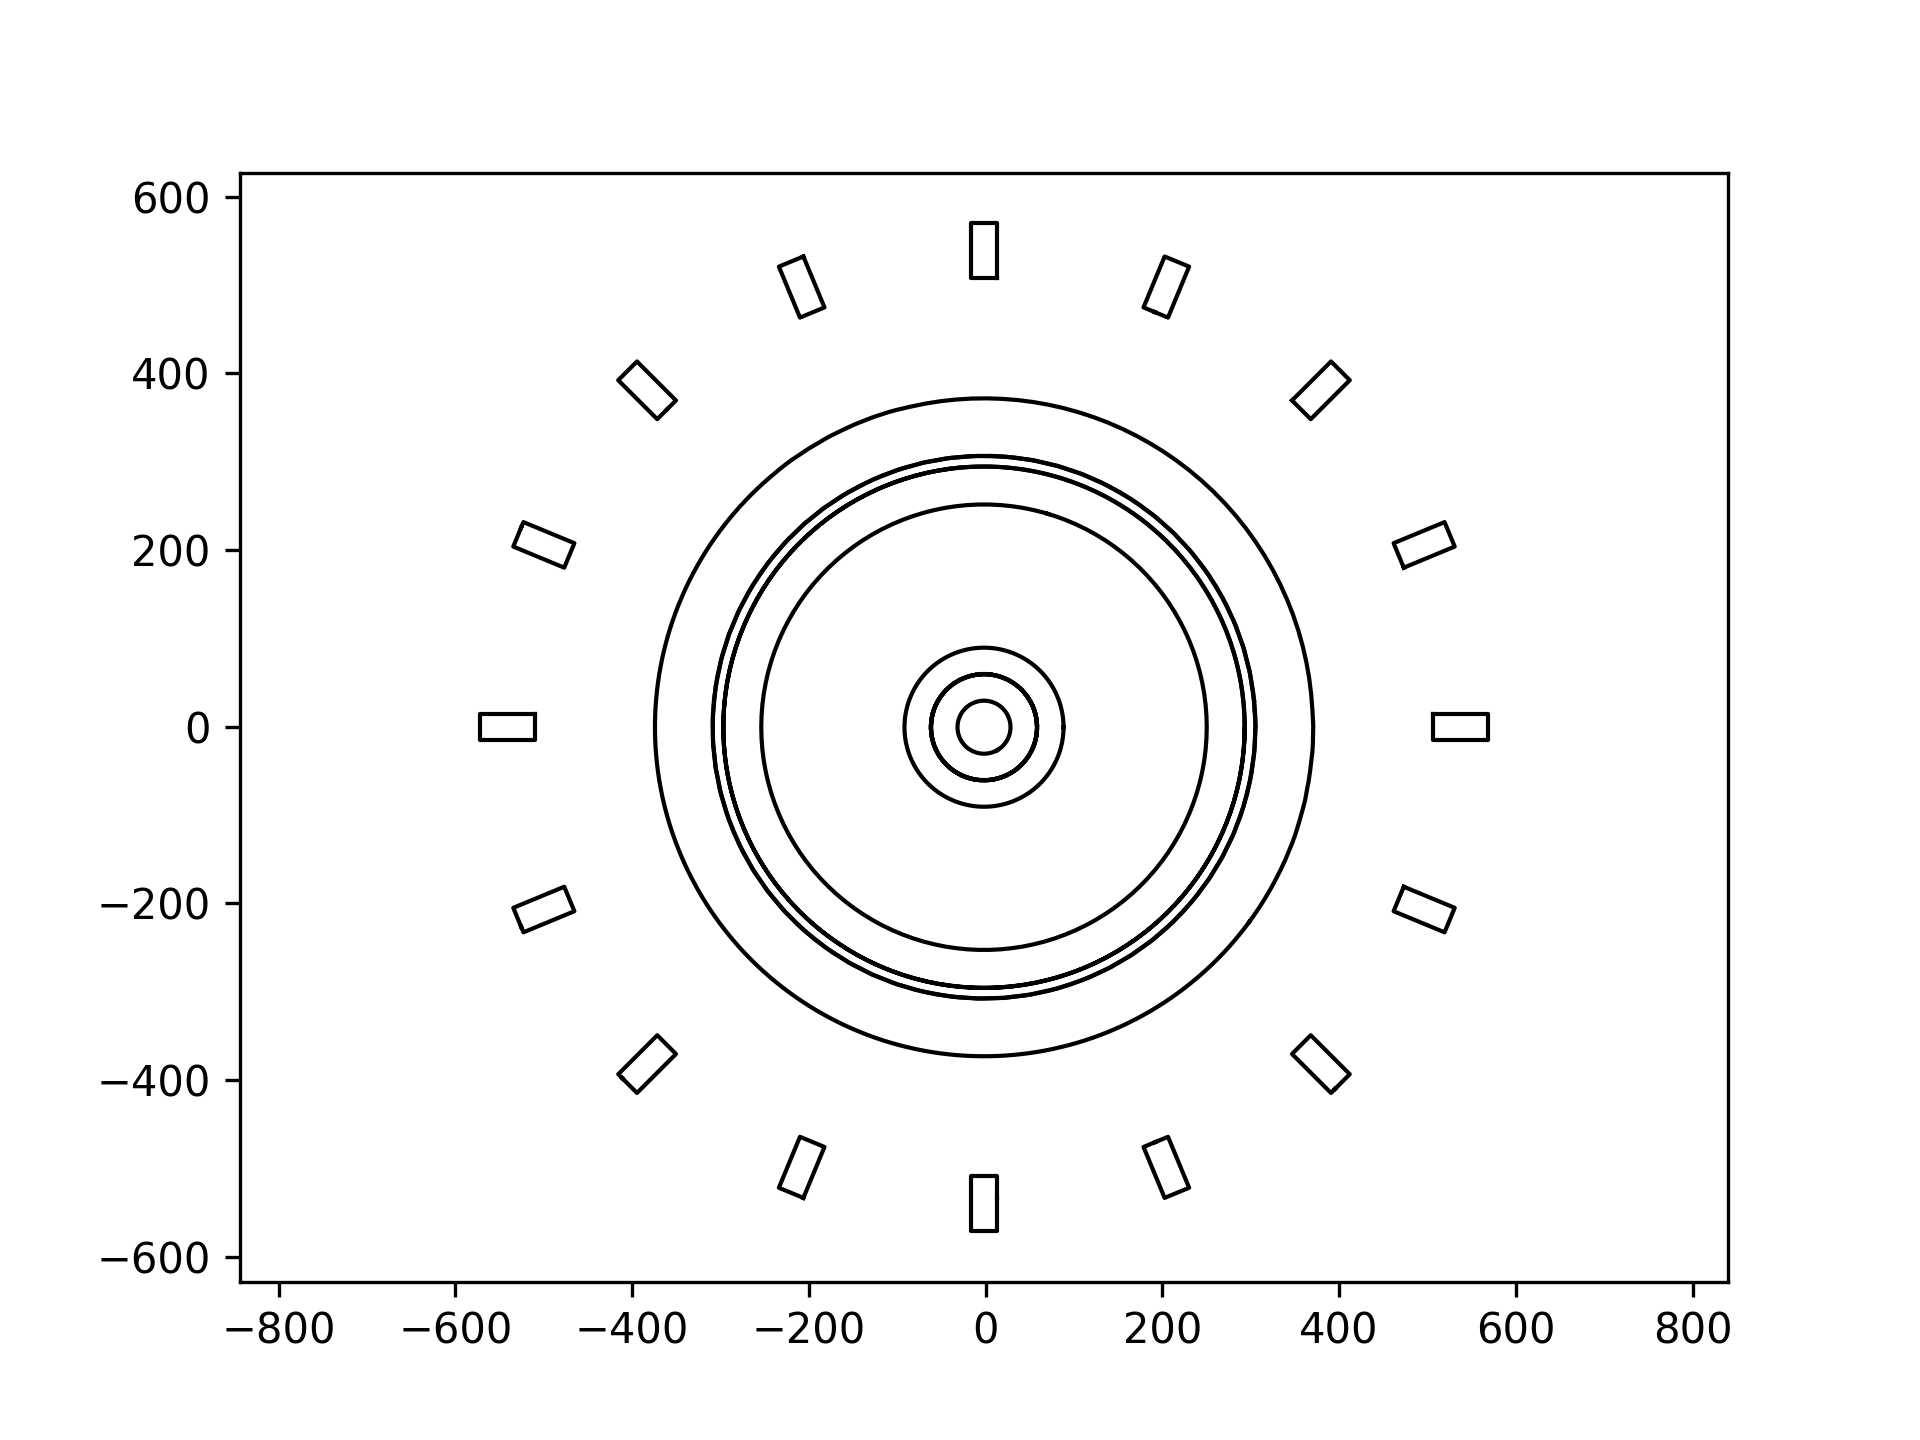
The plot_slice function allows more control over the plot as it allows
arbitrary plane normals so that off axis slices can be made and allows the plot
to be rotated.
Create a plot of a slice through the geometry perpendicular to the Y axis, with a rotation of 45 degrees and with default settings elsewhere. Also saves the plot with a high resolution (DPI)
from dagmc_geometry_slice_plotter import plot_slice

plot = plot_slice(
    dagmc_file_or_trimesh_object='dagmc.h5m',
    plane_normal=[0, 1, 0],
    rotate_plot=45,
)

plot.savefig('example_3_slice.png', dpi=600)
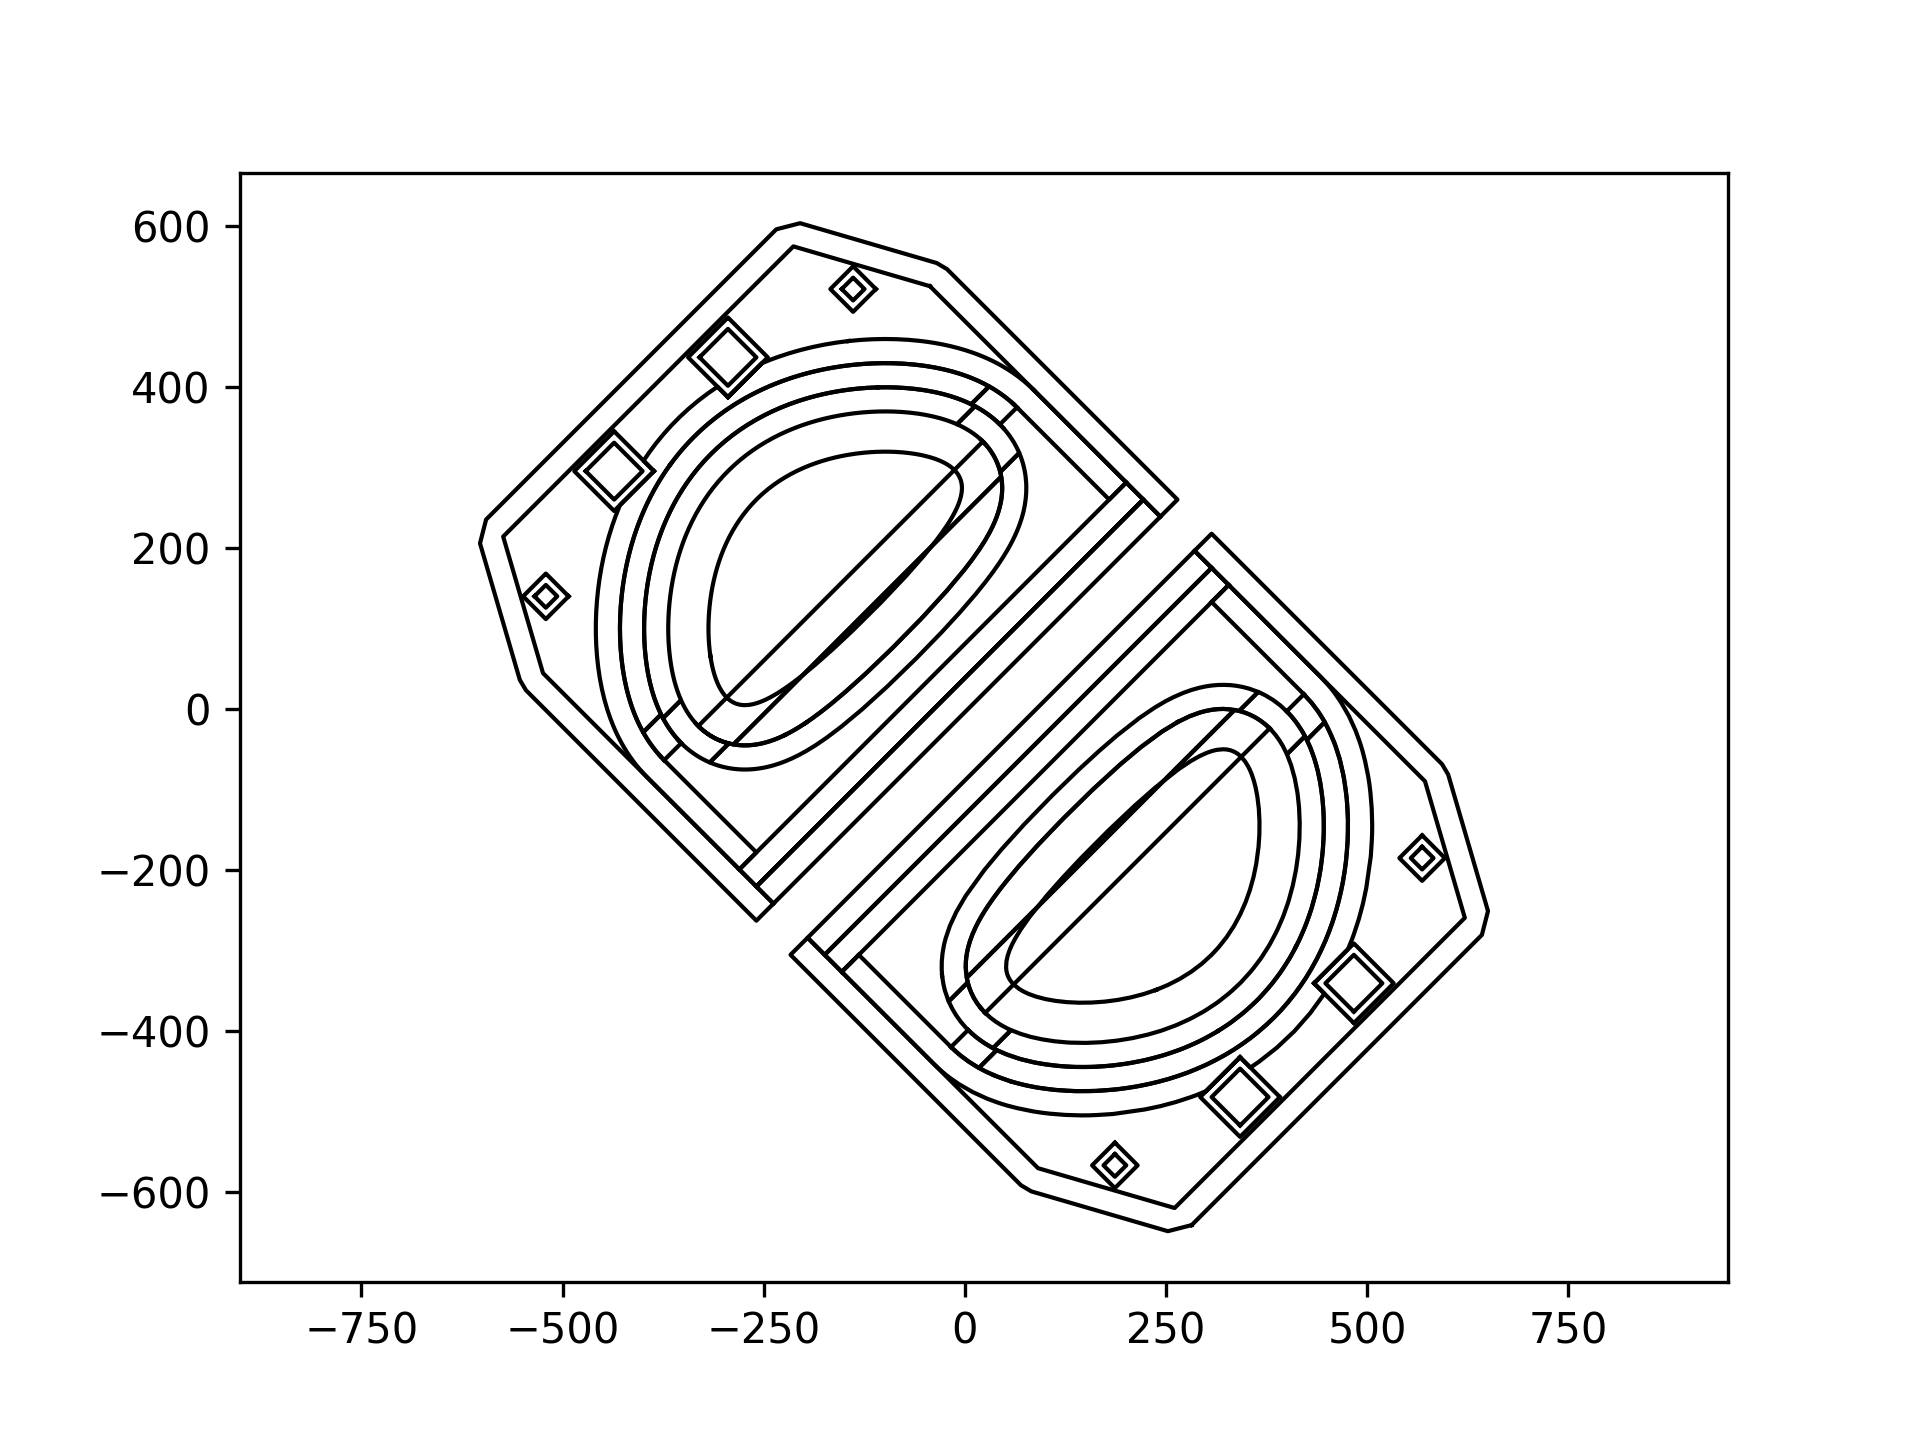
Saves a png image of a plot of a slice through the geometry perpendicular to the X axis and and with an offset in the x axis.
from dagmc_geometry_slice_plotter import plot_slice

plot = plot_slice(
    dagmc_file_or_trimesh_object='dagmc.h5m',
    plane_normal = [1, 0, 0],
    plane_origin=[10, 0, 0],
    rotate_plot=270,
)

plot.savefig('example_4_slice.png')
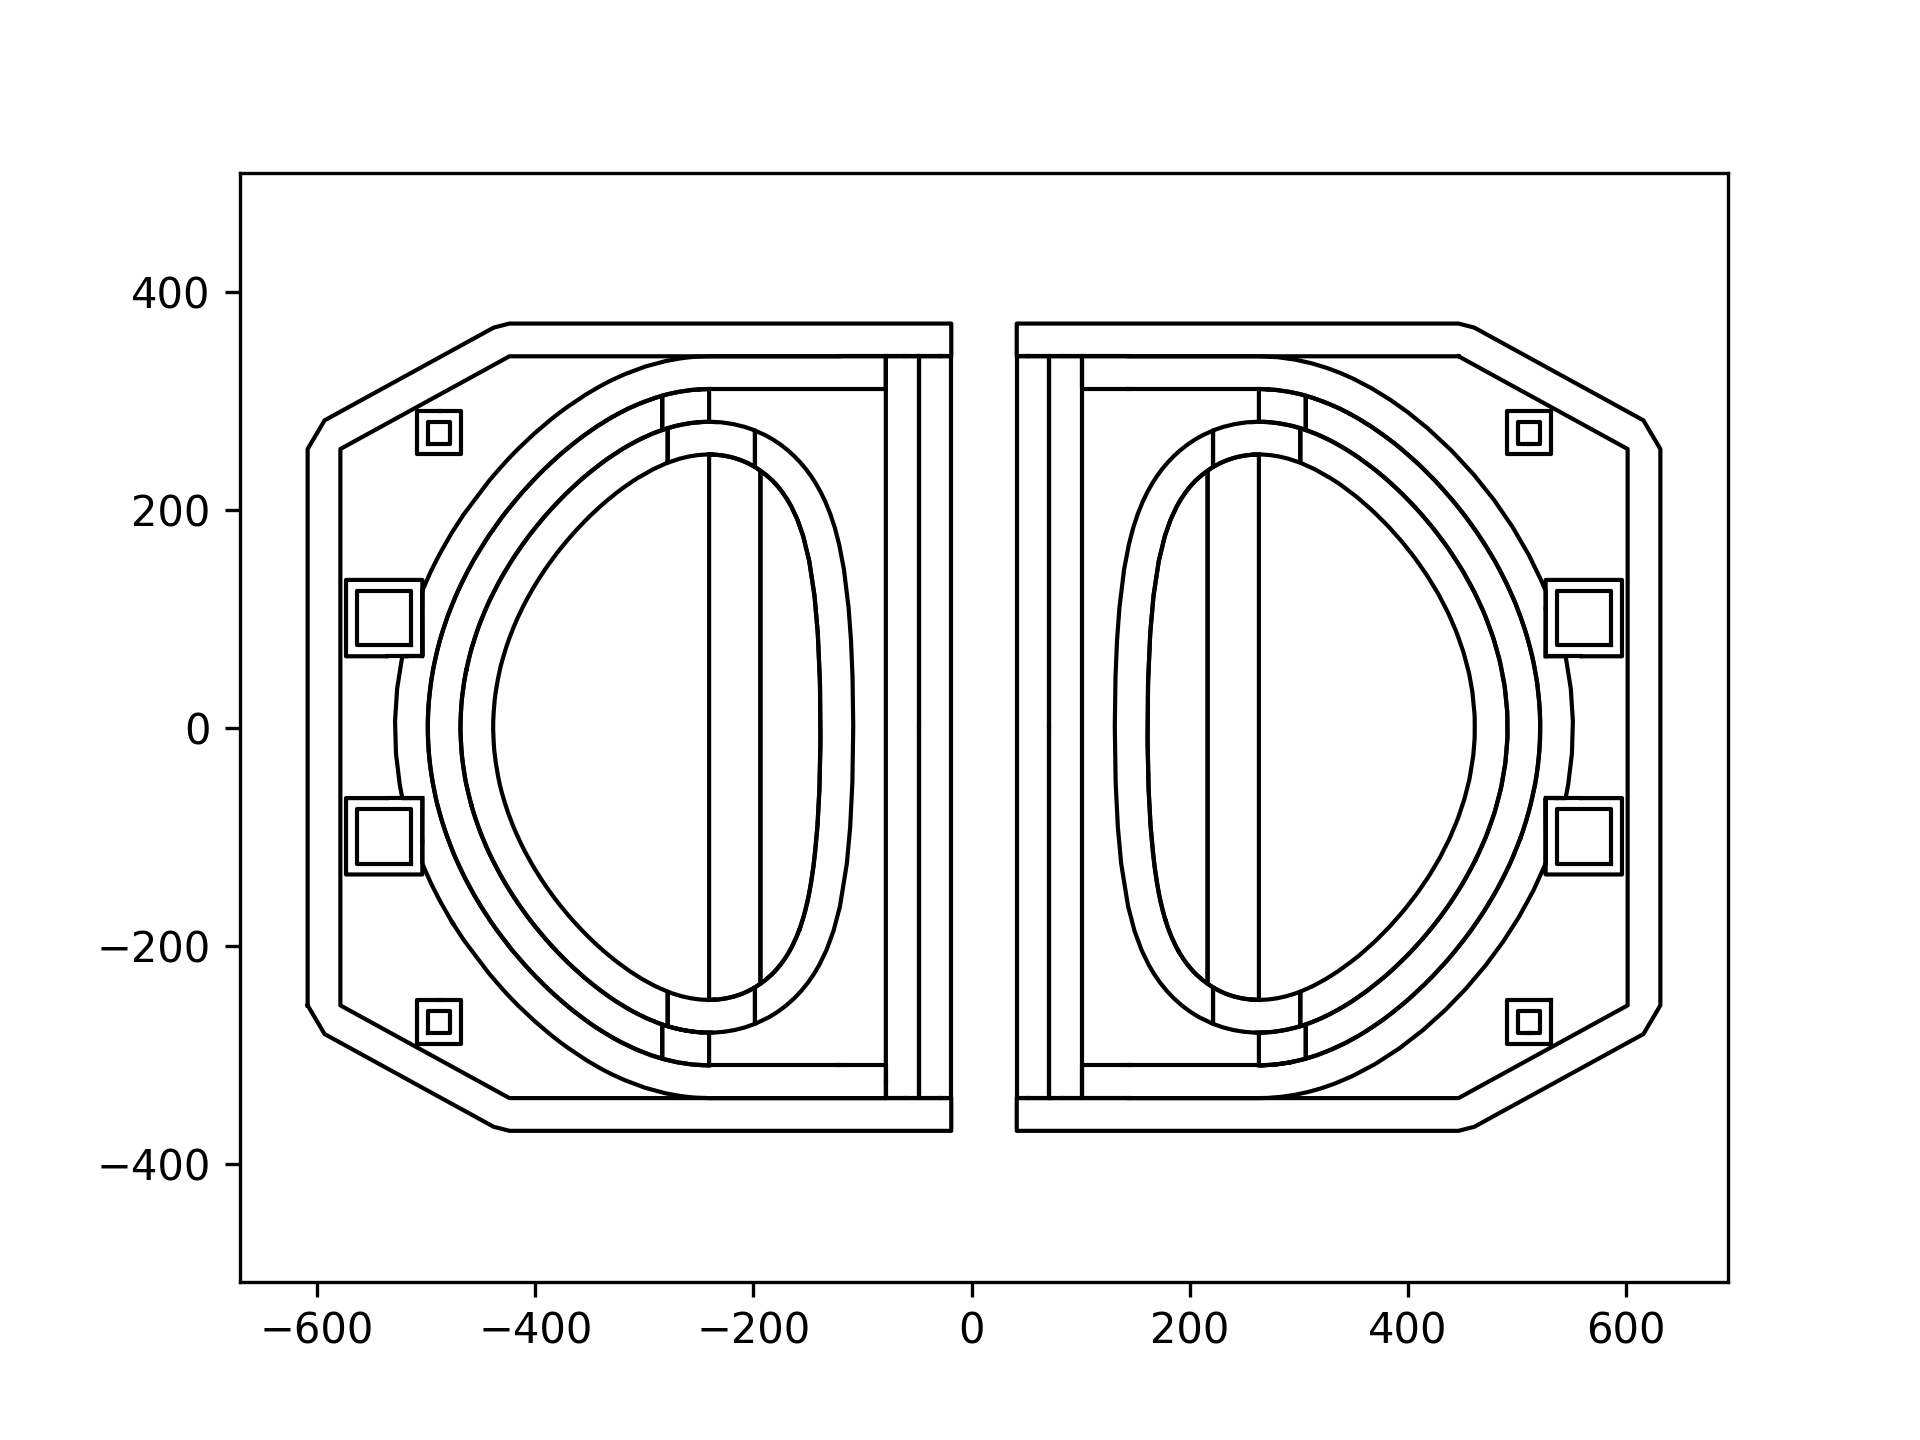
DAGMC files can also be made using packages like cad_to_dagmc or stl_to_h5m. This example uses CadQuery to make an STL file then converts the STL file to a DAGMC h5m file and plots a slice through the geometry
Custom plots
You can also use the package to access the the coordinates and lines that make up the outline and then plot these lines with your own MatplotLib script or other plotting package.
This example makes use of low level functionality in the package to extract the coordinates and lines then plot them in MatPlotLib. This offers users full customization of how the plots appear and also allows the plots to be combined with other types of plots such as
from dagmc_geometry_slice_plotter import get_slice_coordinates
import matplotlib.pyplot as plt

data = get_slice_coordinates(
    dagmc_file_or_trimesh_object="dagmc.h5m",
    plane_origin=[0, 0, 200],
    plane_normal=[0, 0, 1],
)

plt.axes().set_aspect("equal")  # scales the x y axis 1:1

for xy in data:
    plt.plot(*xy, color="black", linewidth=1)

plt.savefig("example_7_slice.png")
Related packages
-
This package is used by the openmc_plot Python package which has a web deployed version at xsplot.com
-
This package can also be used together with the openmc_geometry_plot Python package to combine outline slice plots of DAGMC geometry with colored areas for materials or cells
-
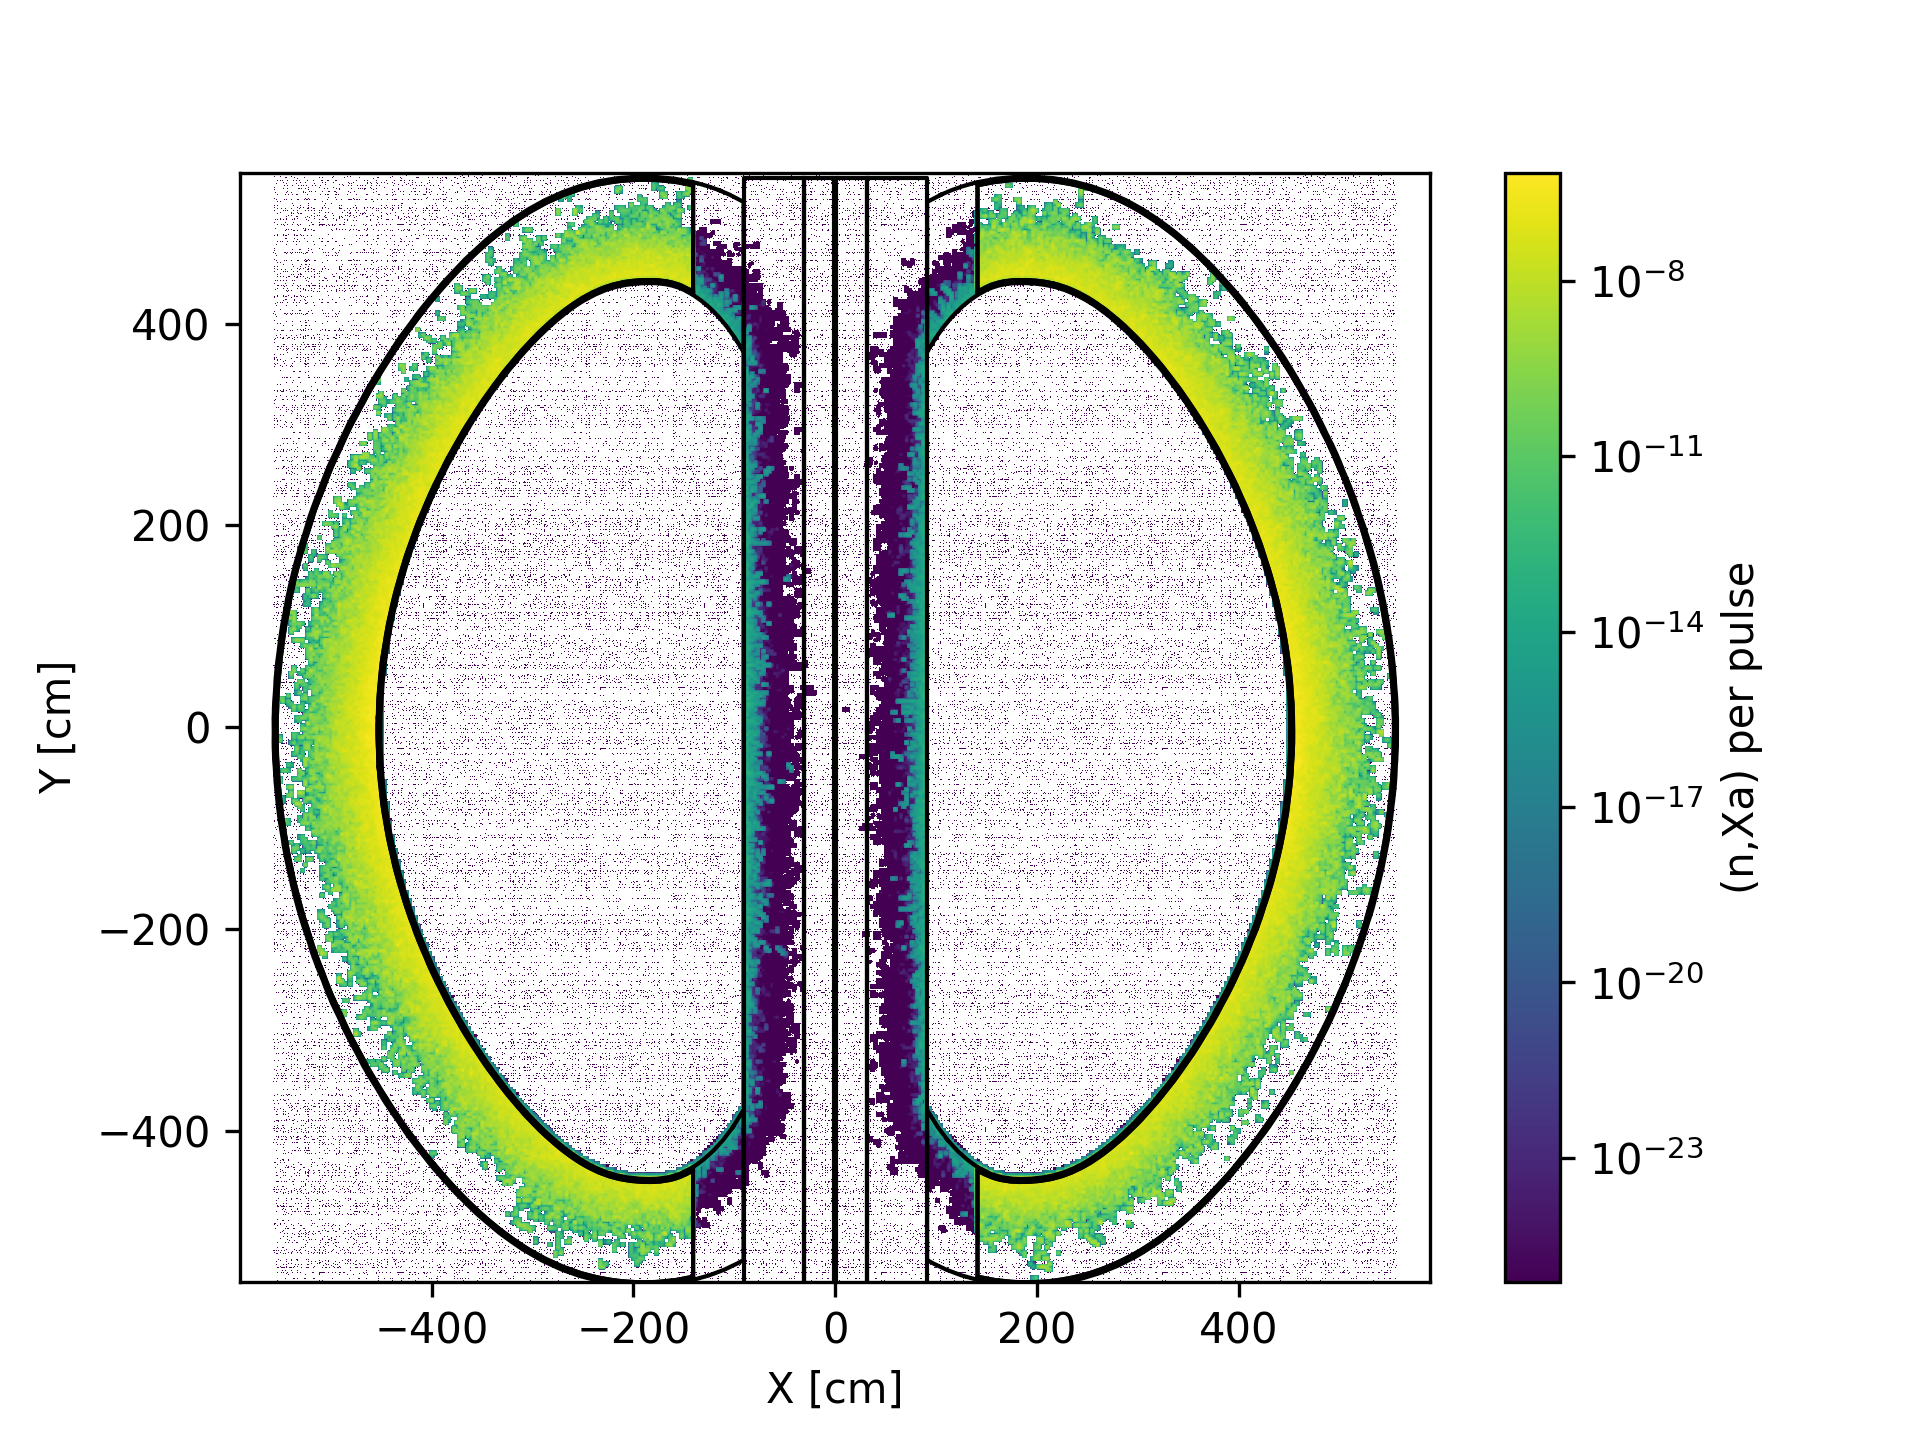
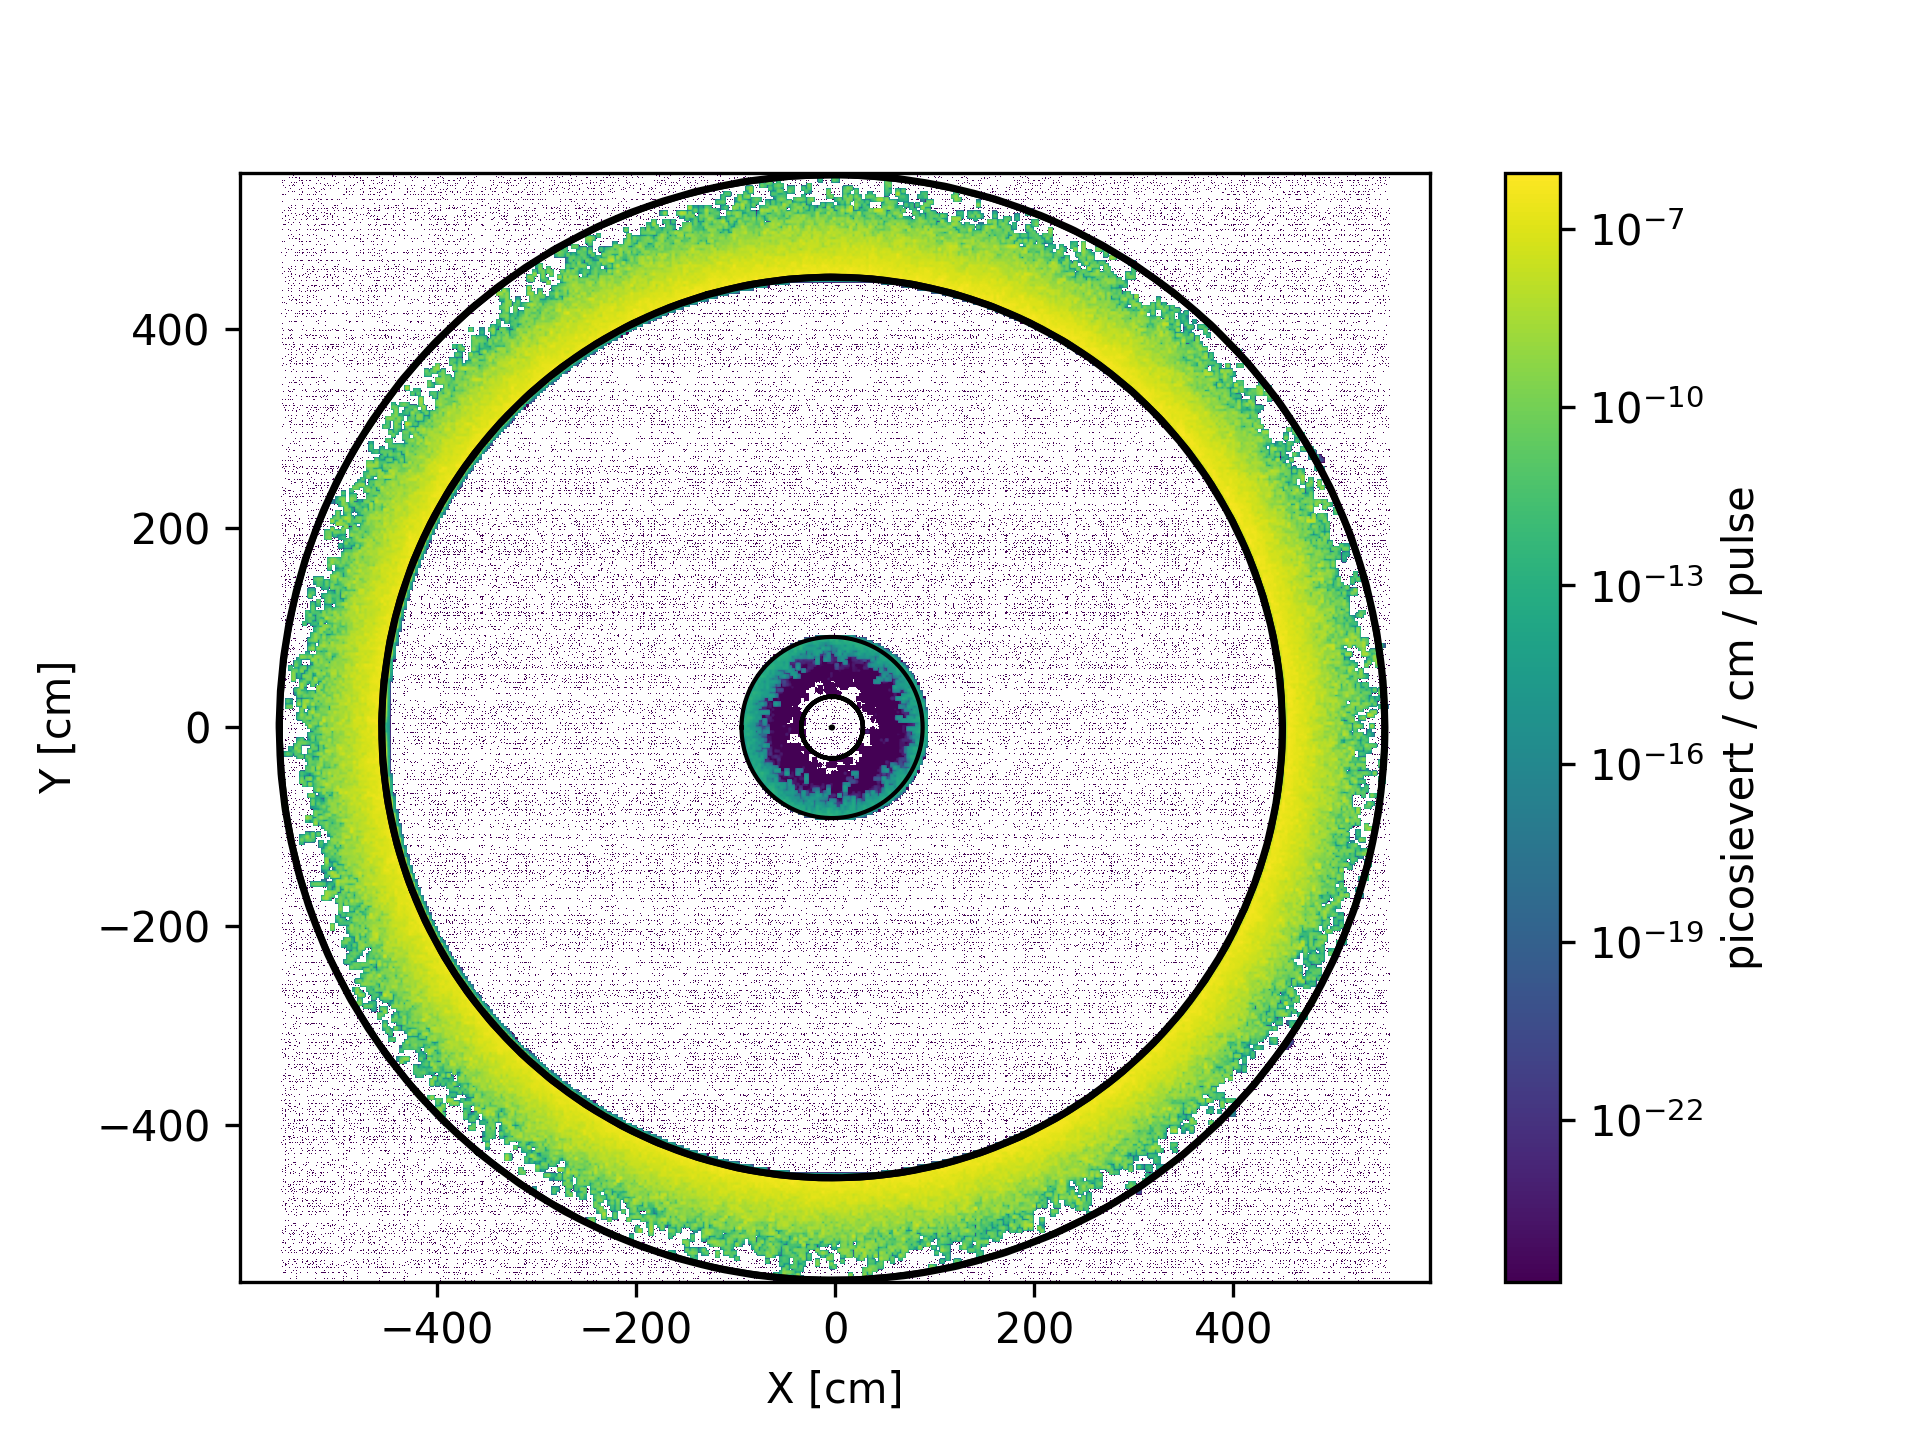
This package can also be used together with the regular_mesh_plotter Python package to combine outline slice plots with regular mesh tally results and produce images like below.
2 maintainers


Metadata
2 maintainers
Release files for dagmc-geometry-slice-plotter 0.3.1
For a detailed explanation of source distributions (sdists) and built distributions (wheels), please see the package formats documentation.
Source distribution (sdist)
| File | Size | Uploaded | |
|---|---|---|---|
| dagmc_geometry_slice_plotter-0.3.1.tar.gz | 1.1 MB | Details |
Built distribution (wheel)
| File | Interpreter | ABI | Platform | Reset |
|---|---|---|---|---|
| dagmc_geometry_slice_plotter-0.3.1-py3-none-any.whl | Python 3 | none | any | Details |
Total release size: 1.1 MB
Release files / dagmc_geometry_slice_plotter-0.3.1.tar.gz
| Download URL | dagmc_geometry_slice_plotter-0.3.1.tar.gz |
|---|---|
| Size | 1.1 MB |
| Tags | Source |
|
SHA-256 checksum How to use checksums |
0723faf6b64d03a893e070fcaff85f948ed0a16e2719feffefe35177ce52f395
|
|
BLAKE2b-256 checksum How to use checksums |
ed3749a0c7d6b81ef588c938a8331c5f4440378b57b0b5440badfd618ab8834b
|
| Upload date | |
|
Uploaded using Trusted Publishing? What is trusted publishing? |
No |
| Uploaded via |
twine/4.0.2 CPython/3.11.2
|
Release files / dagmc_geometry_slice_plotter-0.3.1-py3-none-any.whl
| Download URL | dagmc_geometry_slice_plotter-0.3.1-py3-none-any.whl |
|---|---|
| Size | 10.8 kB |
| Tags | Python 3 |
|
SHA-256 checksum How to use checksums |
b52e208c30704e9185aafa13dd80a1e8580235b1485cd6f0e778a0f567d6f71b
|
|
BLAKE2b-256 checksum How to use checksums |
db888d851b2bbc99d2f4ef75ec995d47d63907a5f5fc9a9ed0feed9174e98c19
|
| Upload date | |
|
Uploaded using Trusted Publishing? What is trusted publishing? |
No |
| Uploaded via |
twine/4.0.2 CPython/3.11.2
|














