
dash_charts
Note
In 2019-2020, I was building applications with Dash and wanted a way to make them more composable and reusable. Since then, I moved on to other projects and Dash has become far more composable. Dash expanded plotly express and introduced templates along with other changes as the ecosystem has evolved!
Given the advances in Dash, I'm going to archive this project, publish a final release to PyPi, and move on to other projects
Python package for Plotly/Dash apps with support for multi-page, modules, and new charts such as Pareto with an Object Orient Approach
Includes base classes for building a custom chart or application, new charts such as a Pareto, and base classes for tabbed or multi-page applications. See full documentation at https://kyleking.me/dash_charts/. ( TODO: Currently not online )
- dash_charts
Quick Start
1. Install
With Poetry install dash_charts with: poetry add dash_charts --git https://github.com/KyleKing/dash_charts.git#main
2. Example Code
"""Example Dash Application."""

from typing import Optional

import dash
from dash import html
import plotly.express as px
from box import Box
from implements import implements

from dash_charts.pareto_chart import ParetoChart
from dash_charts.utils_app import AppBase, AppInterface
from dash_charts.utils_fig import min_graph

# FIXME: the change to use Box/_ID needs to be implemented in the examples. This is causing failures in the test cases
#   Still pending if this is the preferred approach
_ID = Box({
    'chart': 'pareto',
})
"""Default App IDs."""


@implements(AppInterface)
class ParetoDemo(AppBase):
    """Example creating a simple Pareto chart."""

    def __init__(self, app: Optional[dash.Dash] = None) -> None:
        """Initialize app and initial data members. Should be inherited in child class and called with super().

        Args:
            app: Dash instance. If None, will create standalone app. Otherwise, will be part of existing app

        """
        self.name = 'Car Share Pareto Demo'
        self.data_raw = None
        self.chart_main = None
        self._id = _ID

        super().__init__(app=app)

    def generate_data(self) -> None:
        """Format the car share data from plotly express for the Pareto. Called by parent class."""
        self.data_raw = (px.data.carshare()
                         .rename(columns={'peak_hour': 'category', 'car_hours': 'value'}))
        self.data_raw['category'] = [f'H:{cat:02}' for cat in self.data_raw['category']]

    def create_elements(self) -> None:
        """Initialize the charts, tables, and other Dash elements."""
        self.chart_main = ParetoChart(title='Car Share Pareto', xlabel='Peak Hours', ylabel='Car Hours')

    def return_layout(self) -> dict:
        """Return Dash application layout.

        Returns:
            dict: Dash HTML object

        """
        return html.Div([
            html.Div([min_graph(
                id=self._il[self._id.chart],
                figure=self.chart_main.create_figure(df_raw=self.data_raw),
            )]),
        ])

    def create_callbacks(self) -> None:
        """Register the callbacks."""
        pass  # Override base class. Not necessary for this example


if __name__ == '__main__':
    app = ParetoDemo()
    app.create()
    app.run(debug=True)
else:
    app = instance()
    app.create()
    FLASK_HANDLE = app.get_server()
3. Resulting Pareto Chart

4. Additional Notes
TO get the most out of the tools, you may want to add calcipy and add the below snippets to your pyproject.toml file
[tool.poetry.dev-dependencies.dash]
extras = [ "testing",]
version = "*, ^1.19"

[tool.poetry.dependencies.calcipy]
git = "https://github.com/kyleking/calcipy.git"
branch = "dev/development"
rev = "01635ea"  # Always pin to a commit
develop = true  # Optional: will reinstall each time

[tool.poetry.dev-dependencies.calcipy]
git = "https://github.com/kyleking/calcipy.git"
branch = "dev/development"
extras = [ "dev", "lint", "test", "commitizen_legacy"]
You will also want at minimum the dodo.py and folder structure from dash_charts
Design Principles
I wanted to show that an object oriented programming approach to Dash projects could be really powerful for improving code reuse and improving readability in large projects. Below are a couple of design principles to keep that I try to keep in mind when implementing this package.
- Try to encapsulate all application logic (callbacks, ids, etc.) in application classes or modules
- For components that are reused between application, create a
module. The layout, state, and callbacks can all be delegated to the module rather than cluttering the main application's class and allowing for better code reuse - Move any methods that do not require state (
self) into standalone functions - If you can separate Dash (ids/layout/Callbacks) and Plotly (figures/tables) code, you can generate static HTML or PNGs more easily. Sometimes static output is useful when programmatically generating views rather than tweaking the interactive inputs each time.
Overall, I find that this package really improves my Dash code and I hope others find it useful. Please feel free to submit PRs or open issues if you have any input. See ./DESIGN.md for additional information on design decisions and package architecture
Local Development
Initial commands to clone code from Github, create Python virtual environment, and run first example application
git clone https://github.com/KyleKing/dash_charts.git
cd dash_charts
poetry install
poetry shell
python tests/examples/ex_app_px.py
Other useful scripts for testing, documentation, and more:
poetry run ptw -- -m "not INTERACTIVE"
poetry run doit run test
poetry run doit
Example Charts and Tables
Below are screenshots and links to the example code for each chart or table included in dash_charts
Pareto Chart
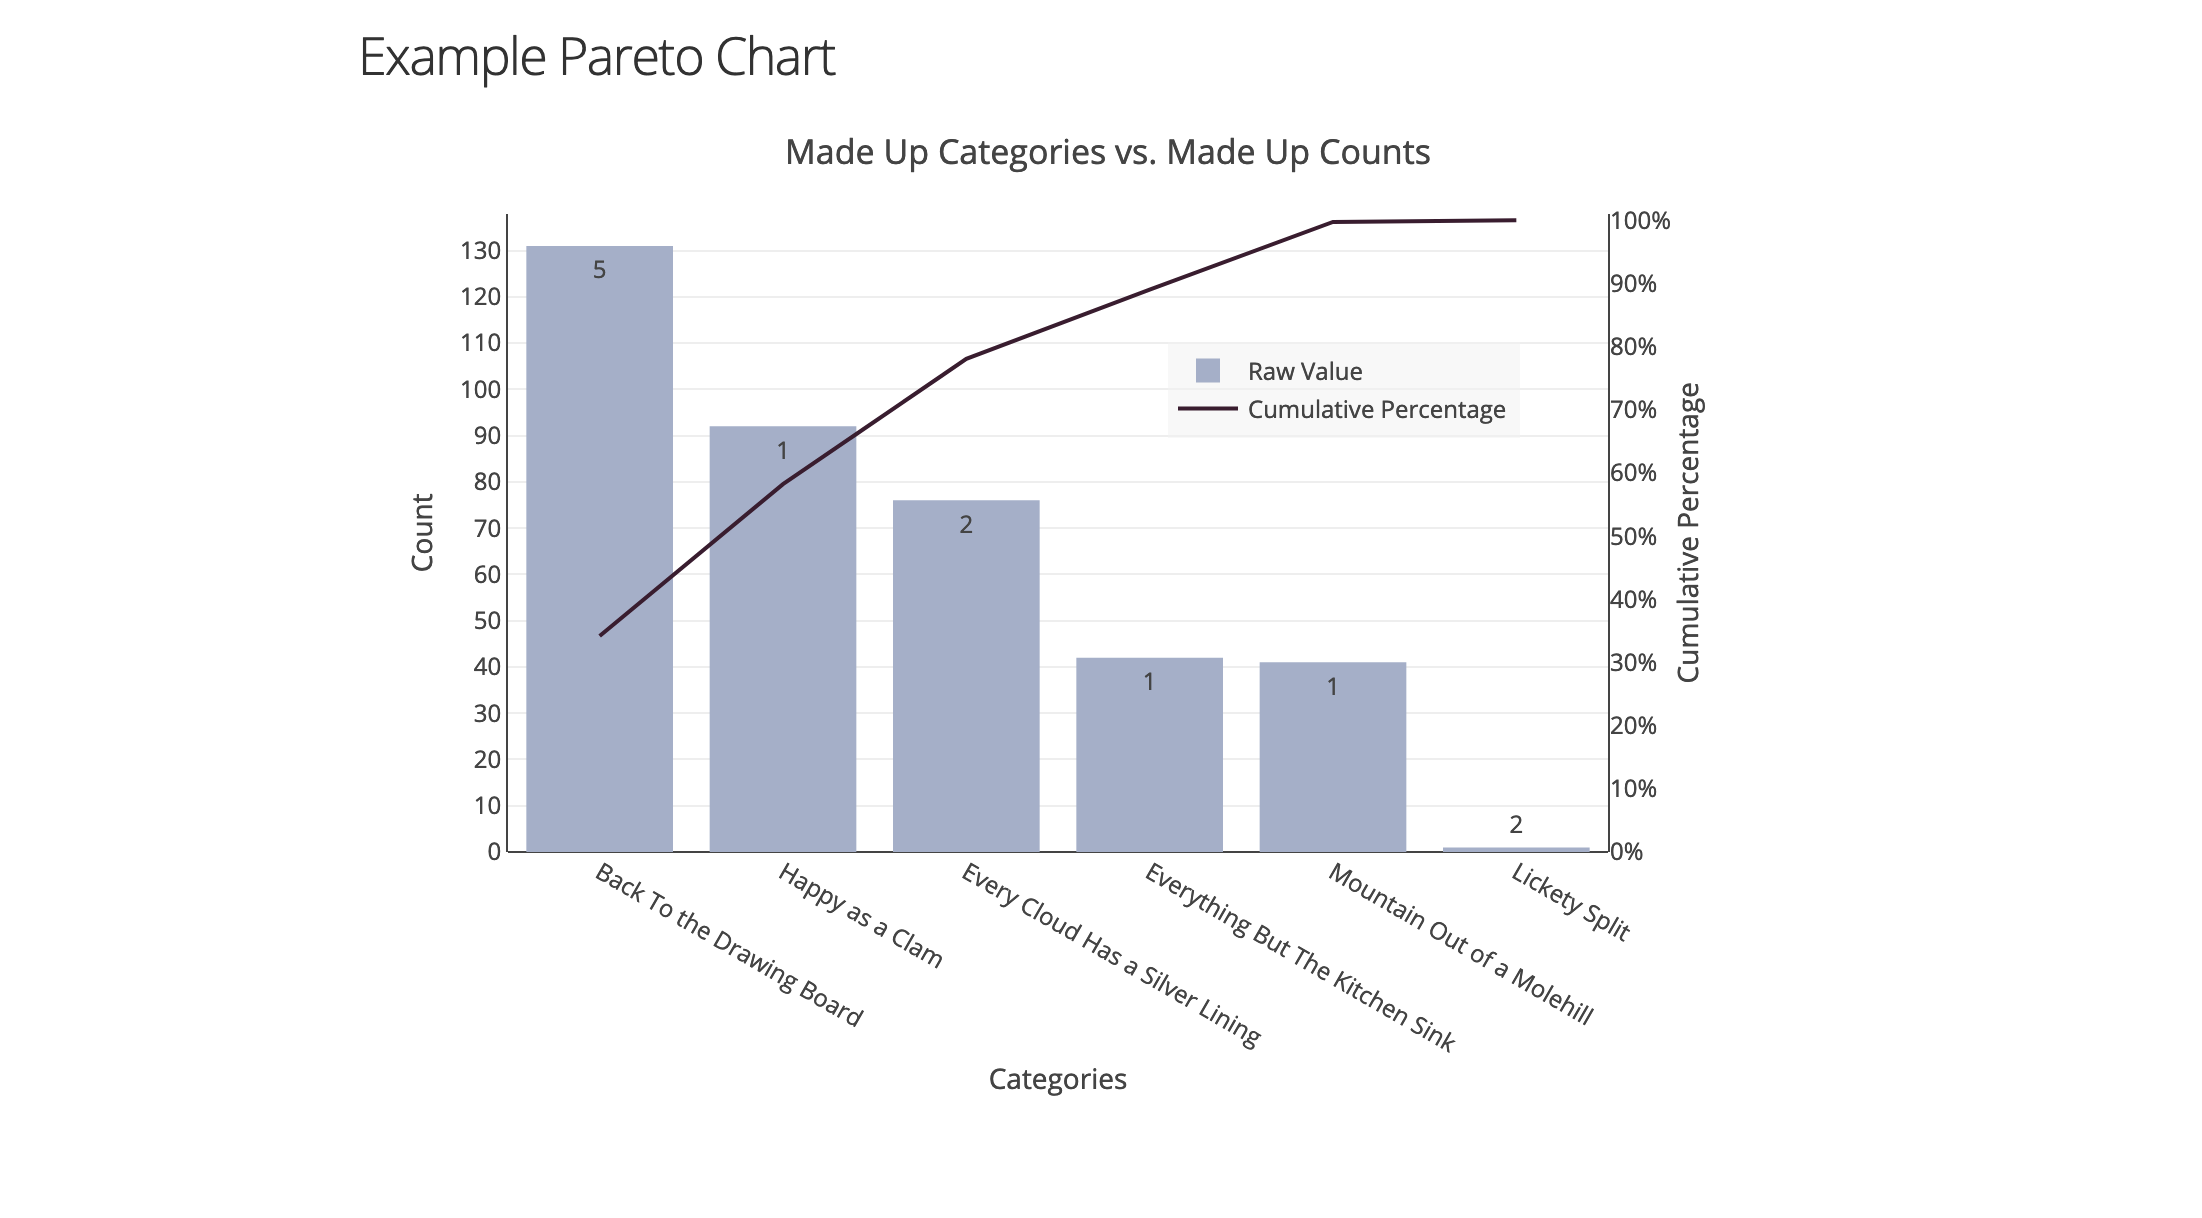
Create Pareto charts in Dash. Handles ordering the category, calculating the cumulative percentage, and configuring both YAxis.
See sample code in tests/examples/ex_pareto_chart.py. Screenshot below:
Gantt Chart
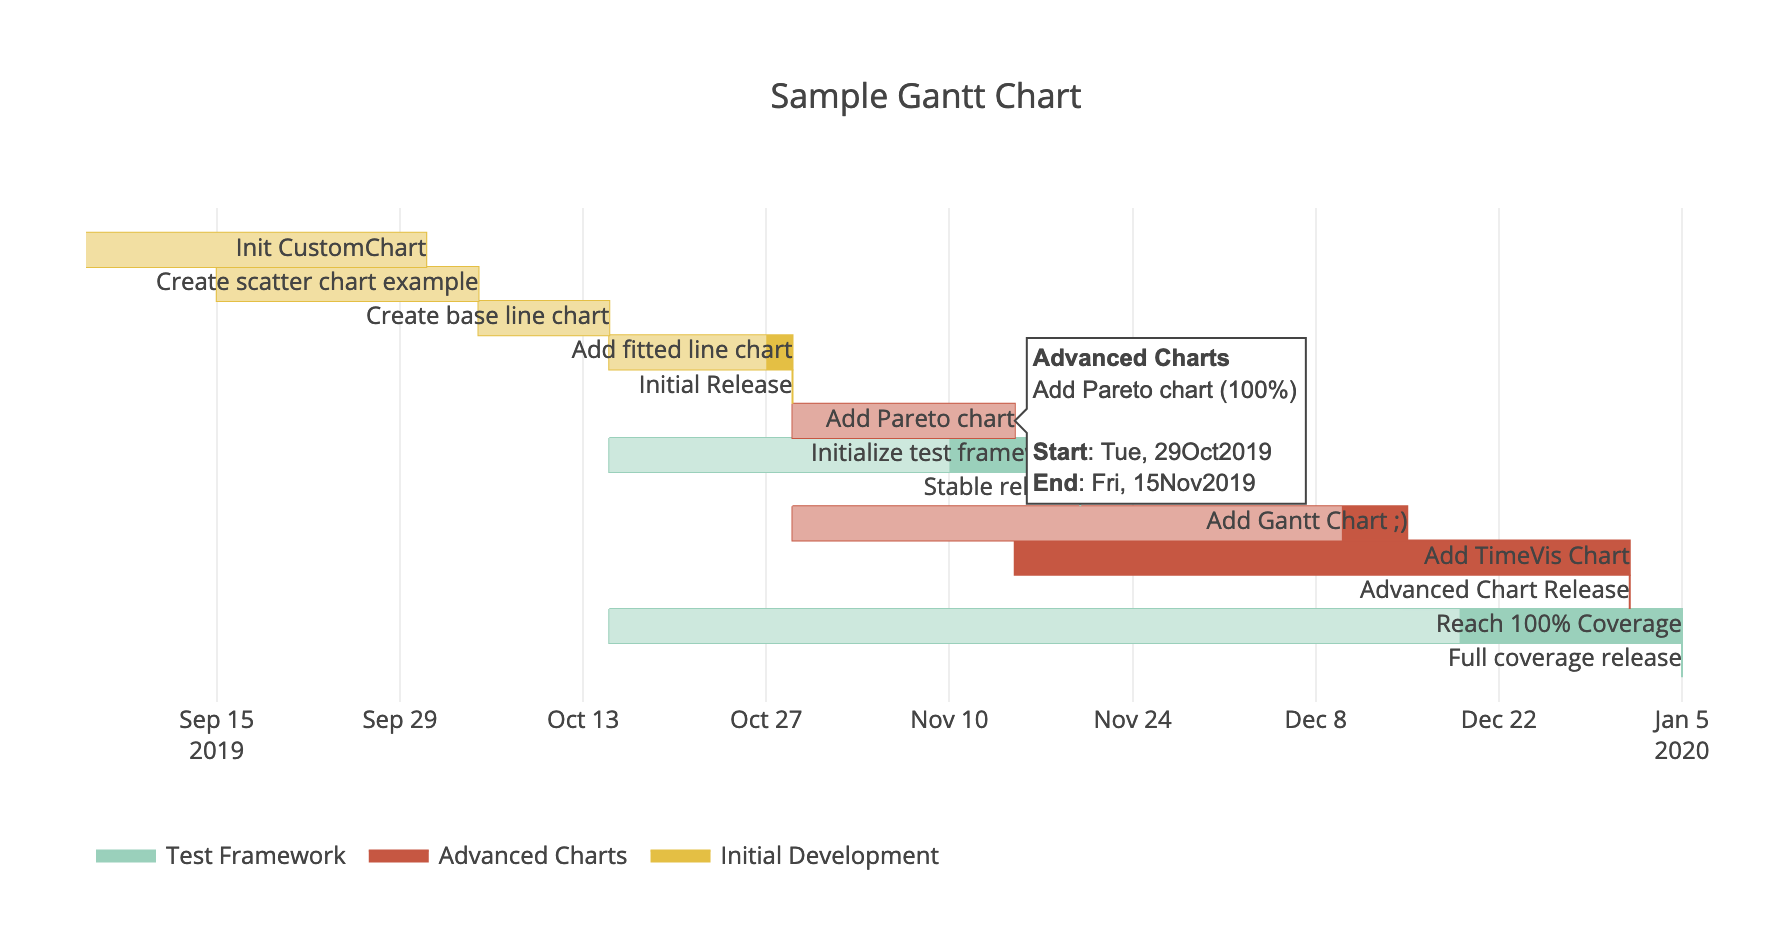
Create simple Gantt charts in Dash. Doesn't support more advanced features such as dependencies and resource assignment, but effectively shows tasks, progress, and projects in a clear way. You can toggle the different projects on/off and use zoom like a normal Plotly chart.
See sample code in tests/examples/ex_gantt_chart.py. Screenshot below:
Time Vis Chart
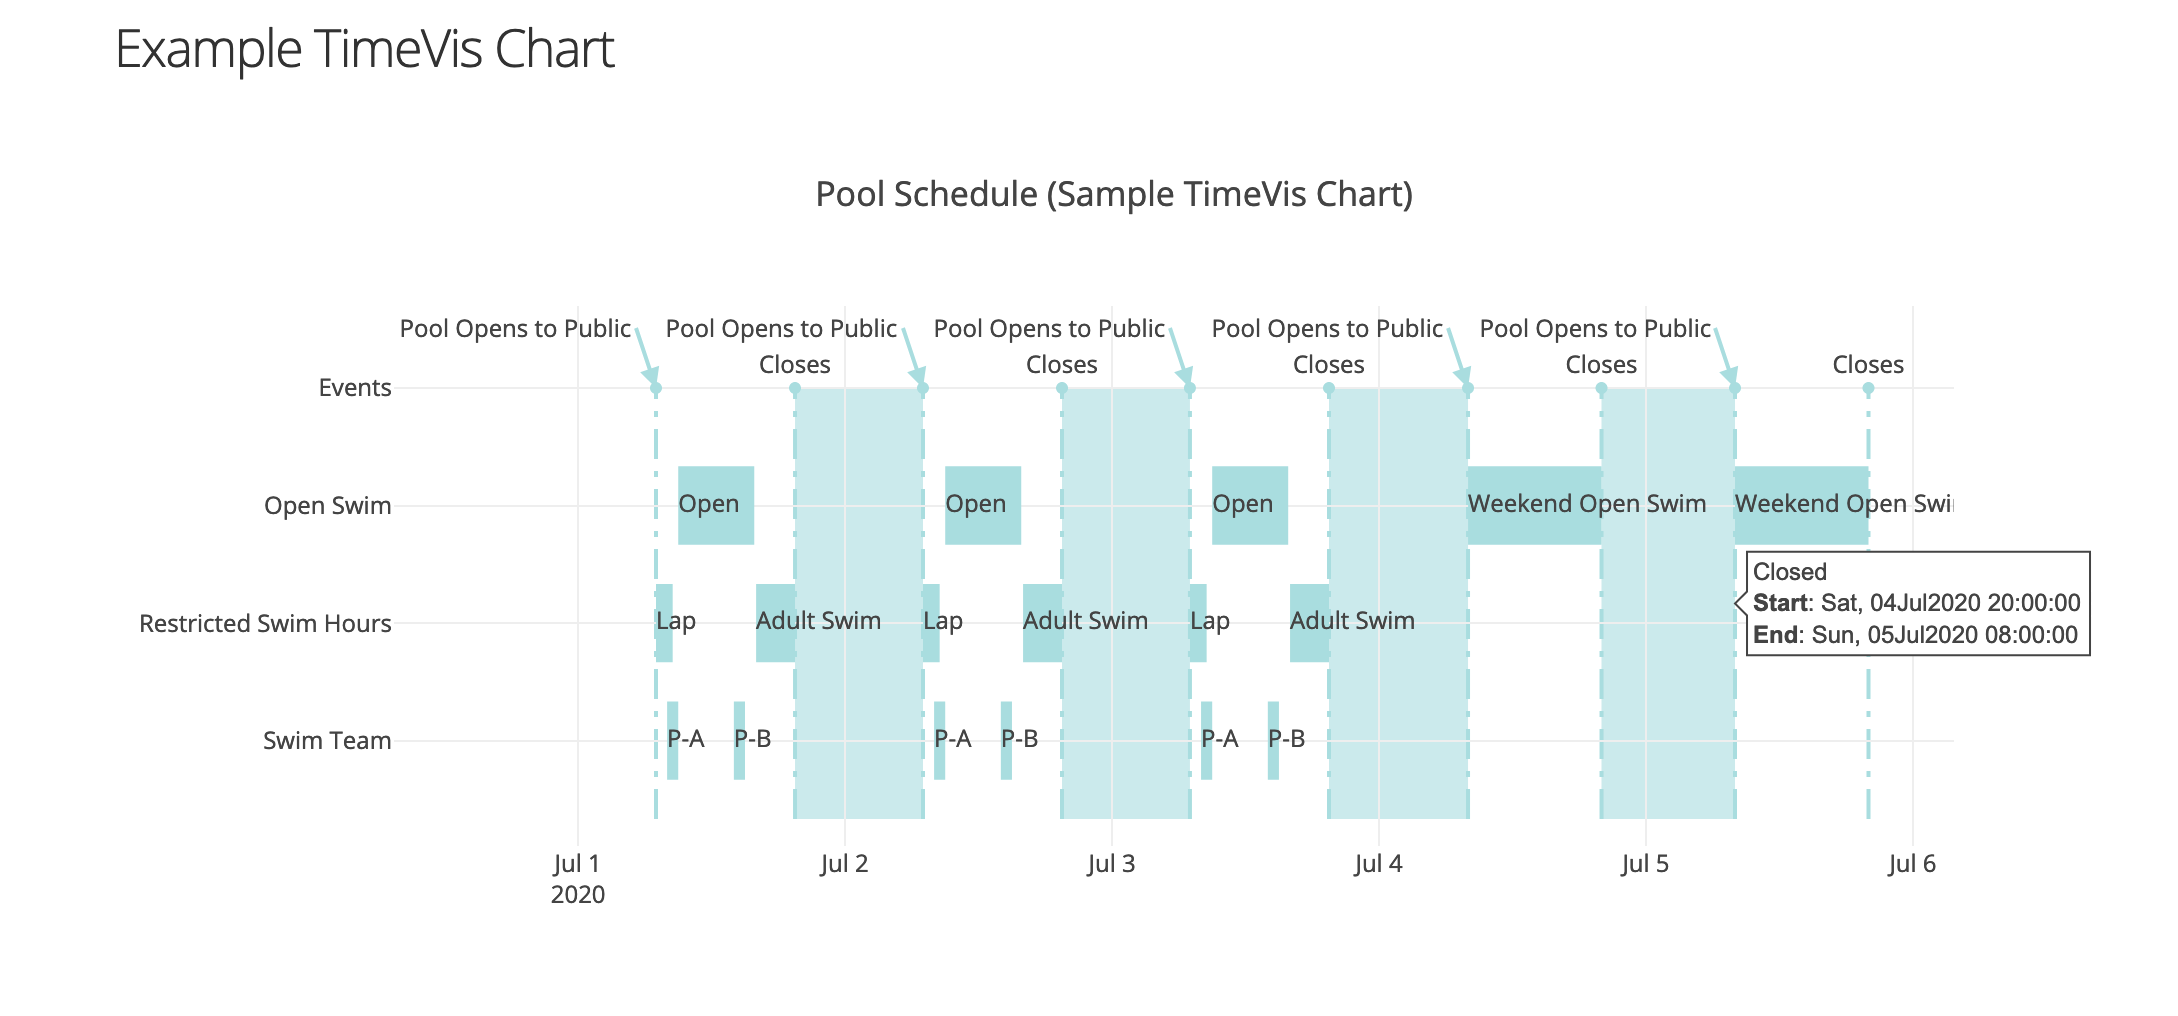
Create a TimeVis chart to plot general time visualizations (based on daattali/timevis from R). This chart differs from a Gantt chart by showing events that repeat in the same row.
See sample code in tests/examples/ex_time_vis_chart.py. Screenshot below:
Rolling Mean and STD Chart
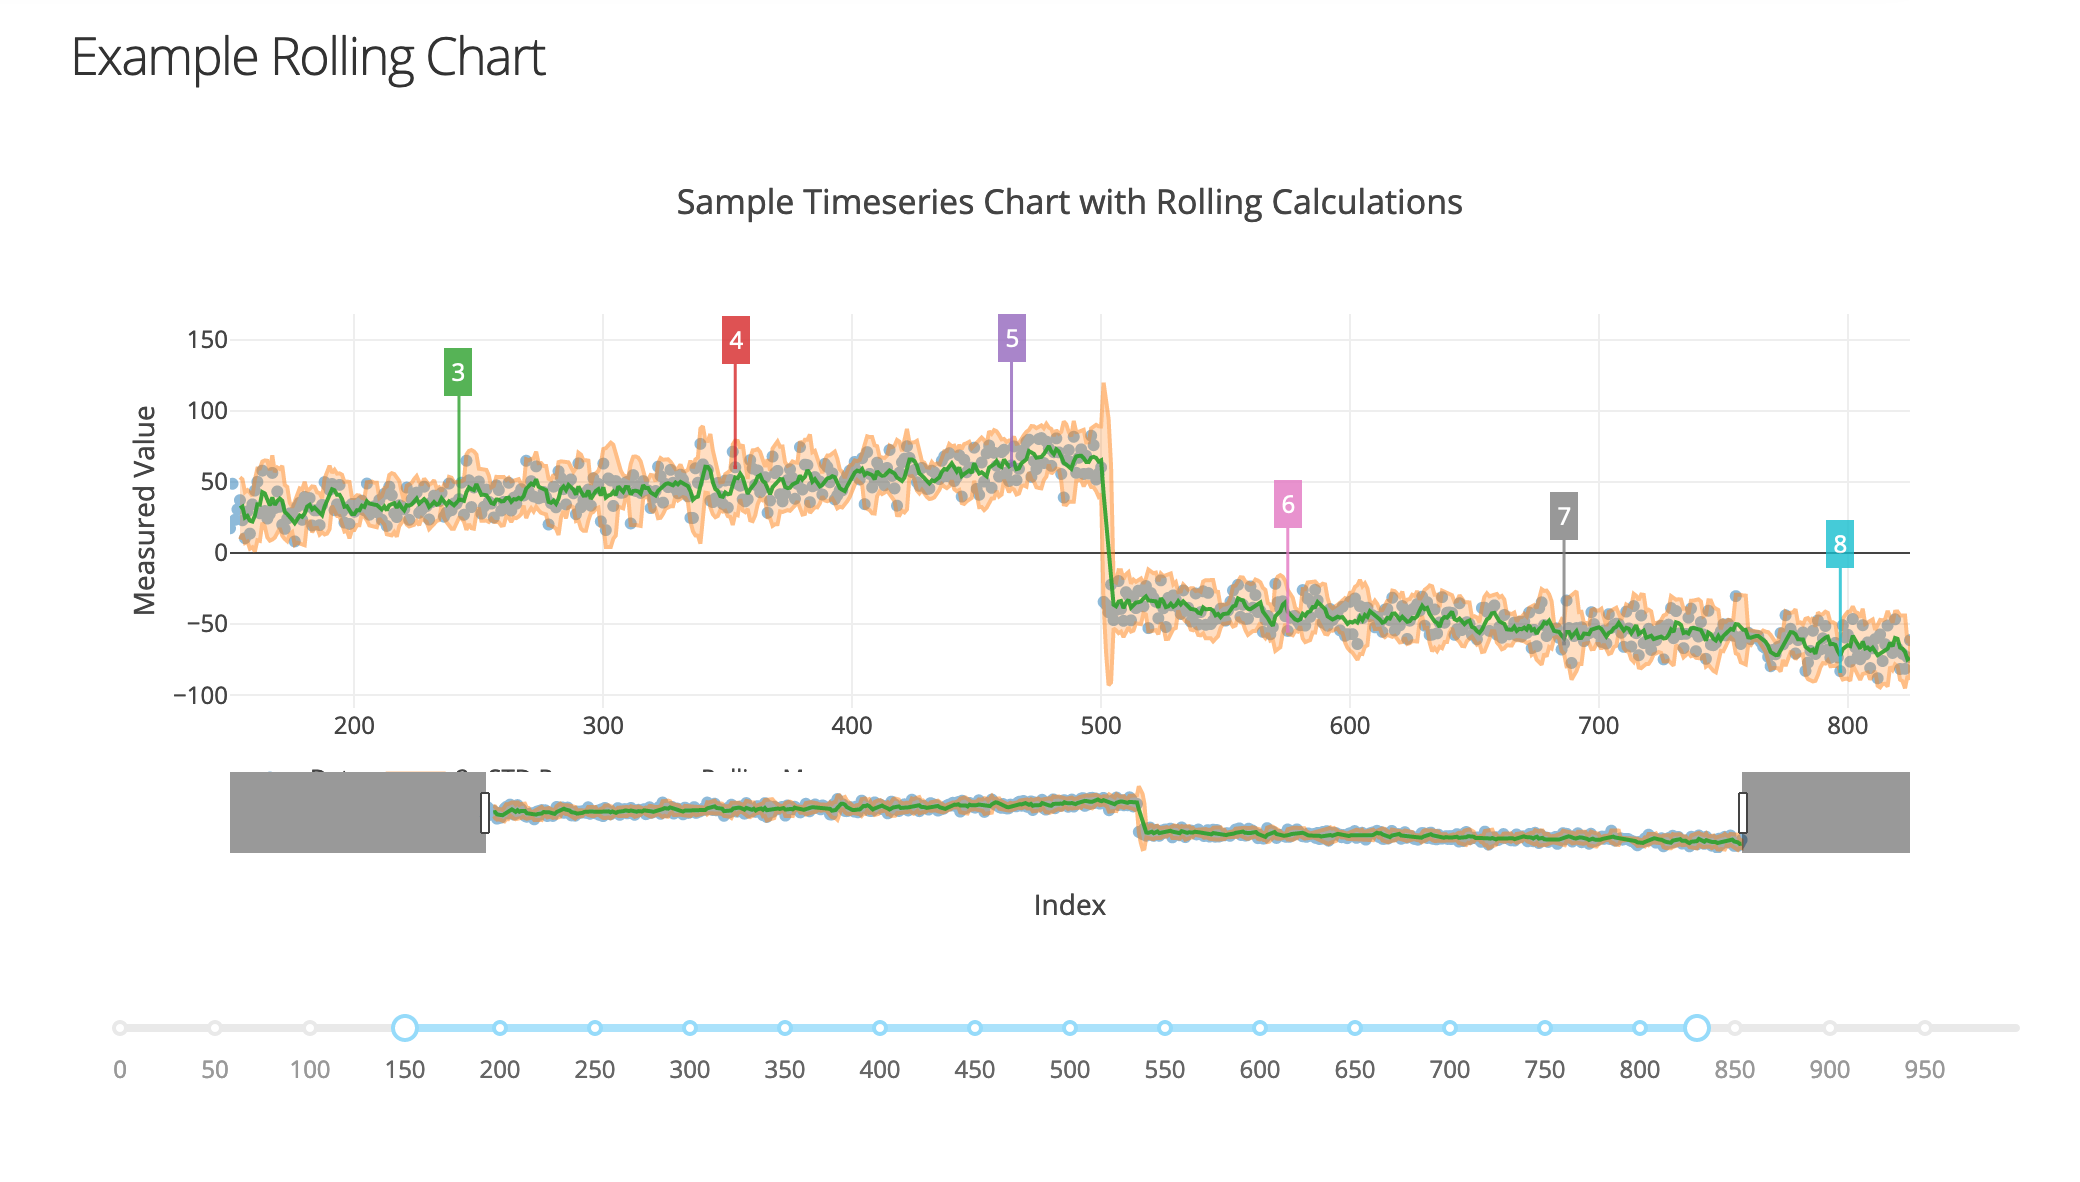
Easily chart the rolling mean and standard deviation for a given scatter data set. Demonstrates using chart annotations.
See sample code in tests/examples/ex_rolling_chart.py. Screenshot below:
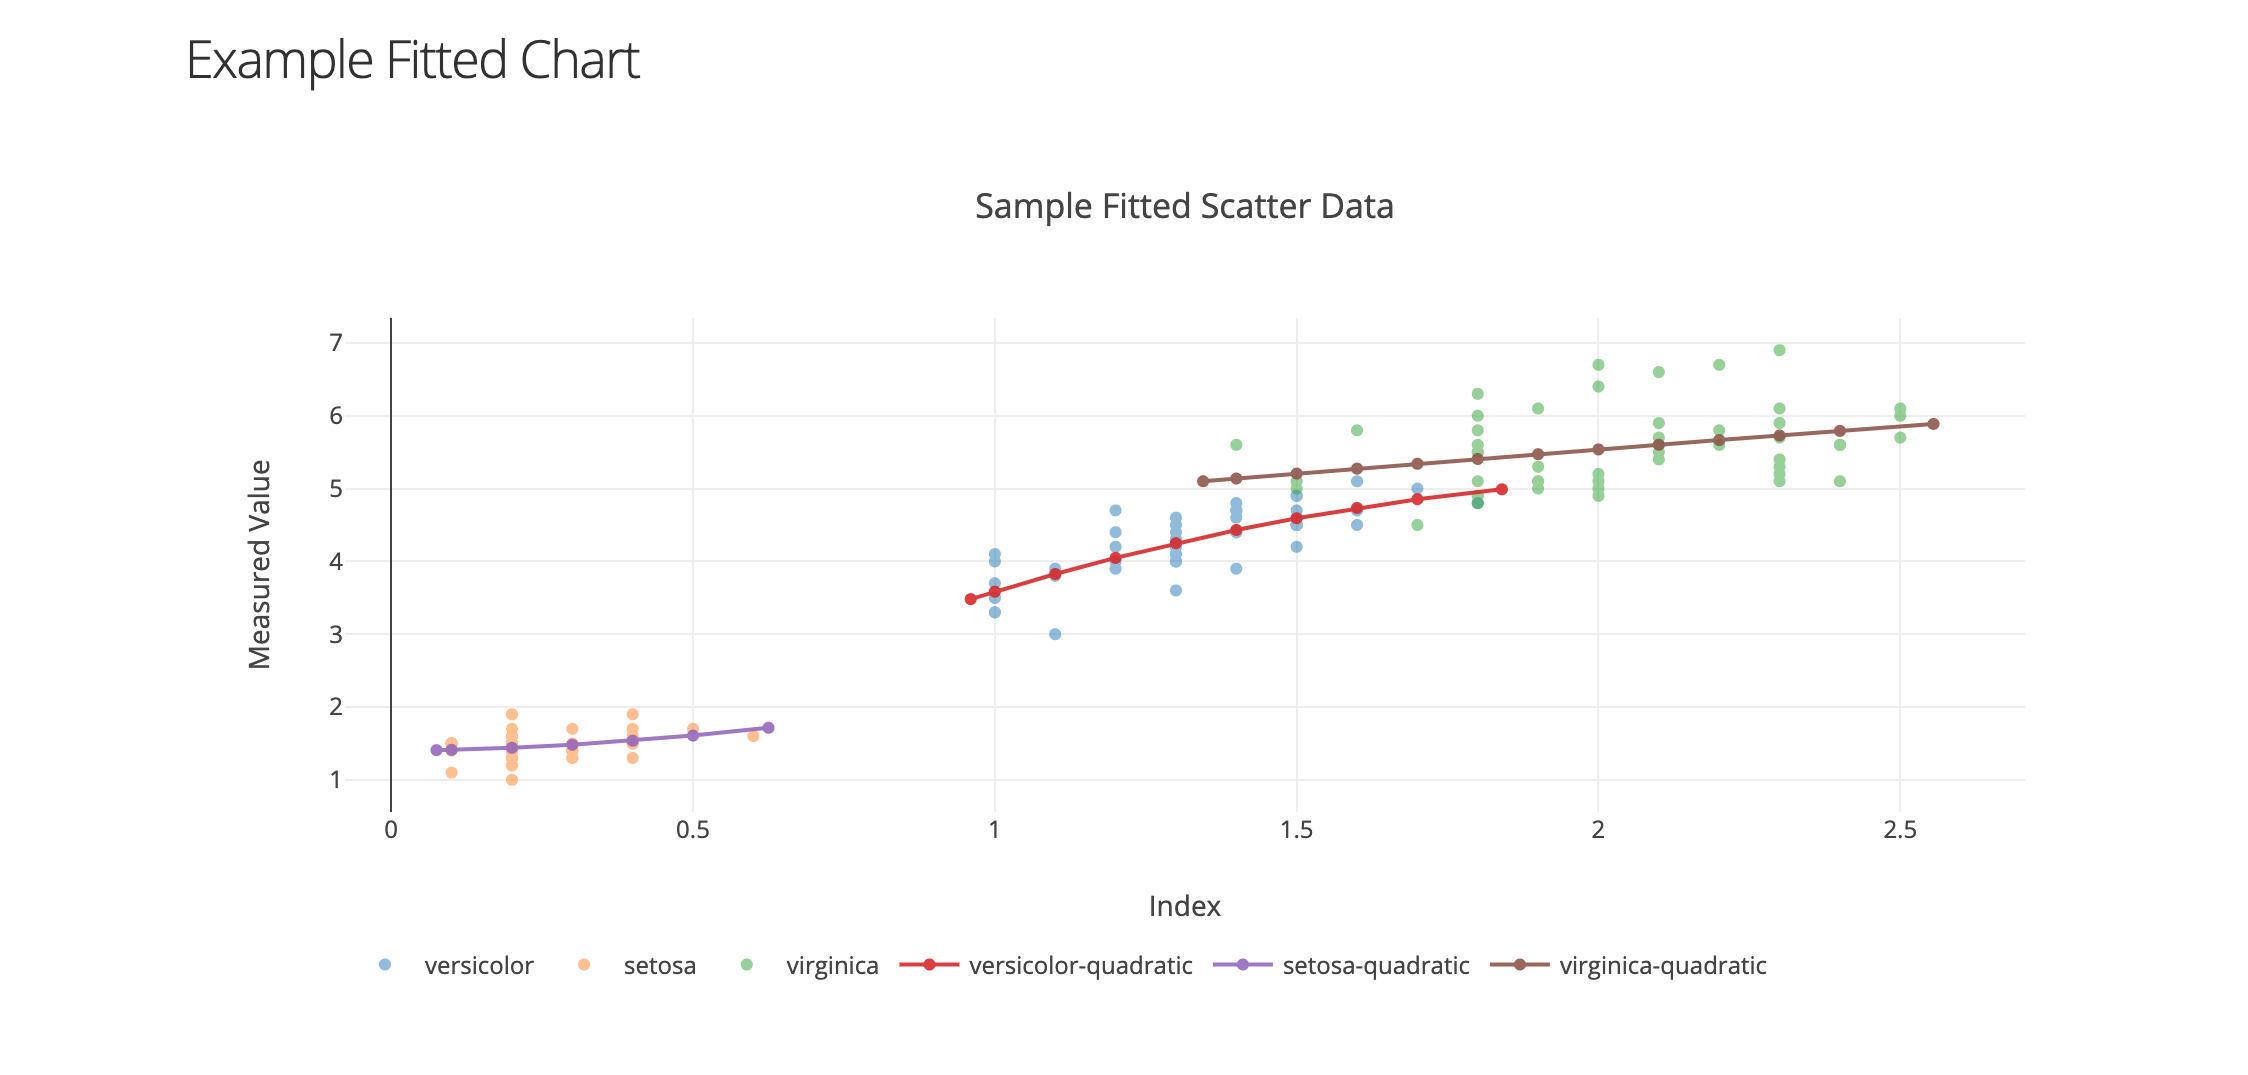
Fitted Chart
Fit arbitrary scatter data with a specified equation. On hover will show the rounded fit parameters. Useful for experimenting with new data.
See sample code in tests/examples/ex_fitted_chart.py. Screenshot below:
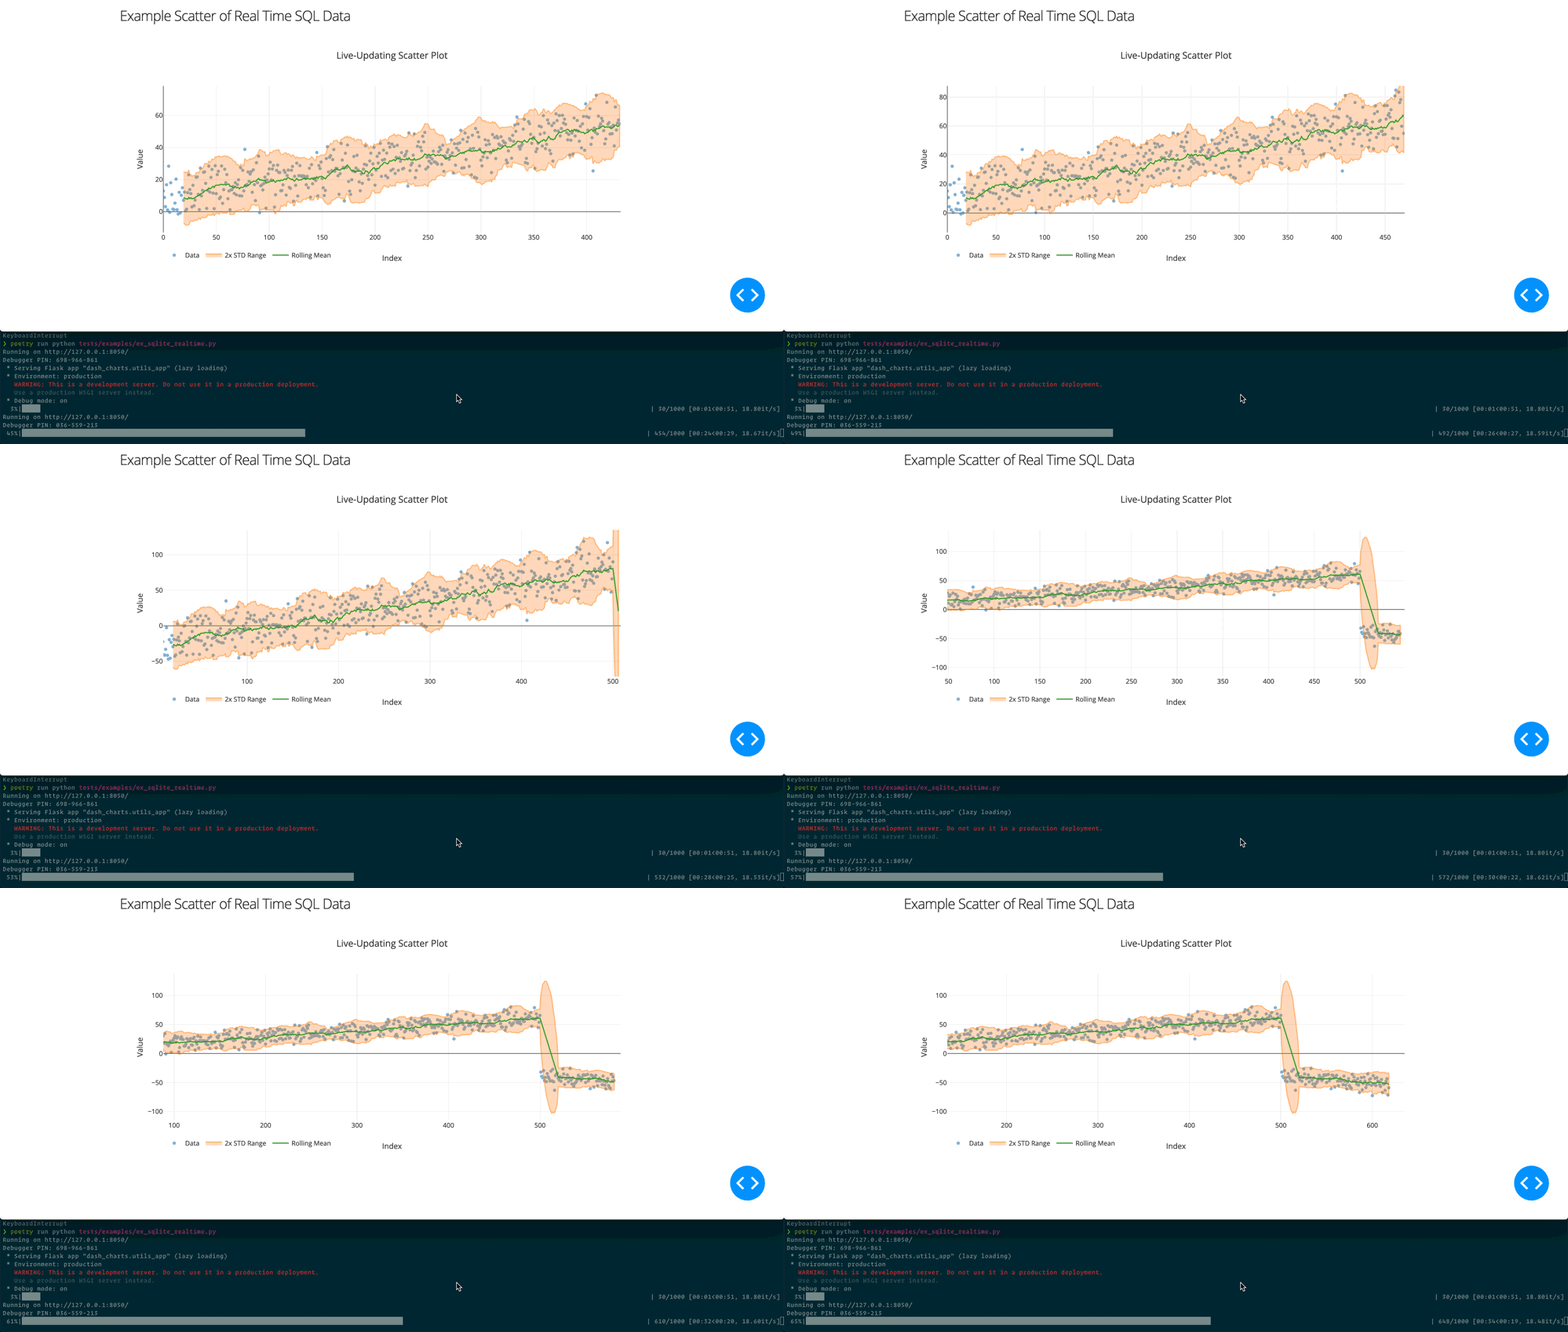
Real Time SQL Demo
Example using a Rolling Chart to show real time data from a SQLite database. For the demo, a background thread populates the database as the Dash app runs in a separate thread.
See sample code in tests/examples/ex_sqlite_realtime.py. Screenshot below:
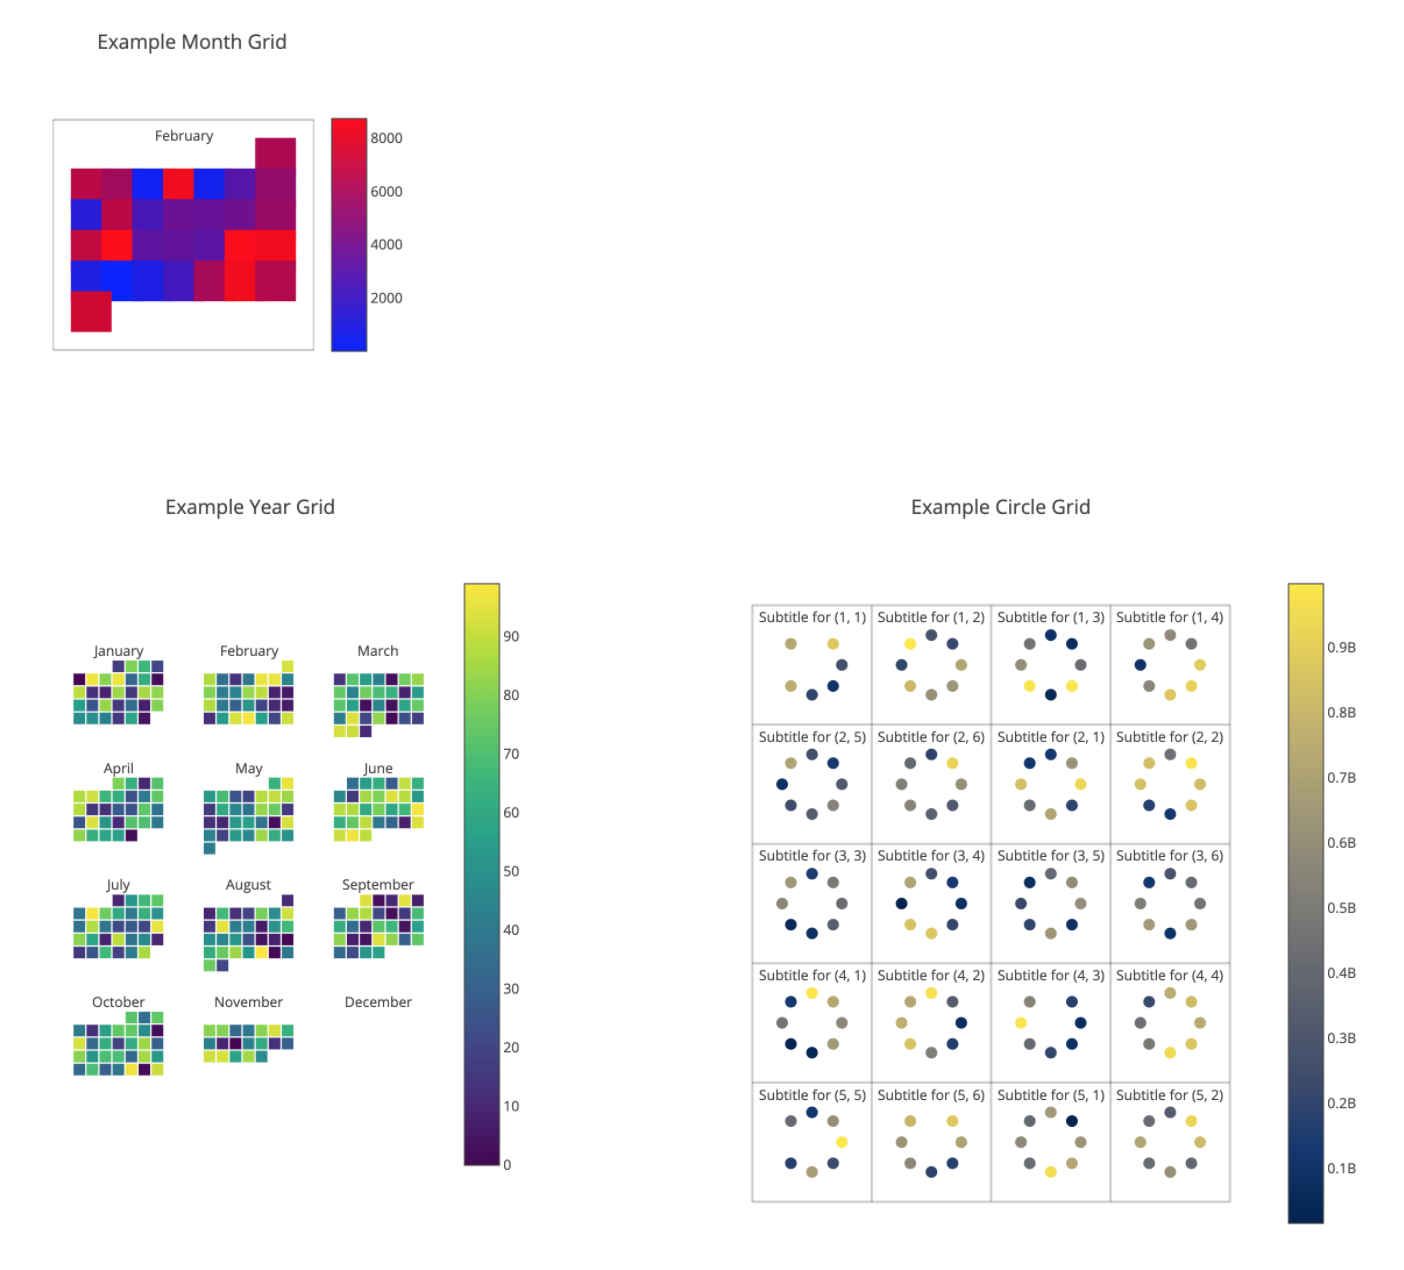
Coordinate Chart
Chart a discrete data set on a 2D plane with color for intensity. Below examples show how to use the YearGrid(), MonthGrid(), and CircleGrid() classes
See sample code in tests/examples/ex_coordinate_chart.py. Screenshot below:
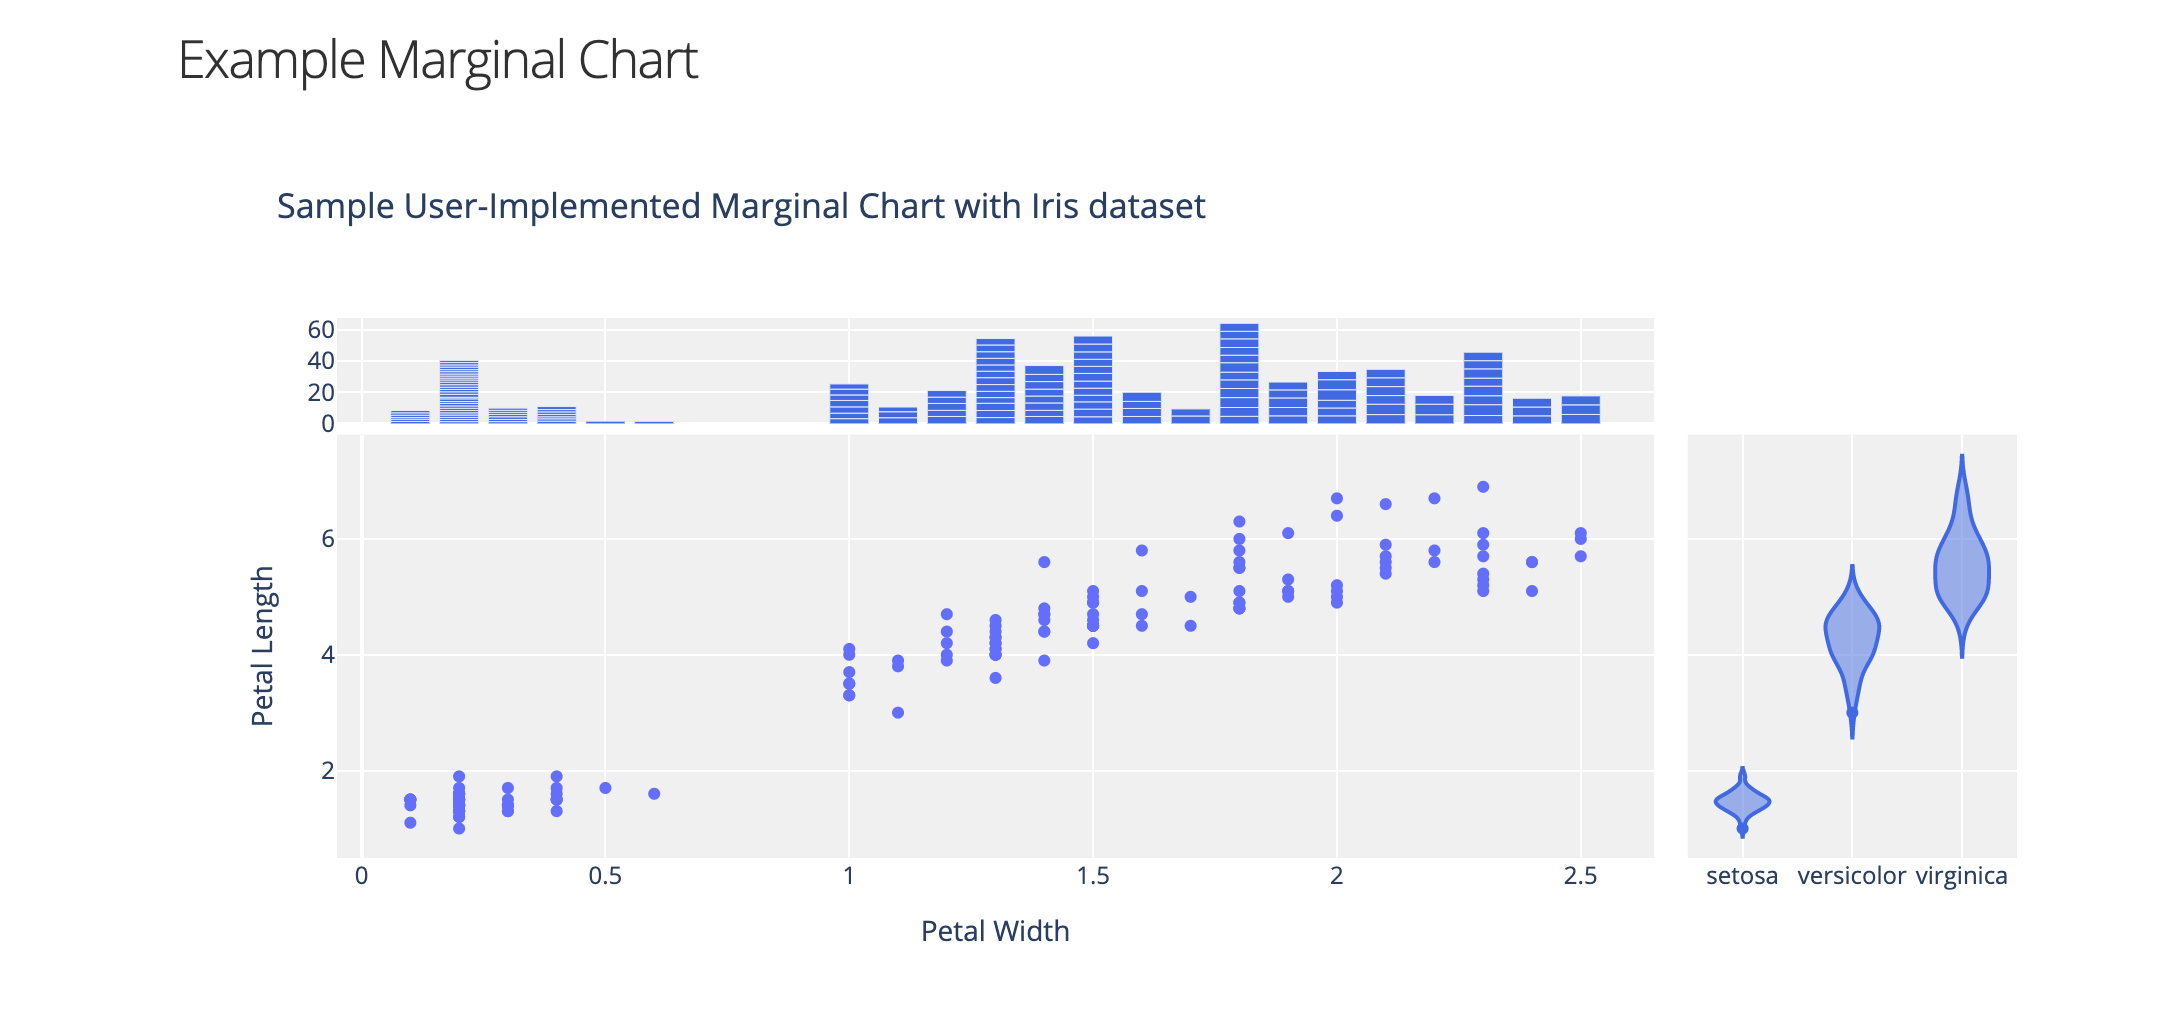
Marginal Chart
Example creating a new chart from utils_fig.MarginalChart
See sample code in tests/examples/ex_marginal_chart.py. Screenshot below:
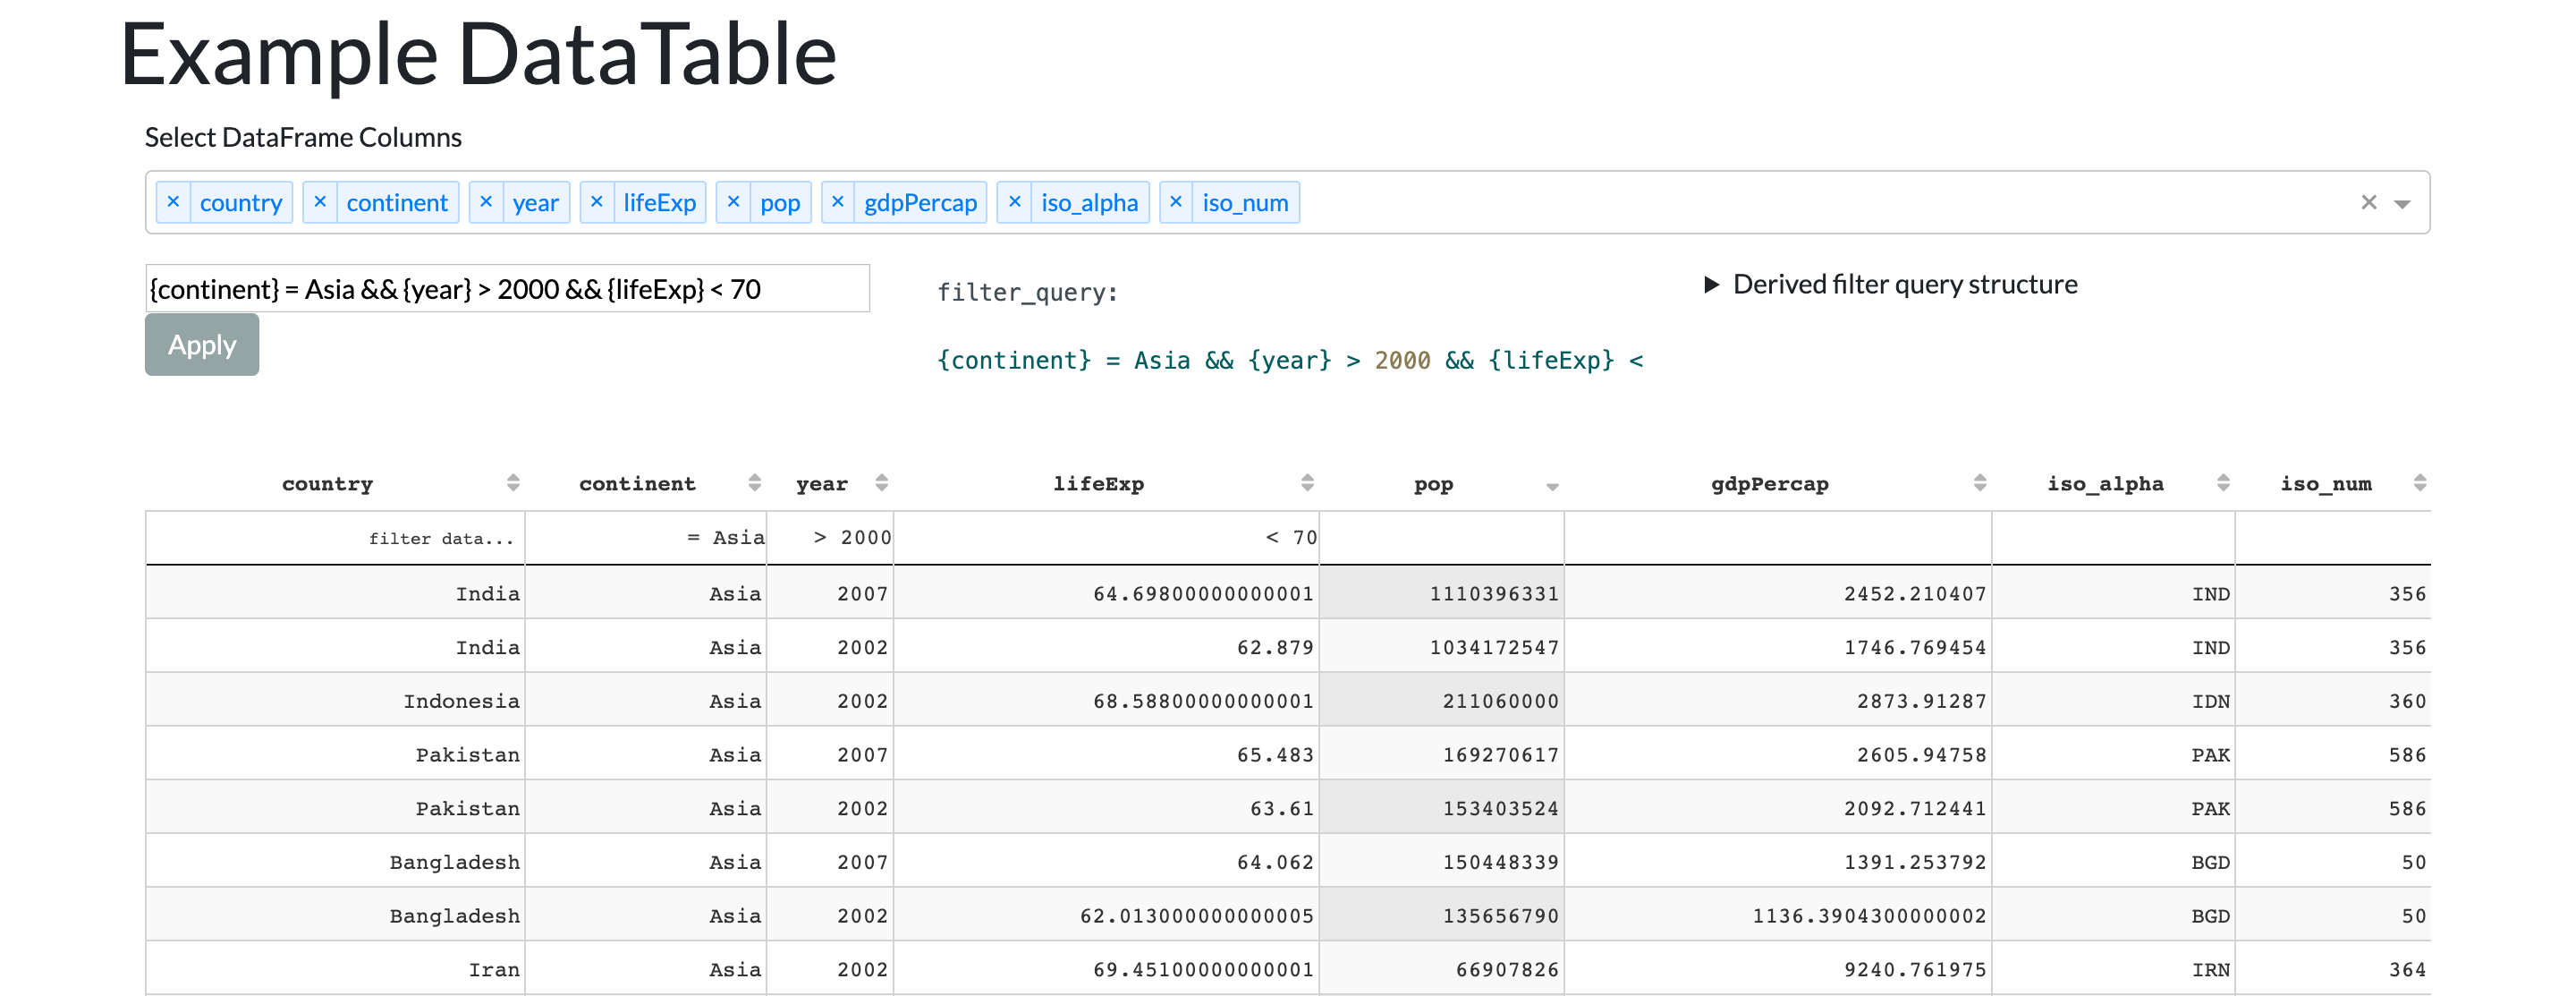
Data Table Module
Display Dash data table from dataframe
See sample code in tests/examples/ex_datatable.py. Screenshot below:
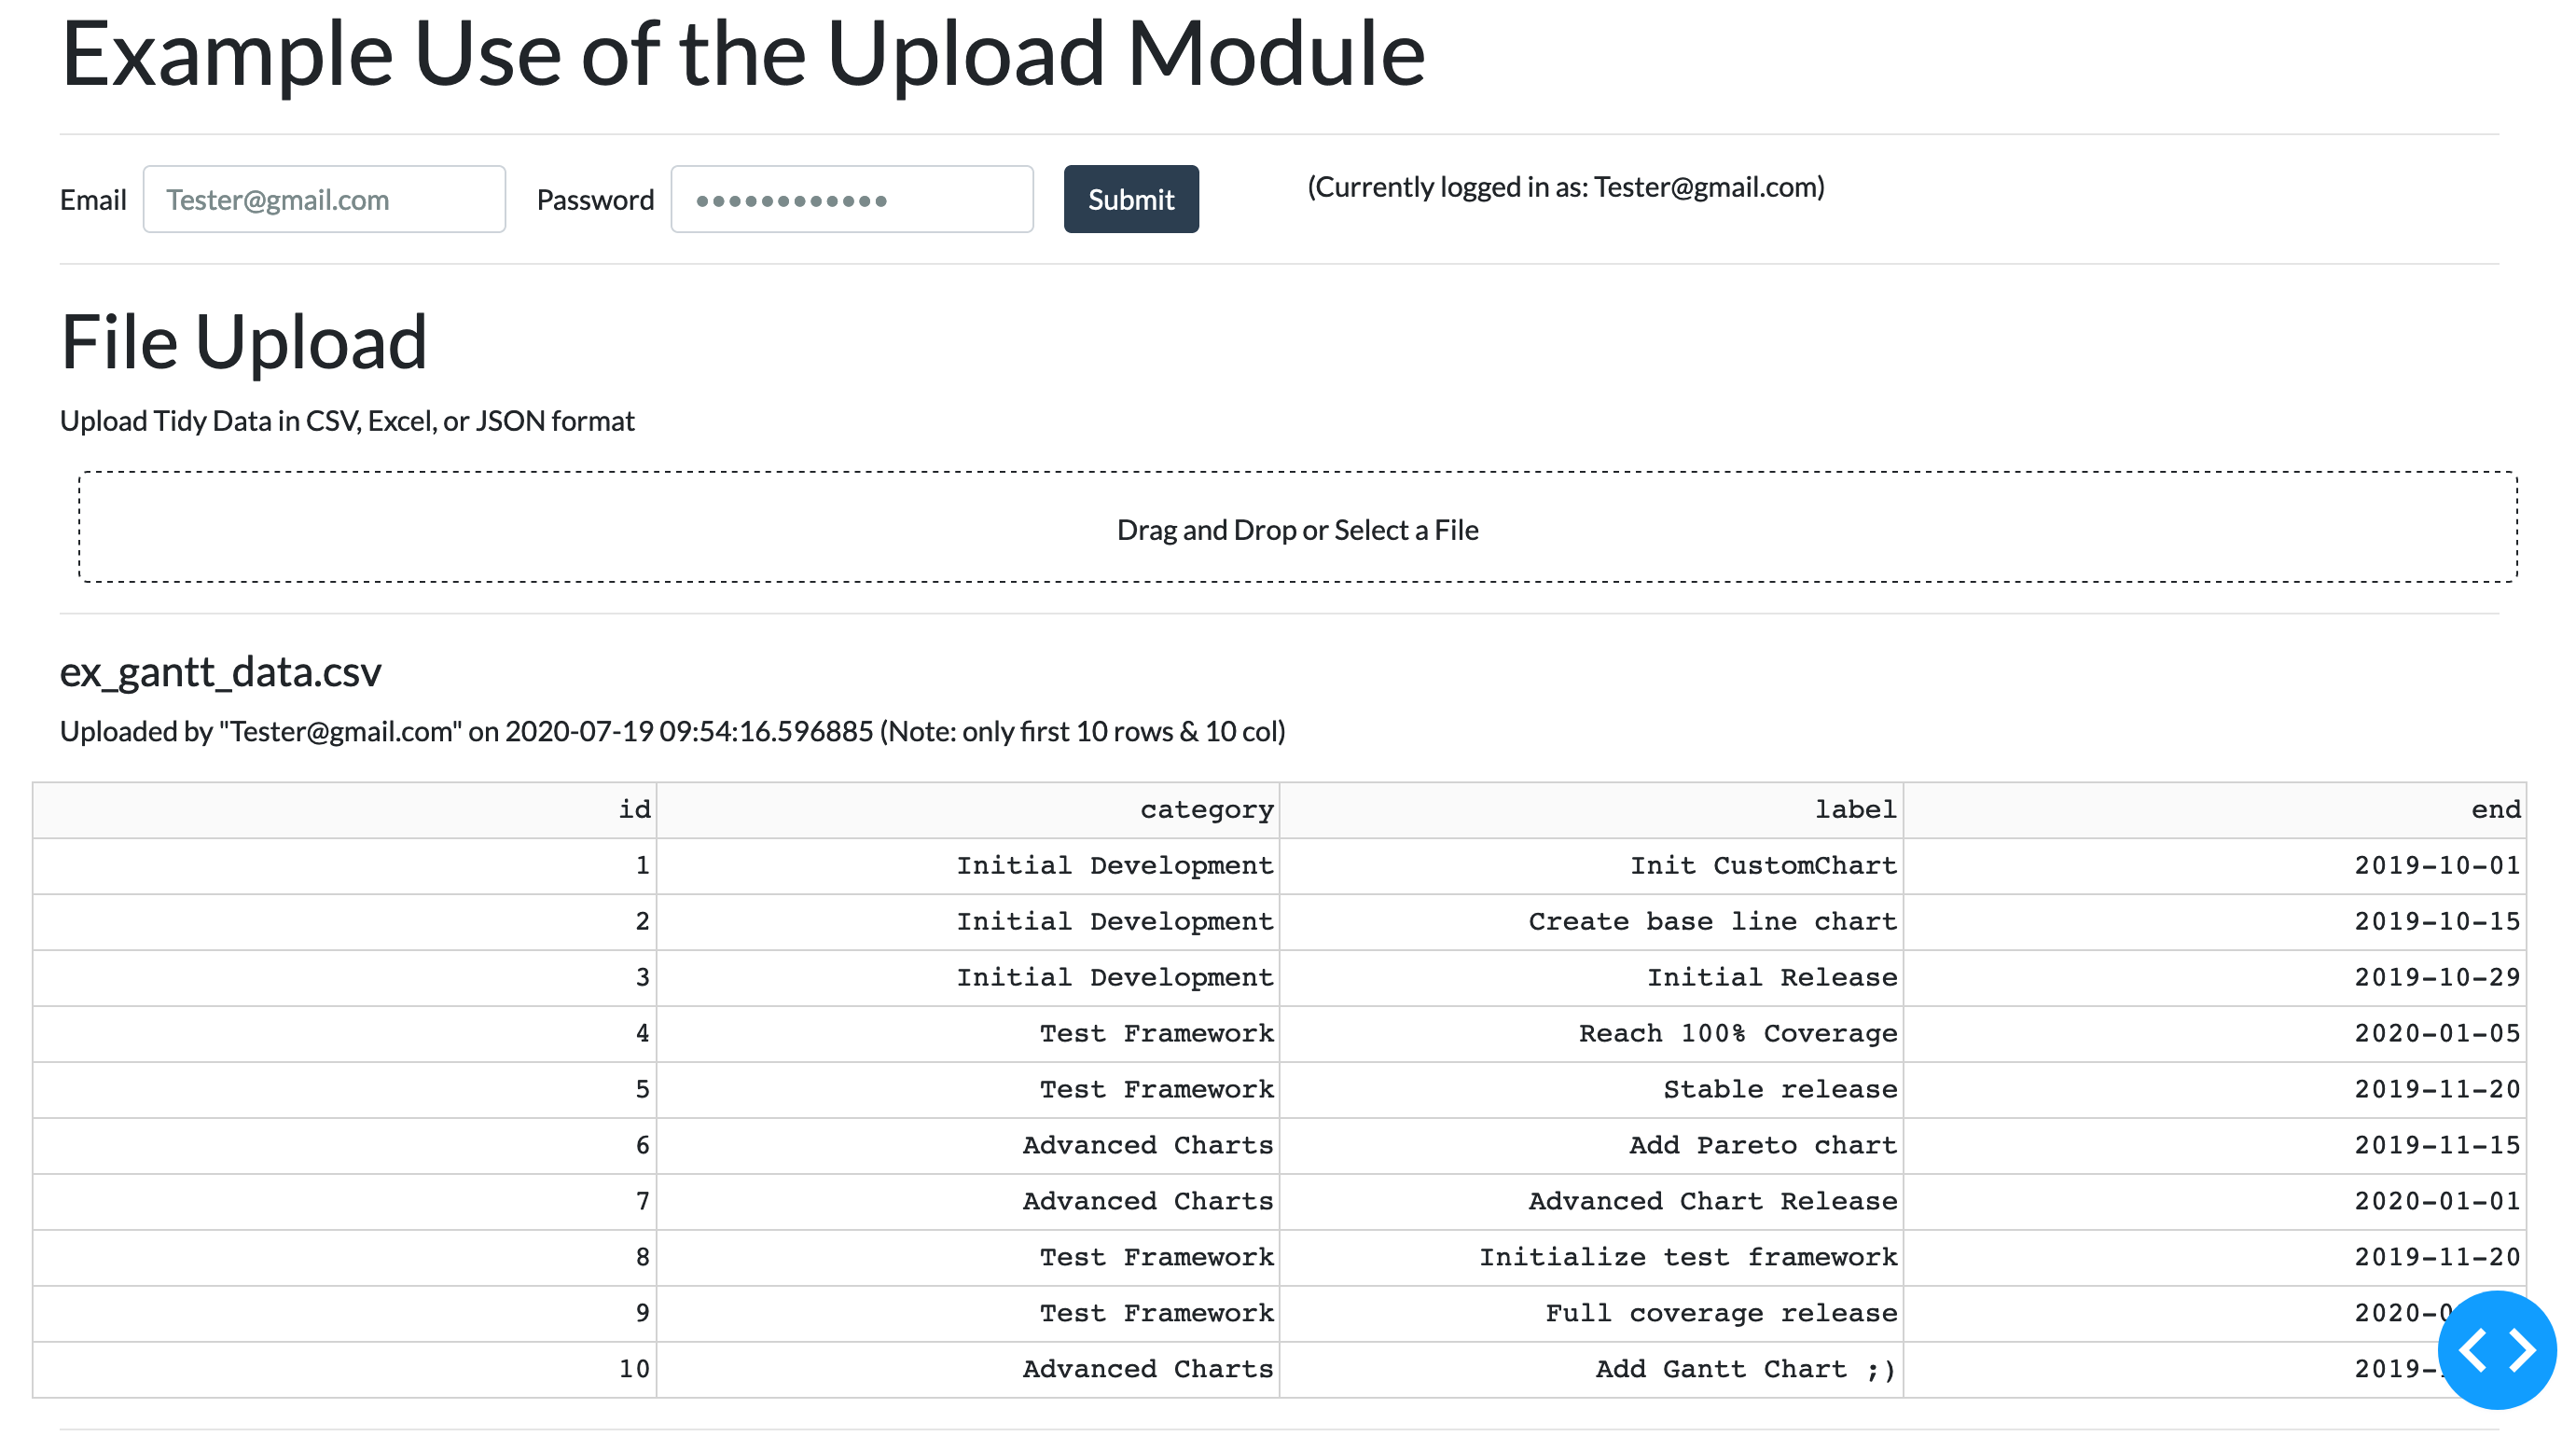
Upload Module
Upload module for user-selected CSV, JSON, or SQLite files.
See sample code in tests/examples/ex_upload.py. Screenshot below:
Applications
Every app derives from AppBase() so that each tab or page can be run independently or part of a more complicated application
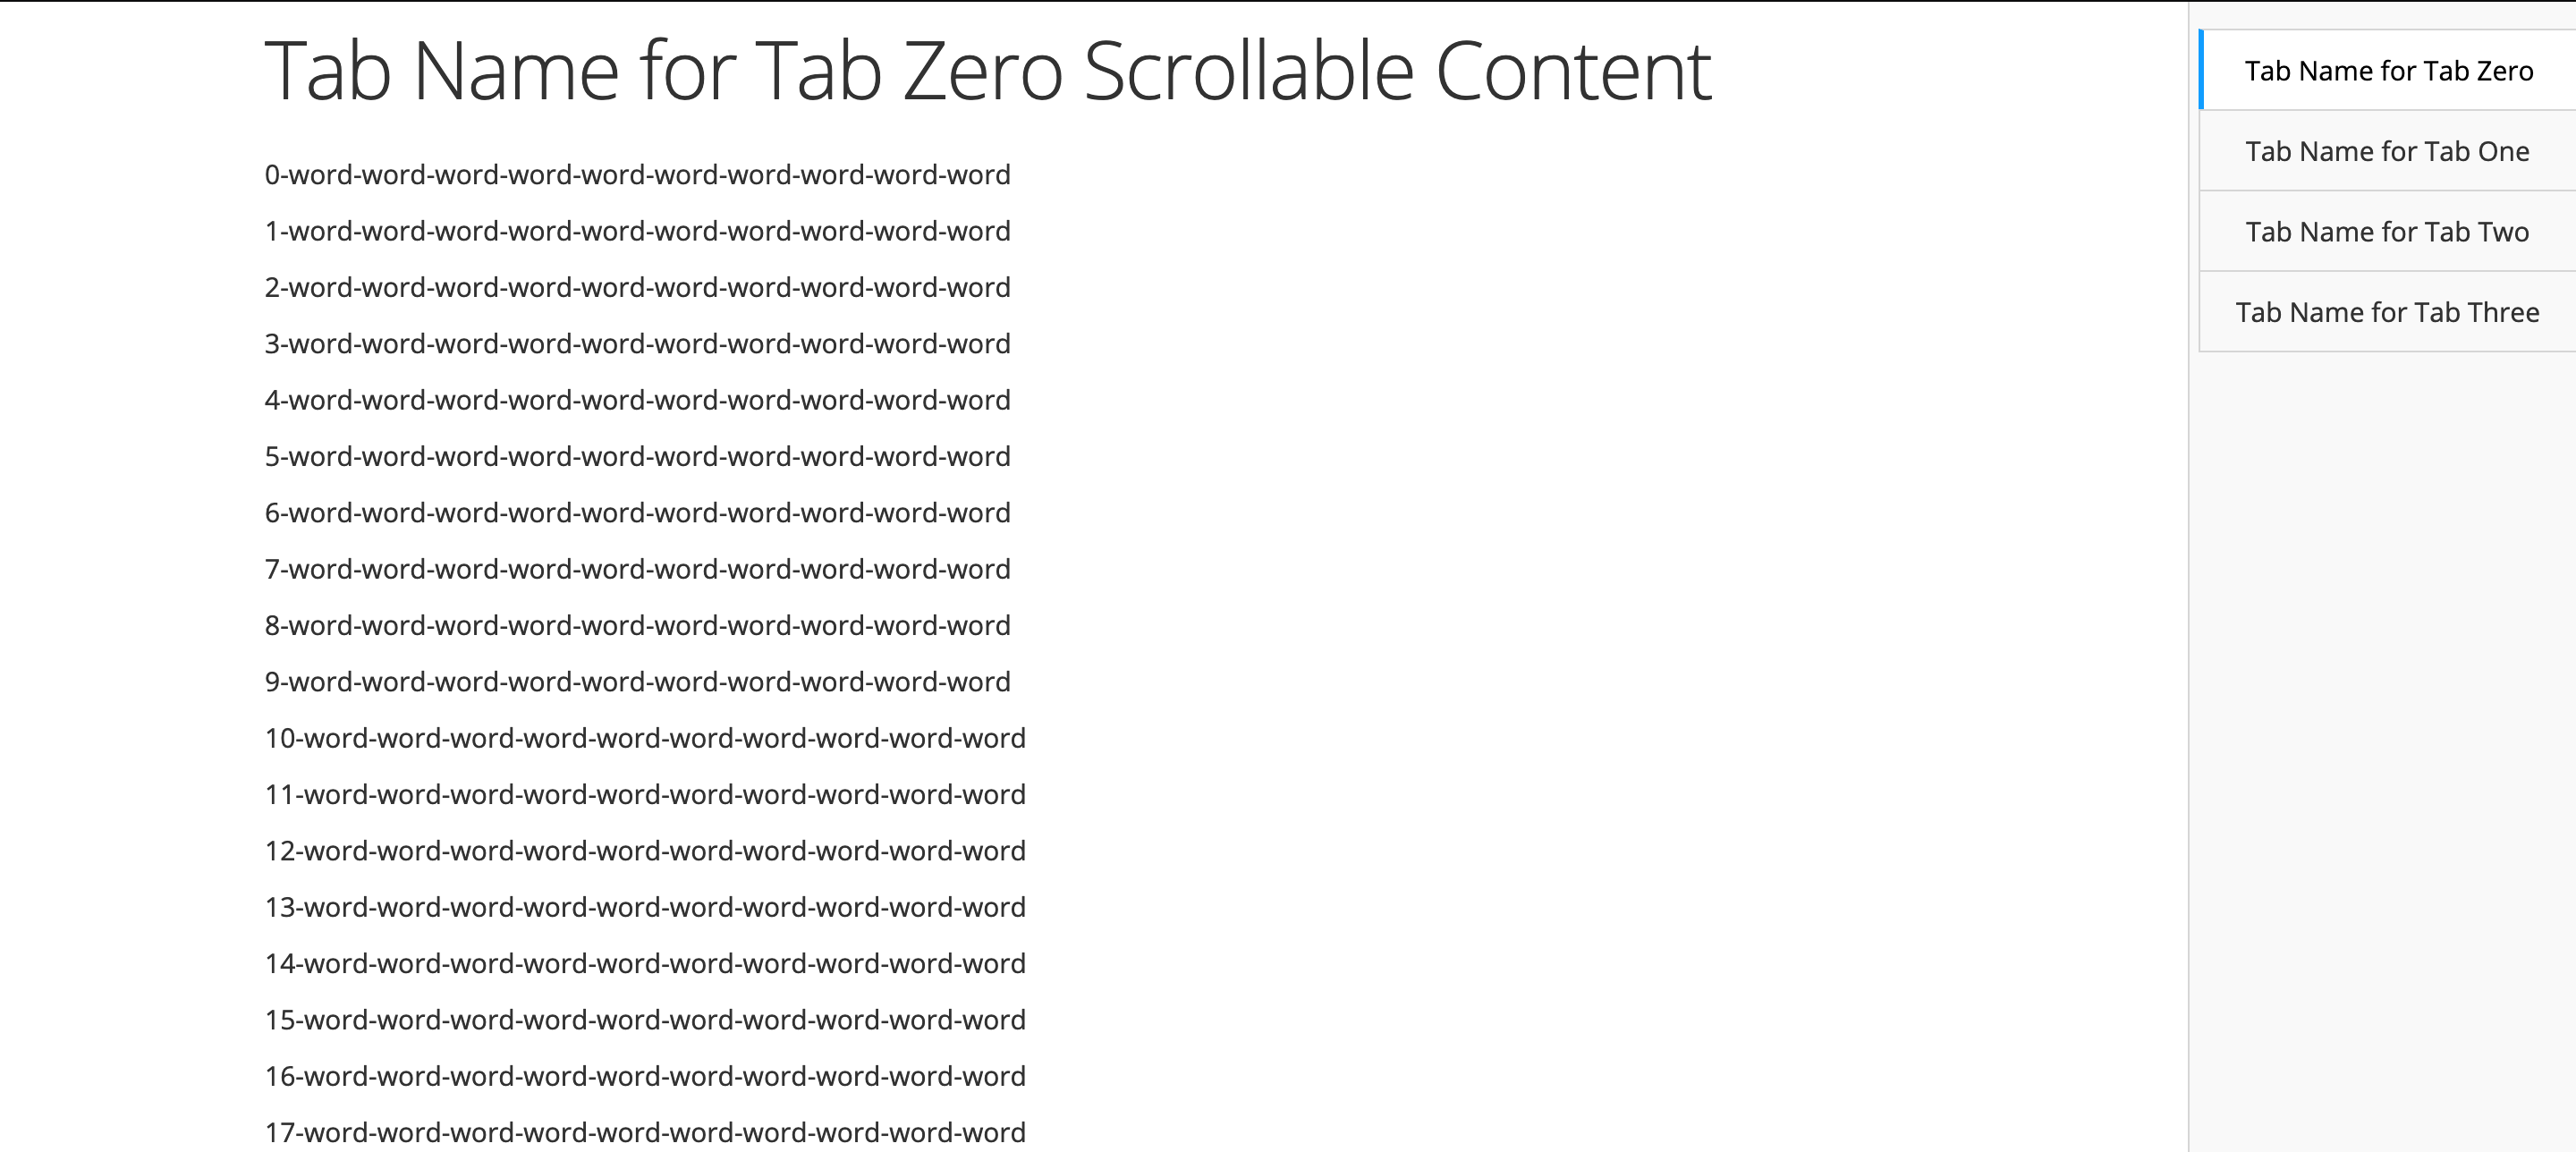
Tabbed Application
Use the AppWithTabs() base class to quickly build applications with tabbed navigation. You can set tabs to the top/bottom/left/right, to be compact or not, etc.
See sample code in tests/examples/ex_tabs.py. Screenshot below:
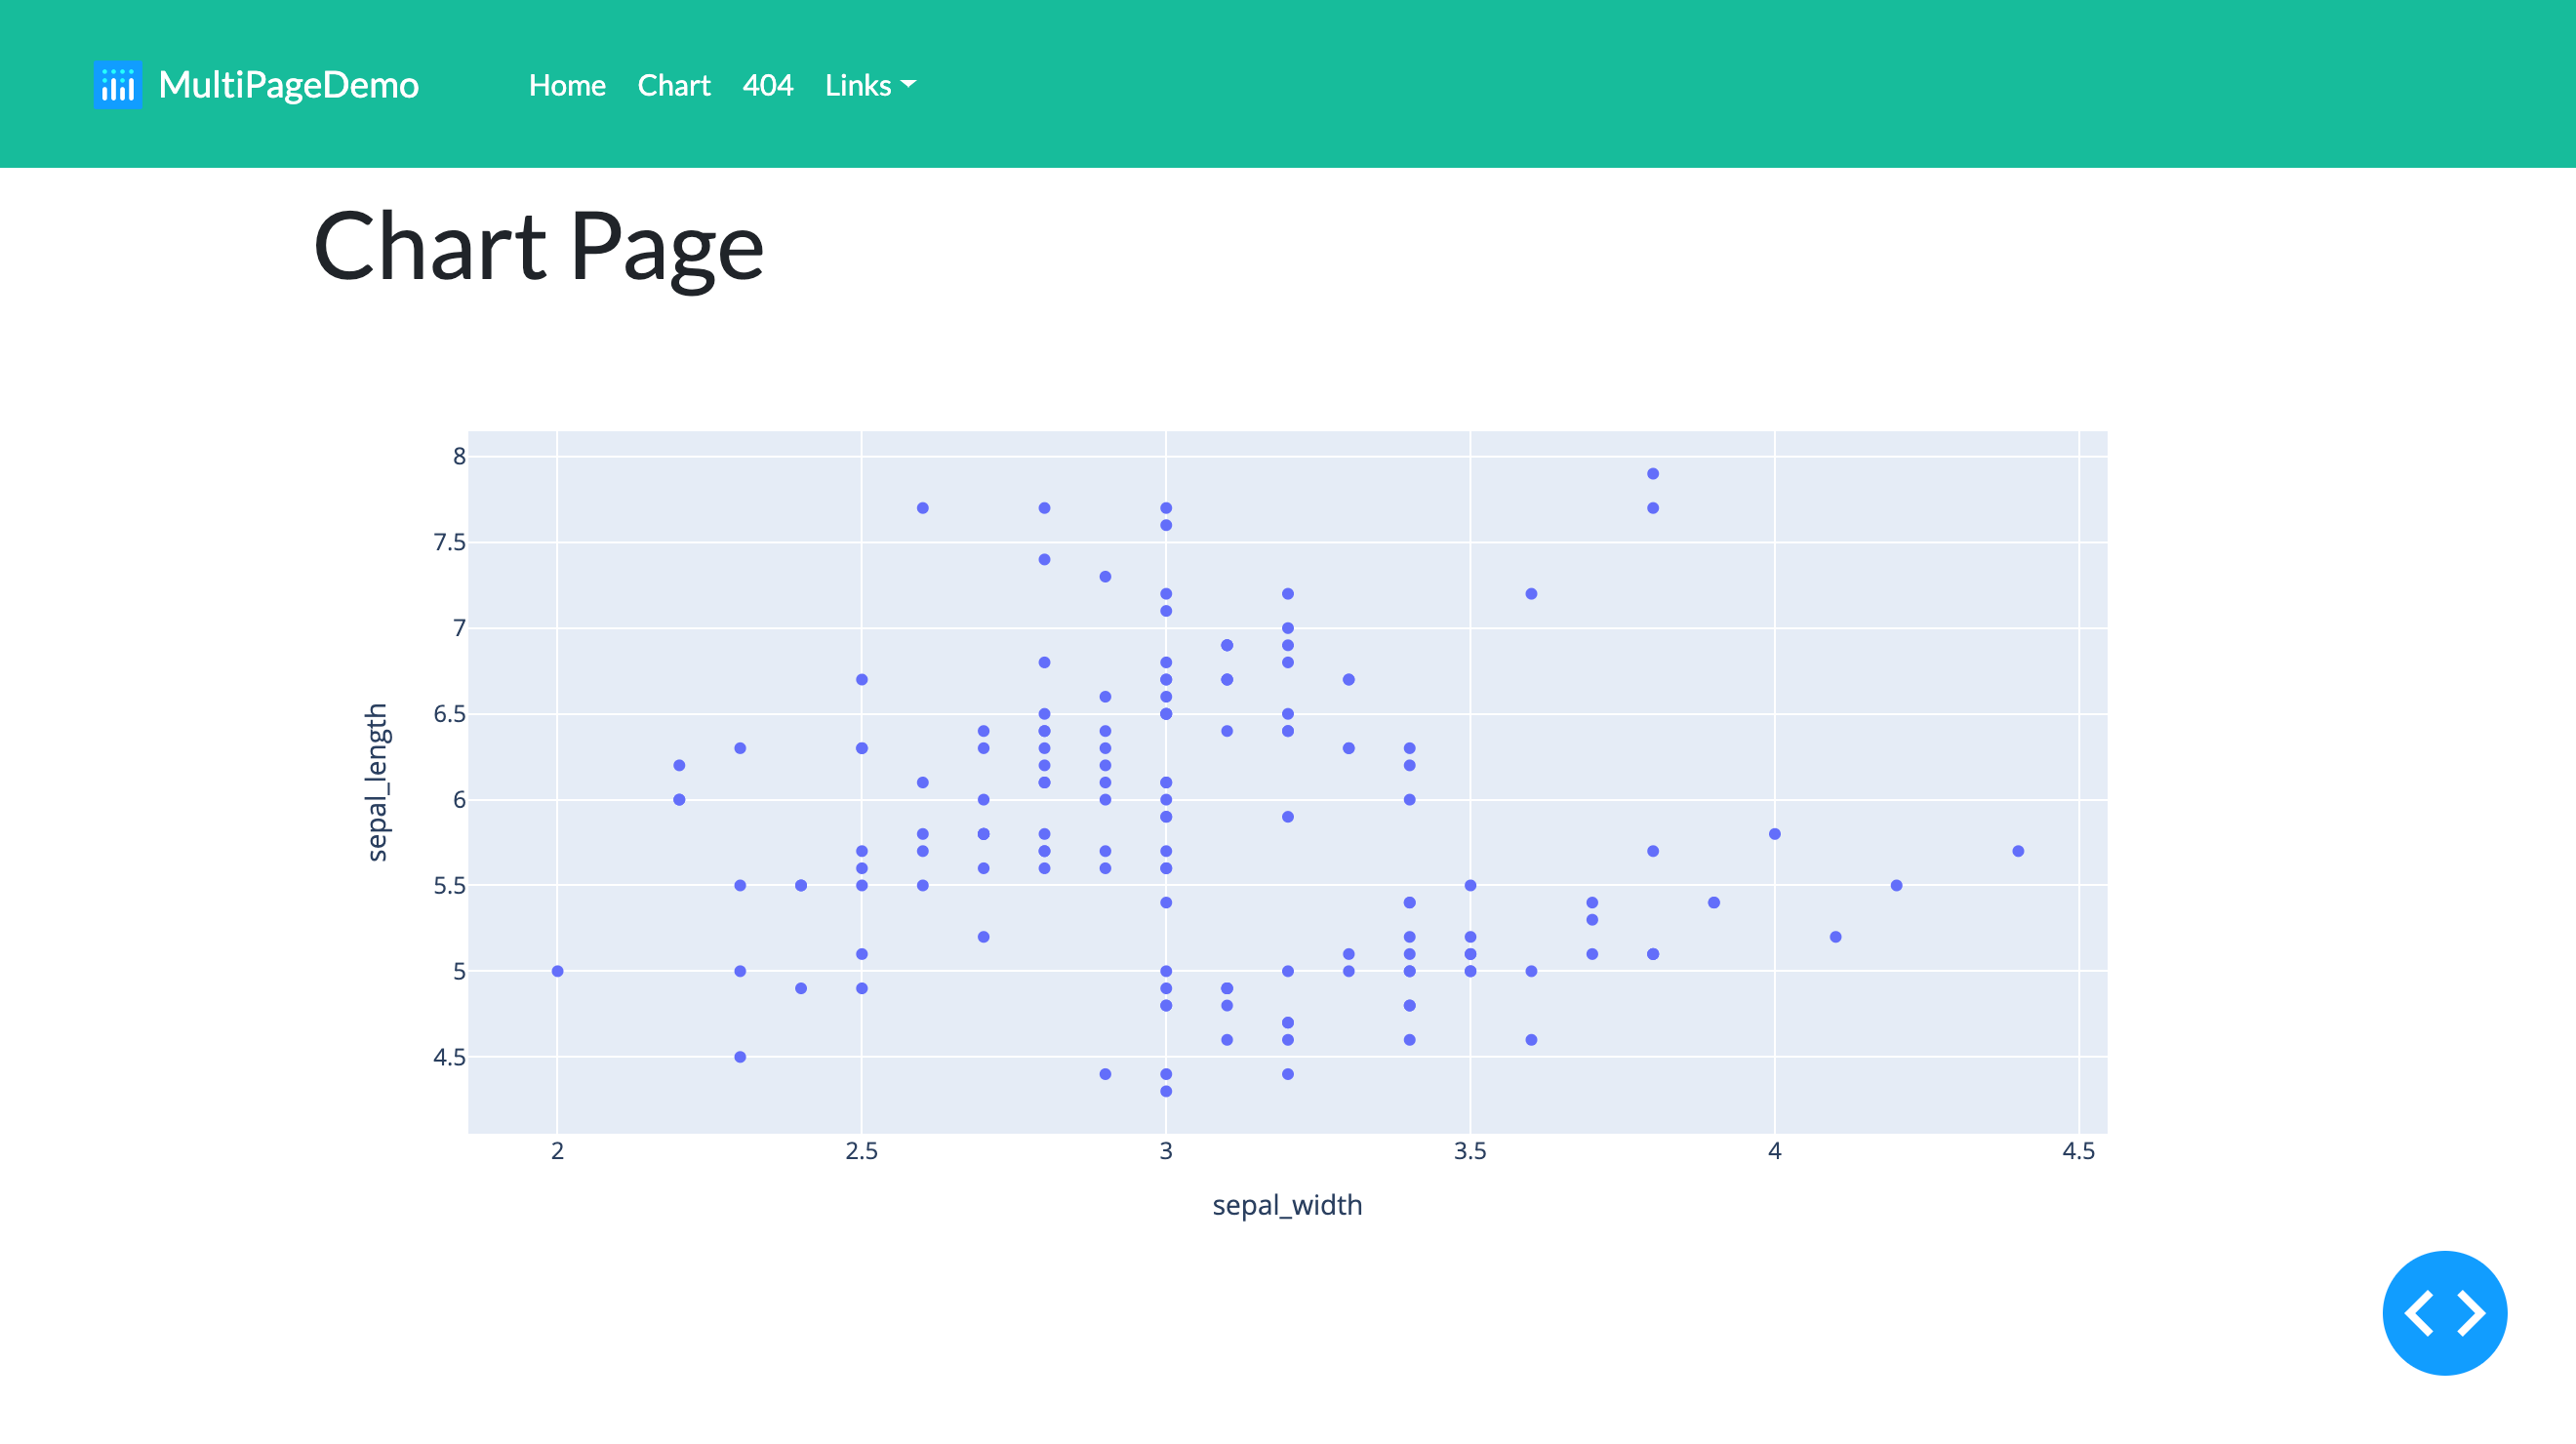
Multi-Page Application
Use the AppMultiPage() base class to quickly build applications with tabbed navigation. You can set tabs to the top/bottom/left/right, to be compact or not, etc.
See sample code in tests/examples/ex_multi_page.py. Screenshot below:
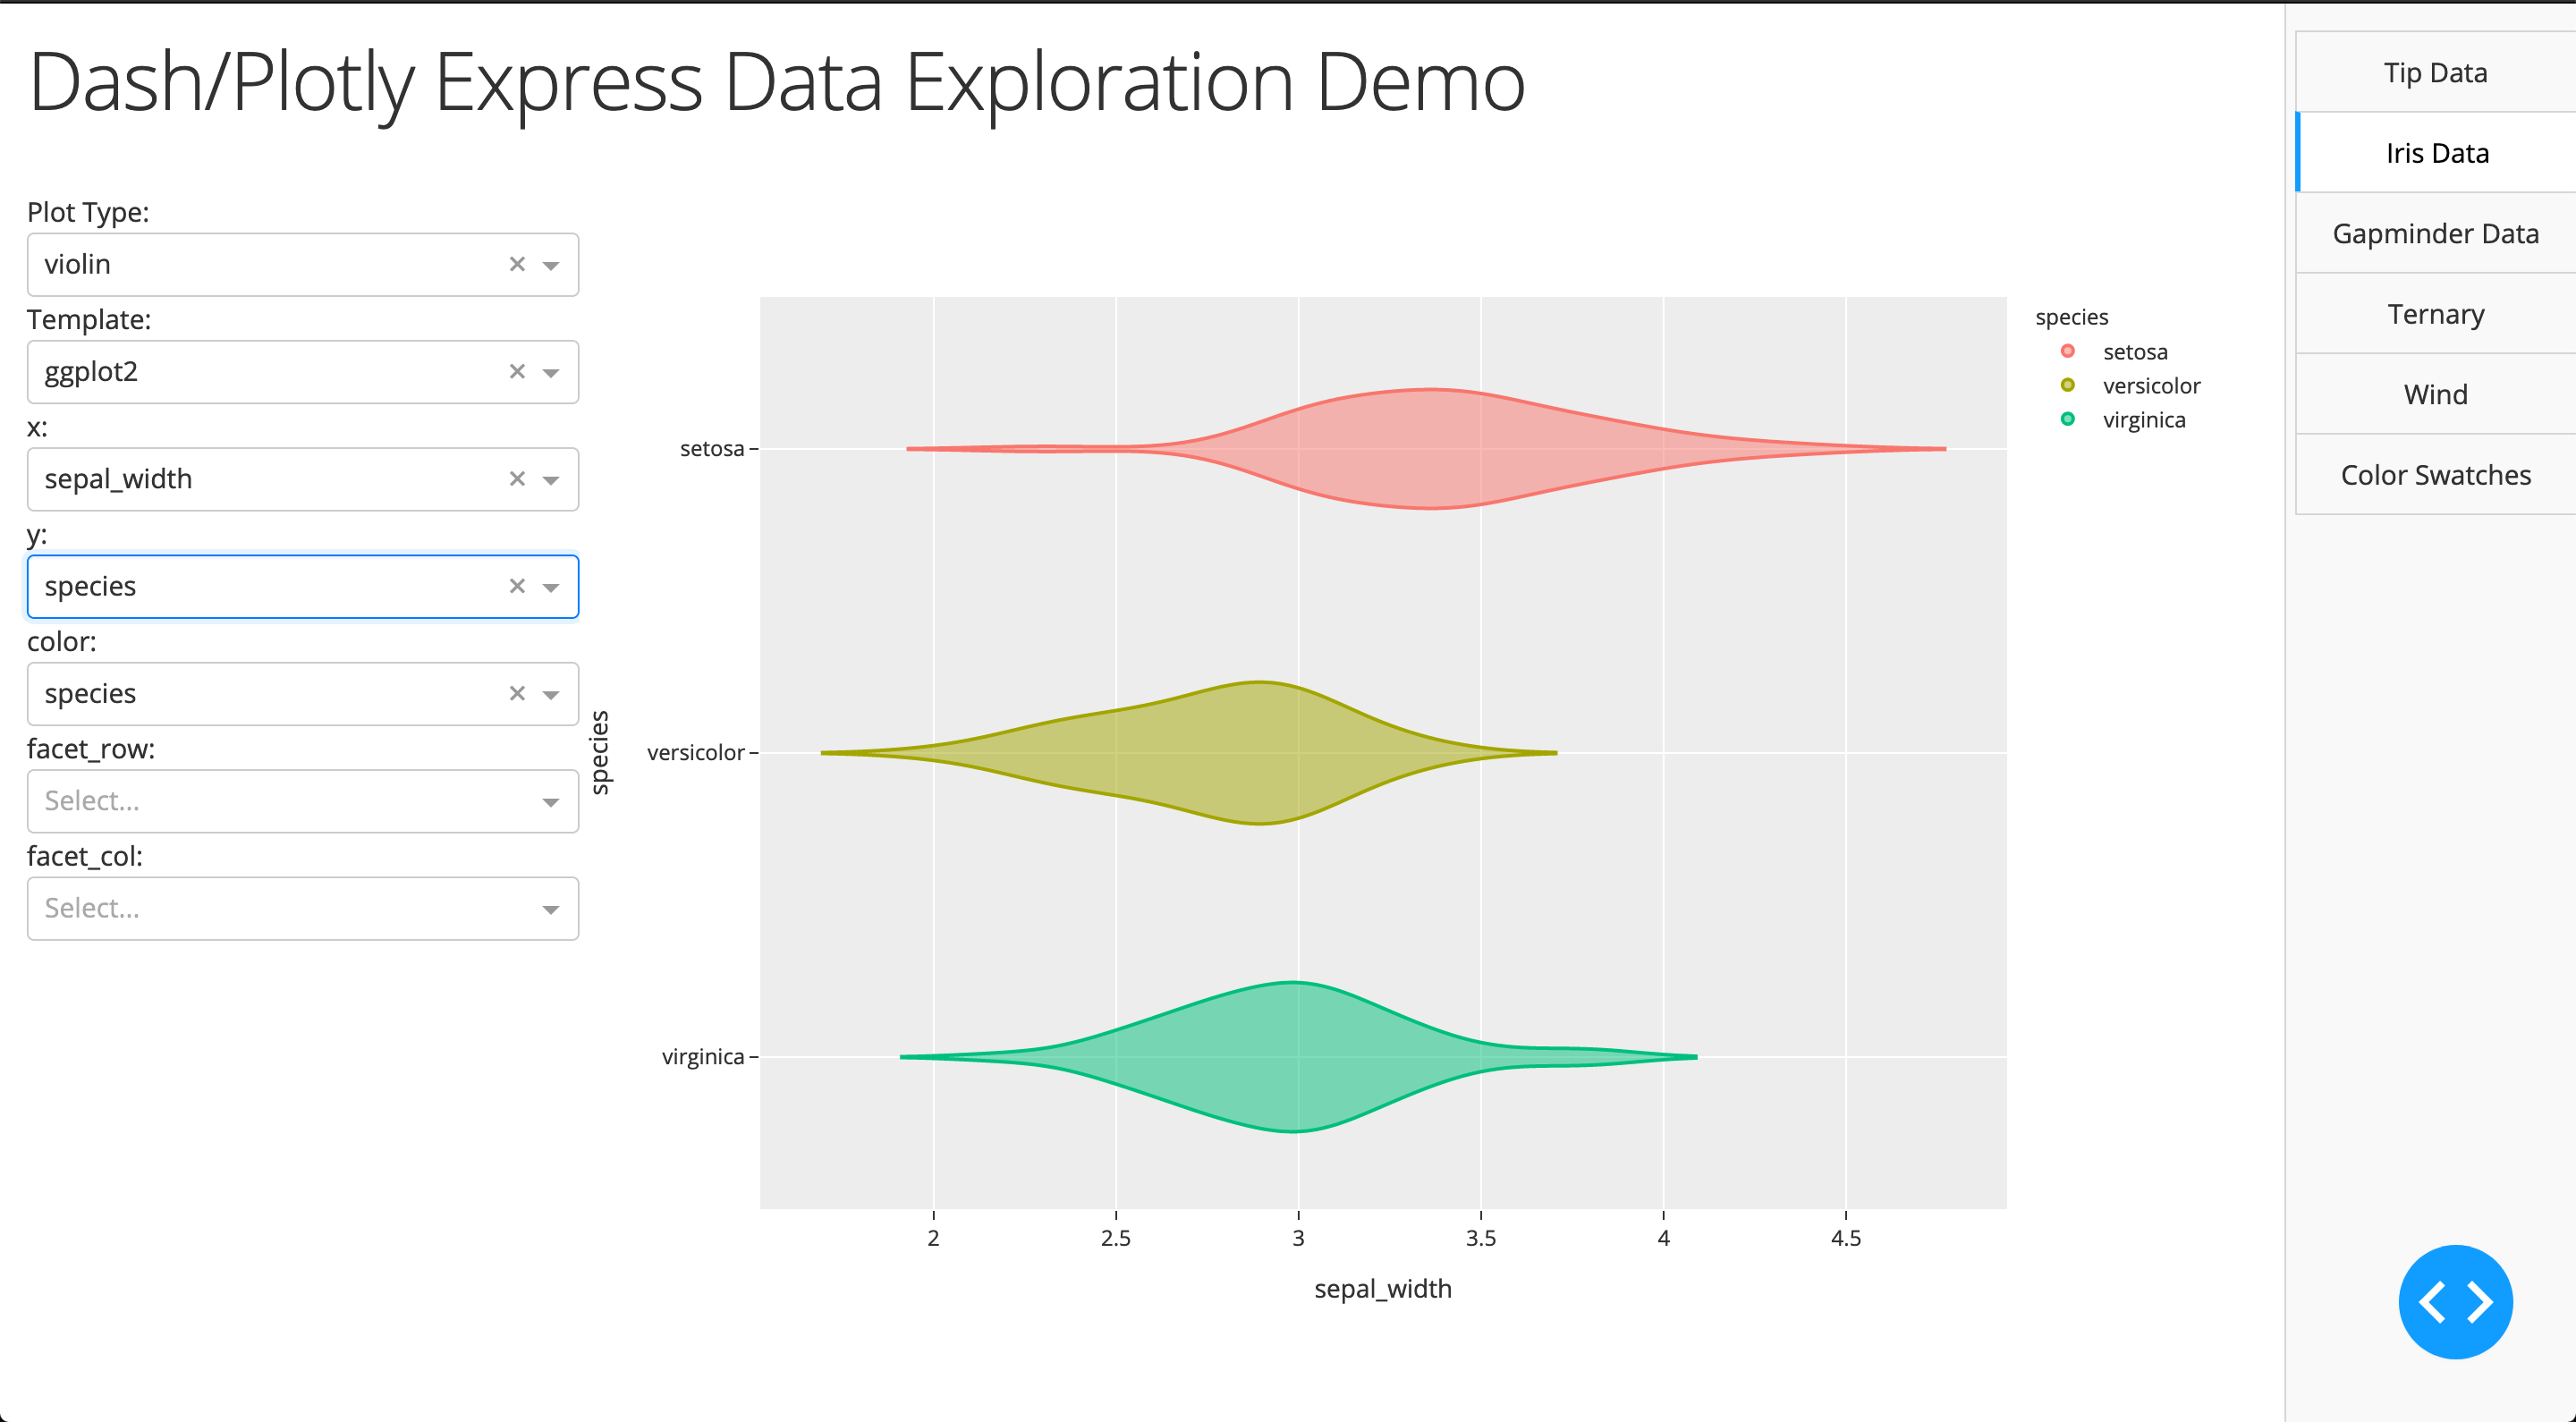
PX Generic Application
To facilitate general data analysis from a JSON, CSV, or SQLite file, dash_charts includes apps for each px plot type and a tabbed app to bring them all together.
See sample code in tests/examples/ex_app_px.py. Screenshot below:
Other
Other notable components in dash_charts
Cache
Utilities for utilizing a local cache file system for storing JSON data. Particularly useful if scraping or making many API calls to cache the responses locally.
See sample code in the relevant test file tests/test_utils_json_cache.py
Static HTML Generation
utilities for creating static HTML output with all of the CustomCharts above or user-created. Also includes utilities for writing tables, code, markdown, and more to be added.
See sample code in tests/examples/ex_utils_static.py. Screenshot below:

Coverage
Latest coverage table
| File | Statements | Missing | Excluded | Coverage |
|---|---|---|---|---|
dash_charts/__init__.py |
2 | 0 | 0 | 100.0% |
dash_charts/app_px.py |
130 | 11 | 0 | 91.5% |
dash_charts/components.py |
13 | 0 | 0 | 100.0% |
dash_charts/coordinate_chart.py |
102 | 1 | 6 | 99.0% |
dash_charts/custom_colorscales.py |
3 | 0 | 0 | 100.0% |
dash_charts/datatable.py |
79 | 25 | 0 | 68.4% |
dash_charts/equations.py |
11 | 0 | 0 | 100.0% |
dash_charts/gantt_chart.py |
54 | 0 | 0 | 100.0% |
dash_charts/modules_datatable.py |
101 | 11 | 0 | 89.1% |
dash_charts/modules_upload.py |
132 | 60 | 0 | 54.5% |
dash_charts/pareto_chart.py |
43 | 0 | 2 | 100.0% |
dash_charts/scatter_line_charts.py |
45 | 0 | 3 | 100.0% |
dash_charts/time_vis_chart.py |
61 | 0 | 0 | 100.0% |
dash_charts/utils_app.py |
98 | 14 | 6 | 85.7% |
dash_charts/utils_app_modules.py |
26 | 3 | 4 | 88.5% |
dash_charts/utils_app_with_navigation.py |
119 | 9 | 6 | 92.4% |
dash_charts/utils_callbacks.py |
34 | 6 | 0 | 82.4% |
dash_charts/utils_data.py |
63 | 1 | 0 | 98.4% |
dash_charts/utils_dataset.py |
76 | 43 | 0 | 43.4% |
dash_charts/utils_fig.py |
77 | 2 | 4 | 97.4% |
dash_charts/utils_helpers.py |
17 | 8 | 7 | 52.9% |
dash_charts/utils_json_cache.py |
51 | 10 | 0 | 80.4% |
dash_charts/utils_static.py |
111 | 5 | 0 | 95.5% |
dash_charts/utils_static_toc.py |
22 | 1 | 0 | 95.5% |
Generated on: 2020-11-08T22:46:27.420973
External Links




Useful Dash reference links
- Official Dash Docs / Plotly Docs
- Example Apps
- Pretty annotations from Market Ahead, a commercial Dash app
- Pleasant dark app from Dash-Bio, Circos
- All Dash Sample Apps
- Code Conceptual inspiration
- Best Practices
- IBM Design Language (note that v2 doesn't have documentation on visualization yet)
- Colors
- Reference
Installation
-
...
-
...
echo Hello World!
-
...
Usage
For more examples, see Scripts or Tests
Roadmap
See the Open Issues and Milestones for current status and ./docs/CODE_TAG_SUMMARY.md for annotations in the source code.
For release history, see the ./docs/CHANGELOG.md
Contributing
See the Developer Guide, Contribution Guidelines, etc
- ./docs/DEVELOPER_GUIDE.md
- ./docs/STYLE_GUIDE.md
- ./docs/CONTRIBUTING.md
- ./docs/CODE_OF_CONDUCT.md
- ./docs/SECURITY.md
License
1 maintainer

Metadata
1 maintainer
Release files for dash-charts 0.1.2
For a detailed explanation of source distributions (sdists) and built distributions (wheels), please see the package formats documentation.
Source distribution (sdist)
| File | Size | Uploaded | |
|---|---|---|---|
| dash_charts-0.1.2.tar.gz | 61.2 kB | Details |
Built distribution (wheel)
| File | Interpreter | ABI | Platform | Reset |
|---|---|---|---|---|
| dash_charts-0.1.2-py3-none-any.whl | Python 3 | none | any | Details |
Total release size: 128.9 kB
Release files / dash_charts-0.1.2.tar.gz
| Download URL | dash_charts-0.1.2.tar.gz |
|---|---|
| Size | 61.2 kB |
| Tags | Source |
|
SHA-256 checksum How to use checksums |
fbfcd253651729a77032fedc0a4f4054ae718635ec37044df27b156d6832b158
|
|
BLAKE2b-256 checksum How to use checksums |
c57daee07490e68b90590a32509f6d453d9aff1b0f4e623a313abf1fa2236cfa
|
| Upload date | |
|
Uploaded using Trusted Publishing? What is trusted publishing? |
No |
| Uploaded via |
poetry/1.1.14 CPython/3.10.5 Darwin/19.6.0
|
Release files / dash_charts-0.1.2-py3-none-any.whl
| Download URL | dash_charts-0.1.2-py3-none-any.whl |
|---|---|
| Size | 67.7 kB |
| Tags | Python 3 |
|
SHA-256 checksum How to use checksums |
537e6a1a8b823d9142905165e35c8746b87a4b8ecdcb33acdd1fb871c39202e6
|
|
BLAKE2b-256 checksum How to use checksums |
4dbe909ce8563f9dca0e1cdc10761a17902b49257ec349208ba55343a419de60
|
| Upload date | |
|
Uploaded using Trusted Publishing? What is trusted publishing? |
No |
| Uploaded via |
poetry/1.1.14 CPython/3.10.5 Darwin/19.6.0
|














