DaSy DataSynthesizer - Create synthetic data for machine learning research
Project description
dasy-ml
DaSy DataSynthesizer - Create synthetic data with desired statistical properties for machine learning research.
Quick-Start
pip install dasy-ml
Simple Usage
dasy for Classification
import numpy as np
import matplotlib.pyplot as plt
from dasy.synthesizers.gaussian import GaussianSynth
from dasy.labelers.classification.centroids import CentroidsLabeler
plt.clf()

# 1. Define the problem
dim = 2 # dimension of each input
classes = 2 # number of classes
n = 100 # number of data points
# 2. Create synthetic input data X
synth = GaussianSynth(dim=dim)
X = synth.sample(n=n) # sample n dim-dimensional data points from Gaussian
# 3. Assign labels y
labeler = CentroidsLabeler(classes=classes, dim=dim) # for 2 classes, this creates linearly separable labels
y = labeler.assign(X)
# 4. Plot
plt.scatter(X.T[0], X.T[1], c=y)
plt.title('Synthetic Classification Problem')
plt.tight_layout()
plt.show()
dasy for Regression
from dasy.synthesizers.uniform import UniformSynth
from dasy.labelers.regression.linear import LinearRegressionLabeler
plt.clf()

# 1. Define the problem
dim = 1 # dimension of each input
n = 50 # number of data points
# 2. Create synthetic input data X
synth = UniformSynth(dim=dim)
X = synth.sample(n=n) # sample n dim-dimensional data points from Uniform distribution
# 3. Assign continuous targets y
labeler = LinearRegressionLabeler(dim=dim)
y = labeler.assign(X)
# 4. Plot
plt.scatter(X.T[0], y)
plt.axline((0, labeler.b), slope=labeler.w, color='r') # plot the underlying line which generated the targets
plt.title('Synthetic Regression Problem')
plt.tight_layout()
plt.show()
Developers
git clone https://github.com/bkestelman/dasy-ml
cd dasy-ml
pip install -e .
python -m unittest
Introduction
When researching machine learning algorithms, we often want to know how they behave on data with specific properties. For example: linearly separable, correlated, isotropic, etc. This library aims to provide functionality to construct synthetic datasets with any desired statistical properties, so researchers can easily study how algorithms respond to different types of data.
Why is this useful for machine learning research compared to using existing datasets?
- Existing datasets may lack certain statistical properties you want to test your algorithm against.
- You may not have enough information about where an existing dataset comes from. For example, is it IID?
- You may want to test against many different types of data.
- You may want to arbitrarily adjust the size of the dataset.
Note: this is not a library for adding synthetic data to an existing dataset - there are already many other libraries that do this.
Examples
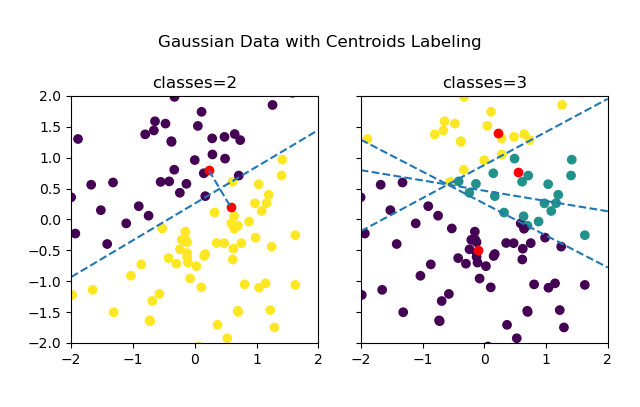
Above, the input X data is simply sampled from a Gaussian centered at the origin. Then, the data is labeled by creating random centroids and labeling each point according to its nearest centroid (similar to the first step in k-means). On the left with only 2 classes, the classes are linearly separable. With 3 or more classes, they are no longer linearly separable and the boundaries essentially form a Voronoi diagram.
DataSynthesizers and Labelers
The core of synthetic-data are DataSynthesizers and Labelers.
DataSynthesizers sample inputs X from the feature-space.
Labelers take inputs X and assign labels y to them.
These are very general classes. The procedure for creating X typically involves sampling from some probability distribution. Assigning labels may be a deterministic or probabilistic function. Each x or y may be sampled independently or it may not be, for example if created by a Markov process.
A DataSynthesizer may also assign labels directly to its own data if you want to couple the label distribution with the input distribution.
Discussion of Kinds of Data
Independent vs. Non-Independent Data
Time-Series Data
Data for Classification Problems
Deterministic vs. Probabilistic Labels
If for any given input x, the label must always be a specific value, then the labels are deterministic. In other words, the label y=f(x), where f is a pure function. Typically, y is encoded as a one-hot vector.
On the other hand, if a given input x may be assigned different labels, then labels are probabilistic. Here, y is drawn from the possible classes according to some probability distribution p(x), representing the probability of each class for the given input.
Theoretically, it is possible to achieve 100% accuracy on a deterministic classification problem. This is impossible in a probabilistic classification problem.
Noisy Labels
Linearly Separable Data
Data for Regression Problems
Project details
Release history Release notifications | RSS feed
Download files
Download the file for your platform. If you're not sure which to choose, learn more about installing packages.


