


|





|

|

|

|



|

|


|
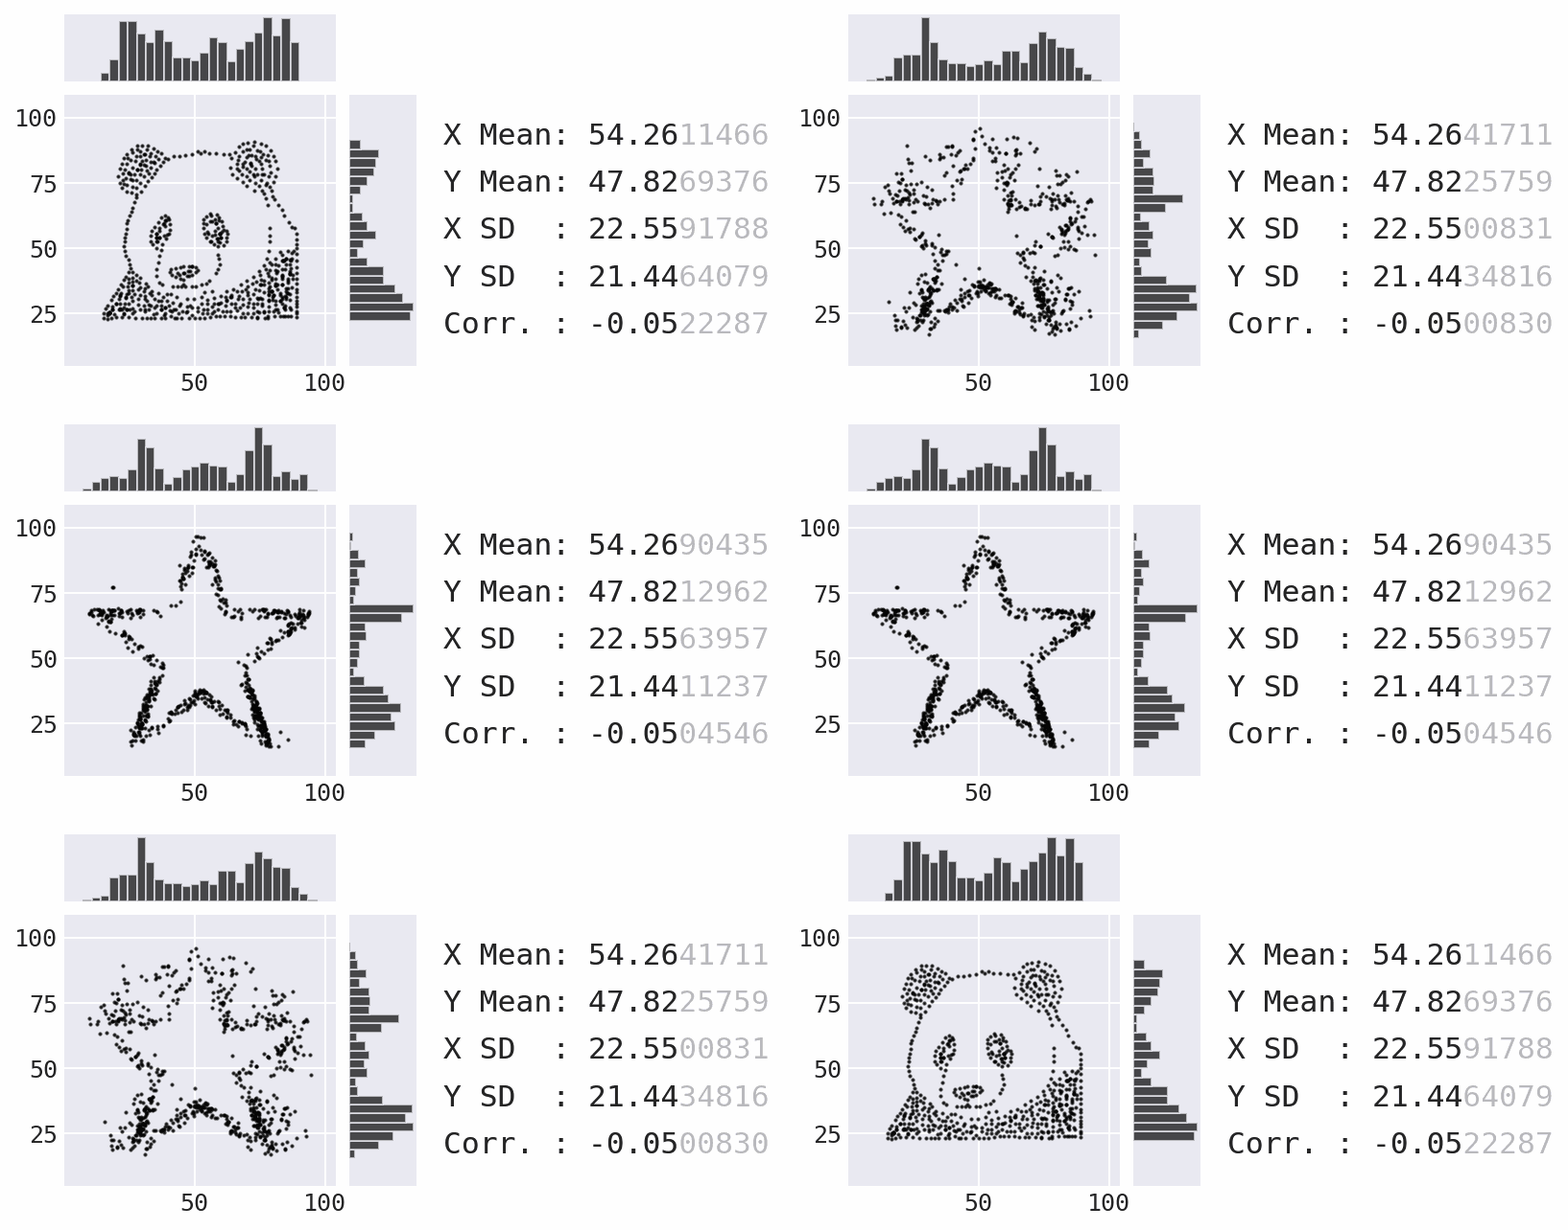
Data Morph transforms an input dataset of 2D points into select shapes, while preserving the summary statistics to a given number of decimal points through simulated annealing. It is intended to be used as a teaching tool to illustrate the importance of data visualization (see the Data Morph in the Classroom section for ideas).
Installation
Data Morph can be installed from PyPI using pip:
$ python -m pip install data-morph-ai
Alternatively, Data Morph can be installed with conda by specifying the conda-forge channel:
$ conda install -c conda-forge data-morph-ai
Usage
Once installed, Data Morph can be used on the command line or as an importable Python package. Below are some examples; be sure to check out the documentation for more information.
Command Line Usage
Run data-morph on the command line:
$ data-morph --start panda --target star
This produces the animation in the newly-created morphed_data directory within your current working directory (shown above). More examples, including how to run multiple transformations in parallel, can be found in the documentation.
See all available CLI options by passing in --help or consulting the CLI reference in the documentation:
$ data-morph --help
Python Usage
The DataMorpher class performs the morphing from a Dataset to a Shape. Any pandas.DataFrame with numeric columns x and y can be a Dataset. Use the DataLoader to create the Dataset from a file or use a built-in dataset:
from data_morph.data.loader import DataLoader

dataset = DataLoader.load_dataset('panda')
For morphing purposes, all target shapes are placed/sized based on aspects of the Dataset class.
All shapes are accessible via the ShapeFactory class:
from data_morph.shapes.factory import ShapeFactory

shape_factory = ShapeFactory(dataset)
target_shape = shape_factory.generate_shape('star')
With the Dataset and Shape created, here is a minimal example of morphing:
from data_morph.morpher import DataMorpher

morpher = DataMorpher(
    decimals=2,
    in_notebook=False,  # whether you are running in a Jupyter Notebook
    output_dir='data_morph/output',
)

result = morpher.morph(start_shape=dataset, target_shape=target_shape)
Note that the result variable in the above code block is a pandas.DataFrame of the data after completing the specified iterations of the simulated annealing process. The DataMorpher.morph() method is also saving plots to visualize the output periodically and make an animation; these end up in data_morph/output, which we set as DataMorpher.output_dir.
In this example, we morphed the built-in panda Dataset into the star Shape. Be sure to try out the other built-in options:
-
The
DataLoader.AVAILABLE_DATASETSattribute contains a list of available datasets, which are also visualized in theDataLoaderdocumentation here. -
The
ShapeFactory.AVAILABLE_SHAPESattribute contains a list of available shapes, which are also visualized in theShapeFactorydocumentation here.
Data Morph in the Classroom
Data Morph is intended to be used as a teaching tool to illustrate the importance of data visualization. Here are some potential classroom activities for instructors:
- Statistics Focus: Have students pick one of the built-in datasets, and morph it into all available target shapes. Ask students to comment on which transformations worked best and why.
- Creativity Focus: Have students create a new dataset (e.g., your school logo or something that the student designs), and morph that into multiple target shapes. Ask students to comment on which transformations worked best and why.
- Math and Coding Focus: Have students create a custom shape by inheriting from
LineCollectionorPointCollection, and try morphing a couple of the built-in datasets into that shape. Ask students to explain how they chose to calculate the shape, and comment on which transformations worked best and why.
If you end up using Data Morph in your classroom, I would love to hear about it. Please send me a message detailing how you used it and how it went.
Acknowledgements
This code has been altered by Stefanie Molin (@stefmolin) to work for other input datasets by parameterizing the target shapes with information from the input shape. The original code works for a specific dataset called the "Datasaurus" and was created for the paper Same Stats, Different Graphs: Generating Datasets with Varied Appearance and Identical Statistics through Simulated Annealing by Justin Matejka and George Fitzmaurice (ACM CHI 2017).
The paper and video can be found on the Autodesk Research website here. The version of the code placed on GitHub at jmatejka/same-stats-different-graphs, served as the starting point for the Data Morph codebase, which is on GitHub at stefmolin/data-morph.
Read more about the creation of Data Morph here and here.
Citations
If you use this software, please cite both Data Morph (DOI: 10.5281/zenodo.7834197) and Same Stats, Different Graphs: Generating Datasets with Varied Appearance and Identical Statistics through Simulated Annealing by Justin Matejka and George Fitzmaurice (ACM CHI 2017).
Contributing
Please consult the contributing guidelines.
1 maintainer

Metadata
1 maintainer
Release files for data-morph-ai 0.4.0
For a detailed explanation of source distributions (sdists) and built distributions (wheels), please see the package formats documentation.
Source distribution (sdist)
| File | Size | Uploaded | |
|---|---|---|---|
| data_morph_ai-0.4.0.tar.gz | 12.6 MB | Details |
Built distribution (wheel)
| File | Interpreter | ABI | Platform | Reset |
|---|---|---|---|---|
| data_morph_ai-0.4.0-py3-none-any.whl | Python 3 | none | any | Details |
Total release size: 12.8 MB
Release files / data_morph_ai-0.4.0.tar.gz
| Download URL | data_morph_ai-0.4.0.tar.gz |
|---|---|
| Size | 12.6 MB |
| Tags | Source |
|
SHA-256 checksum How to use checksums |
0f5c19d28e77eac05cb09f6fe6cb034234be82e915644dcf19bdb8c1840ef20c
|
|
BLAKE2b-256 checksum How to use checksums |
5a4bdef9311ba7479e02f6deb7c91ce6b01c63f4d9a5a05f18d5460bd681fe3b
|
| Upload date | |
|
Uploaded using Trusted Publishing? What is trusted publishing? |
Yes |
| Uploaded via |
twine/6.1.0 CPython/3.13.13
|
Provenance
Provenance describes where a file came from. On PyPI, provenance is shared via attestations, which provide a verifiable record of the build or publishing details. View details, limitations and caveats.


PyPI Publish Attestation
PyPI verified that this artifact, at this checksum, originated from the publisher listed below.
Signed by GitHub Actions, verified by PyPI on Sep 27, 2026.
Transparency logRelease files / data_morph_ai-0.4.0-py3-none-any.whl
| Download URL | data_morph_ai-0.4.0-py3-none-any.whl |
|---|---|
| Size | 166.0 kB |
| Tags | Python 3 |
|
SHA-256 checksum How to use checksums |
204581ce3981c7b9c696dfc2463b28869654ec09fe30309fc34cfa2b65c2667f
|
|
BLAKE2b-256 checksum How to use checksums |
aae0a3134e3a6368114e5ab98adab680357f58abebc7dd74bf6f78dd0d4ba91e
|
| Upload date | |
|
Uploaded using Trusted Publishing? What is trusted publishing? |
Yes |
| Uploaded via |
twine/6.1.0 CPython/3.13.13
|
Provenance
Provenance describes where a file came from. On PyPI, provenance is shared via attestations, which provide a verifiable record of the build or publishing details. View details, limitations and caveats.
PyPI Publish Attestation
PyPI verified that this artifact, at this checksum, originated from the publisher listed below.
Signed by GitHub Actions, verified by PyPI on Sep 27, 2026.
Transparency log













