
DataDiver
A native desktop app for fast data exploration and quick lookups. Open a data file, search and filter rows, build a pivot, etc.
DataDiver is built in Rust with GPUI Kit and DuckDB. The focus is an efficient, enjoyable workflow: responsive tables, keyboard commands, and reusable views.
- Features
- Install
- A typical workflow
- Keyboard shortcuts
- Opening data
- Search
- Slicers
- Filters and drill-down
- Group By, Pivot By, and aggregations
- Working with the grid
- Copy and export
- SQL editor
- Ask AI for SQL
- View actions
- History and undo
- Customization
- Command-line options
- File formats and local storage
- Build from source
- Development
Features
- Open local data: CSV, TSV, Excel (
.xlsx), and Parquet. Add whole folders, paste a table from the clipboard, drop files on the window, or attach a DuckDB database. - Browse the database: a sidebar tree of saved views, imported files, database tables and views, attached databases, and source folders.
- Explore tables: search with a small query language, sort, filter with slicer cards, freeze and hide columns, and inspect selection statistics.
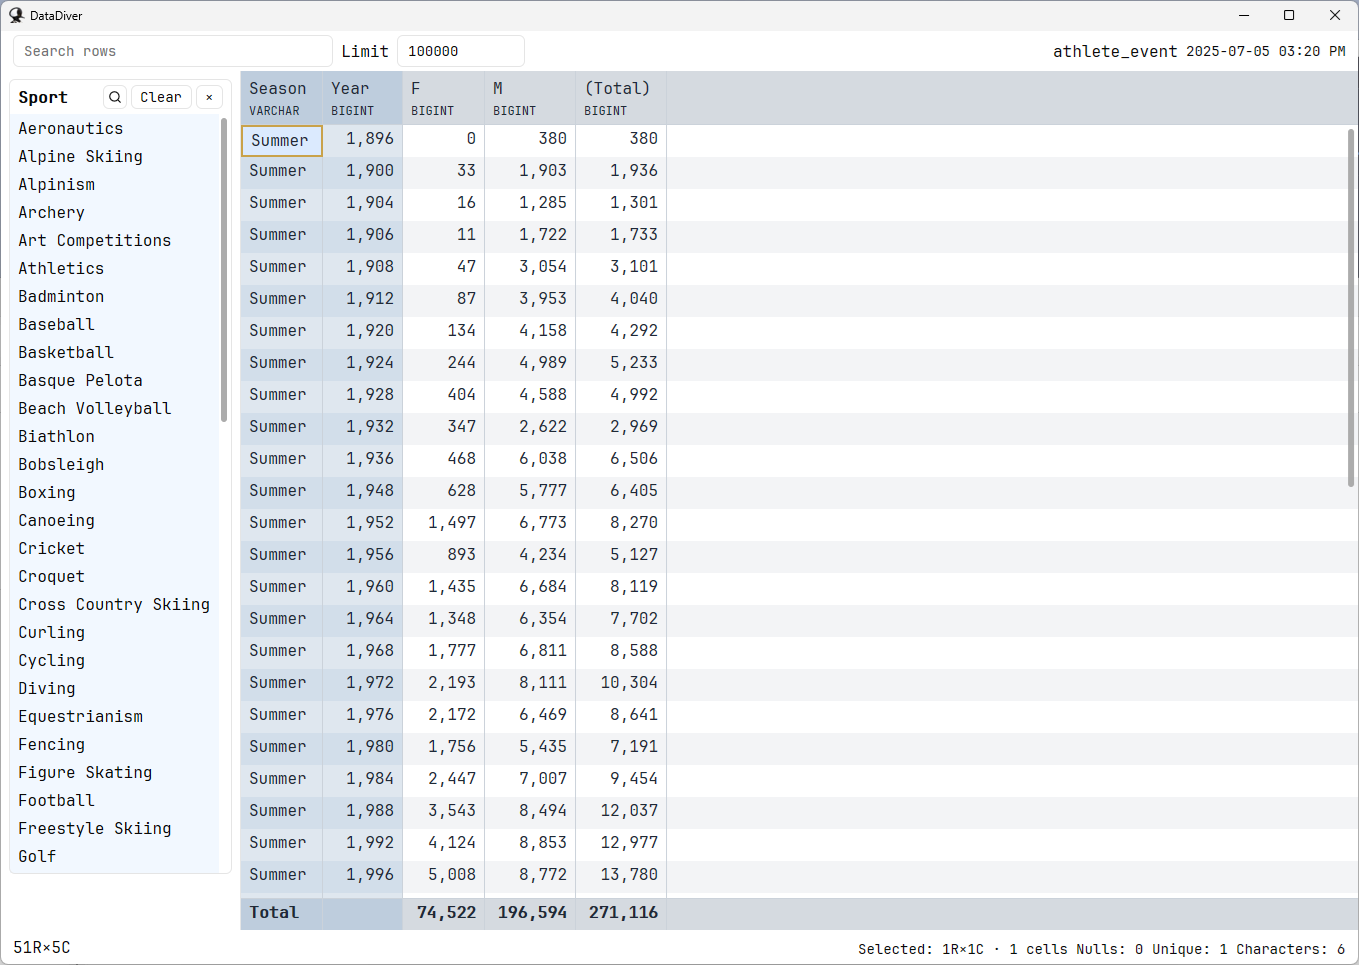
- Build pivots: group by columns or SQL expressions, pivot by dimensions, and aggregate with count, sum, mean, median, minimum, maximum, or any DuckDB aggregate. Add grand totals and a heat map.
- Drill down: press Enter on a pivot cell to see the source rows behind it.
- Write SQL: a SQL editor with highlighting, table, column, and file path completion, saved SQL views, and a startup script.
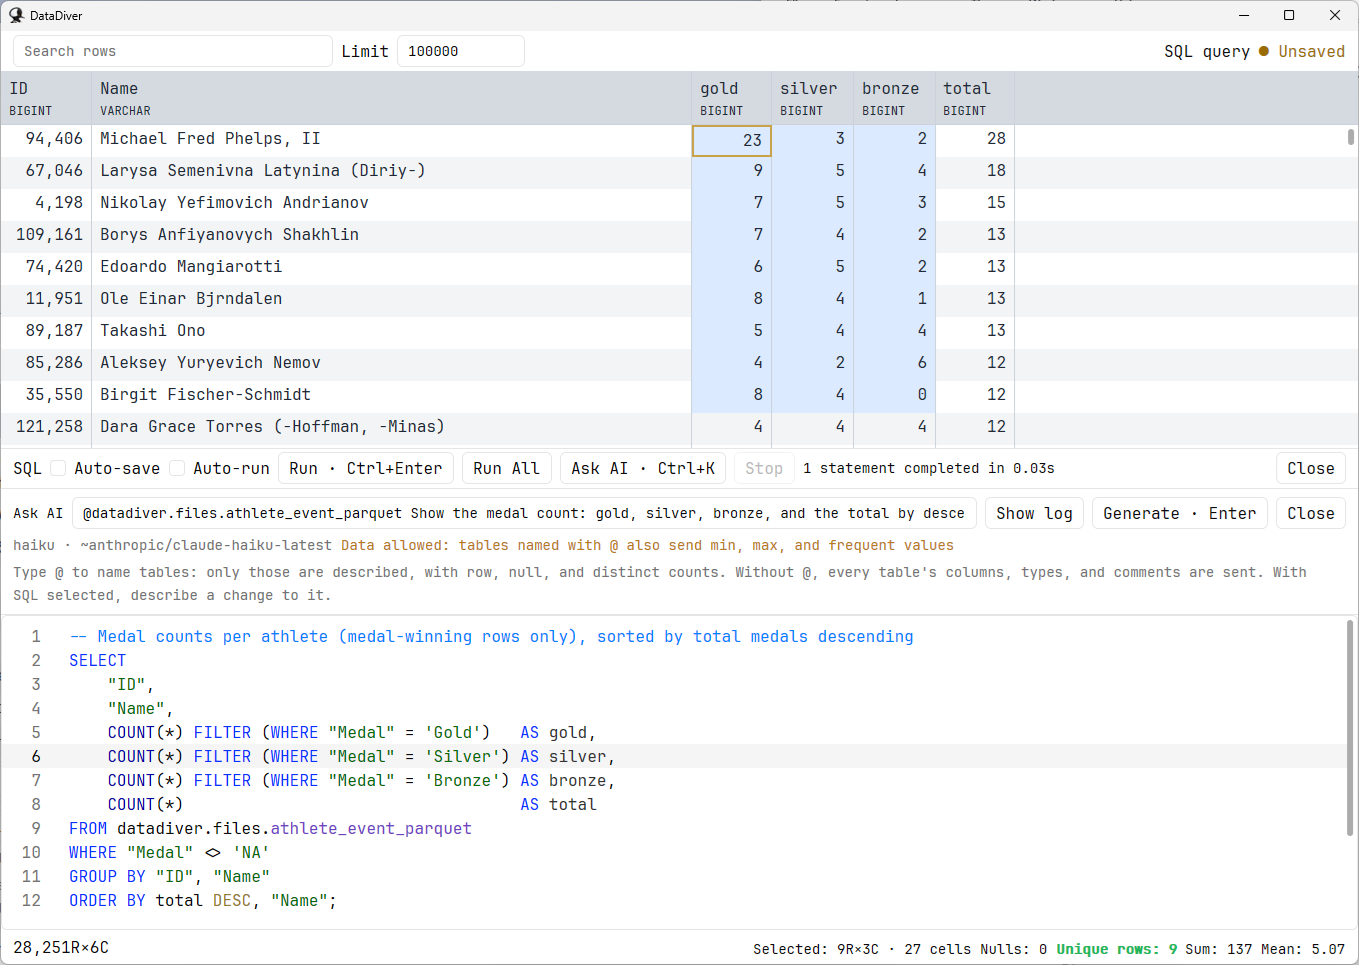
- Ask AI for SQL: describe what you want and get SQL checked by DuckDB before you run it, using any OpenAI-compatible provider.
- Inspect values: column profiles in the Info dialog, and a cell detail pane for long text and pretty-printed JSON.
- Reuse your work: save views, open favorites with Ctrl+1–9, go back and forward through history, undo view changes, and restore the previous session.
- Copy and export: copy cells as TSV, CSV, JSON, or Python lists, or export the displayed result to CSV, Parquet, JSON, or Excel.
- Look things up: view actions open a web page, internal site, or program for the active row.
- Work from the keyboard: a searchable command palette, a Space menu, and a Keymap Editor for custom shortcuts.
- Make it comfortable: themes, grid and editor fonts, font size, and independent windows.
Install
DataDiver currently ships for 64-bit Windows.
Download the zip from the Releases page, extract it, and run datadiver.exe. No installer or other software is needed. The exe is unsigned, so Windows SmartScreen may warn the first time you run it.
It can also be installed with pipx, which puts datadiver on your PATH:
pipx install datadiver
datadiver
Upgrade later with pipx upgrade datadiver.
To try the app with generated data and a temporary profile that leaves nothing behind:
datadiver --rows 10000 --ephemeral
A typical workflow
- Press Ctrl+O to open a supported file, or Ctrl+P to browse files and saved views.
- Press / to search the displayed rows. Press Z to add a slicer that filters by a source column.
- Press G to choose grouping columns, A to configure aggregations, and P to choose pivot dimensions. Use O to configure ordering.
- Press Enter on a result cell to see the rows behind it, and U to go back.
- Select cells and press Ctrl+C to copy, or Ctrl+Shift+C to choose an output format.
- Press Ctrl+S to save the view for later.
Press F1 for a list of shortcuts, or Ctrl+Shift+P to search every command.
Keyboard shortcuts
These are the defaults. Single-key commands apply when the grid has focus. Change any of them in the Keymap Editor (Ctrl+Shift+K), which supports separate bindings per context.
Application
| Shortcut | Action |
|---|---|
| Ctrl+Shift+P | Command palette |
| Ctrl+P | Files and views |
| Ctrl+O | Open file |
| Ctrl+B | Show or hide database tree |
| Ctrl+J | Open SQL editor |
| Ctrl+S or F12 | Save view |
| Ctrl+1–9 | Open a favorite |
| Ctrl+Shift+1–9 | Assign the current file or view to a favorite |
| Ctrl+Z / Ctrl+Y or Ctrl+Shift+Z | Undo / redo view change |
| Ctrl+R | Reload source |
| Ctrl+Shift+R | Reload and reset |
| Ctrl+F | Focus search |
| Ctrl+D | Focus data grid |
| Ctrl+L | Focus next slicer input |
| Ctrl+G | Jump to column |
| Ctrl+= / Ctrl+- | Increase / decrease font size |
| Ctrl+N | New window |
| Ctrl+Q | Close window |
| Ctrl+Shift+K | Keymap Editor |
| F1 | Help |
Grid
| Shortcut | Action |
|---|---|
| / | Search |
| Space | Open the Space menu |
| G / A / P / O | Group By / Aggregations / Pivot By / Order By |
| Z | Add slicer |
| = / - | Keep / exclude rows equal to the active cell |
| Enter | Drill down from a query cell to its source rows |
| Shift+Enter | Drill down in a new window |
| U / R | Back / forward |
| [ / ] | Sort ascending / descending |
| Shift+X | Clear sort (tables) |
| F / Shift+F | Freeze or unfreeze column / unfreeze all |
| Alt+← / Alt+→ | Move column left / right (tables) |
| Delete | Remove the active group-by column (queries) |
| ( / ) | Decrease / increase column width |
| < / > | Decrease / increase decimal places |
| , | Toggle thousands grouping |
| D | Show or hide cell detail |
| I | Information and column profiles |
| Ctrl+C or C | Copy selection |
| Ctrl+Shift+C | Copy as… |
| Ctrl+V | Open table from clipboard |
Space menu (press Space, then the key)
| Key | Action |
|---|---|
| C / Shift+C | Copy / copy as… |
| S | Save |
| / | Search |
| G / A / P / Z | Group By / Aggregations / Pivot By / Add slicer |
| E | Export result to file |
| T | Show or hide totals (queries) |
| M | Show or hide heat map (queries) |
| H / Shift+H | Hide selected columns / show or hide columns (tables) |
| X | Run view action |
Opening data
- Files: Ctrl+O opens CSV, TSV, Excel, and Parquet files. A path on the command line works too.
- Folders: Add folder in the command palette watches a folder, and its supported files appear under Ctrl+P and in the database tree.
- Clipboard: Ctrl+V in the grid saves pasted text, such as cells copied from Excel or a web page, as a TSV or CSV file and opens it like any other source. Files copied in Explorer open directly.
- Drag and drop: dropping files on a window opens the first one there and the rest in new windows.
- Database tree: Ctrl+B opens a sidebar that lists saved views, imported files, tables and views in the profile database and any attached databases, watched source folders, and DuckDB's
duckdb_*()metadata functions. Type to filter, press Enter to open, or Shift+Enter to open in a new window. The refresh button picks up tables created while it is open. - Favorites: Ctrl+Shift+1–9 assigns the current file or view to a slot, and Ctrl+1–9 opens it.
Search
Search words must all appear in a row (any column, case-insensitive). -word excludes rows containing it, and >N, <N, >=N, <=N match rows where any numeric column compares true.
Scope a term to one column with column:text (contains), column=value (equals), column!=value, or column>N / >= / < / <=. Number columns compare numerically, and dates and other types compare as that type, so "order date">=2024-01-01 works. The column name can be any unique prefix (reg:north for region); quote names or values with spaces (name:"john smith"). -column:text excludes, and a name matching no column searches the whole word as text, so 10:30 still finds times.
Compare two columns by putting the second column's name in double quotes after the operator: "small bags">"large bags". Typing " lists matching column names; press Tab or Enter to insert one.
Search words are highlighted in visible cells; column-scoped words are highlighted only in their column. While search or filters narrow the rows, the status bar shows N of M rows. Press Ctrl+G to find a column by name and move the cursor to it.
Slicers
Add slicer (Z, or Space Z) offers three kinds of card:
- SQL filter is always first in the list, and a view can have one. Type any DuckDB condition over the source columns and press Enter, for example
amount > 100 AND region <> 'Europe'oramount % 2 = 0. The card is not tied to a column. - Value cards list a column's values when it has at most 1,000 of them. Click, Ctrl+click, or drag to select. The search icon in the card header opens a filter box: type to narrow the list, press Enter to select every matching value, and Esc to close it. Values are greyed out when no row matches the other slicers and the
=/-filters, but search does not grey them out. - Condition cards (listed as column · condition) work for any column. Type a condition and press Enter. Terms are separated by spaces and must all match:
>=10 <100,=North,!=0,:smithor a bare word (contains),-word(does not contain), and inclusive ranges10..20,2024-01-01..,..500. Numbers compare as numbers and dates as dates. Text ranges ignore case and include every value starting with the upper bound, sochina..italyincludes "Italy". Partial dates cover their whole period, so2024-10is all of October and..2024runs through December 31, 2024. Comparison values can be relative dates:today,yesterday,-30d,+2w,-6m,-1y(so-30d..todayis the last 30 days). The card shows the column's smallest and largest value.
If a condition or SQL filter has an error, the error shows on its card and the card stops filtering until you fix it. Ctrl+L moves through the slicer inputs, and Ctrl+D returns to the grid.
Slicers, condition cards, the SQL filter, and = / - filters all narrow source rows, before grouping in a query. Search narrows the displayed rows. In a query, search and sort apply to the result.
When a query result reaches the row limit, the limit input turns red and the status bar says Limited to N rows. Search and sort then run inside the query, so they still see every result row, not just the first N.
Filters and drill-down
Press = in the grid to keep only rows whose value in the active column equals the active cell, or - to exclude them. Filters match the value as the grid shows it before number formatting, including empty (NULL) cells. In a query, = and - work on group-by cells and filter the source rows before grouping. Active filters appear as chips under the header; click a chip to remove it, or use Clear filters. Filters are saved with a view.
In a query result, press Enter on a cell to open the source table filtered to the rows behind it: the row's group-by values, plus the pivot values when the cell is a pivoted measure. The query's slicer selections and filters carry over. Press U (Back) to return to the query, or use Shift+Enter to open the drill-down in a new window and keep the query where it is.
Group By, Pivot By, and aggregations
Press G, P, and A to open the Group By, Pivot By, and Aggregations managers. You can configure pivot dimensions first, then add a group to build the result.
Group By and Pivot By each provide + Custom expression and an SQL editor for the selected entry. For example, group by date_trunc('month', "date") AS month or pivot by upper("region") AS RegionCode. Expressions use source columns; aggregates and window functions belong outside these row-level dimension expressions. Use AS for a result name or keep DuckDB's default name. Typing " in these editors lists column names.
The Aggregations manager has a Columns / Functions switch. Functions lists every DuckDB aggregate, searchable by name or description, with signatures and examples; press Enter to insert one into the expression.
Apply with Ctrl+Enter, or use Revert to restore the saved entry. Invalid edits show an inline error and preserve the last successful grid. Tab/Shift+Tab cycles between available columns, configured entries, and SQL; Alt+↑/↓ reorders and Delete removes a configured entry. Managers stay open for further edits; close with Escape or the close button.
- Totals (Space T) add a grand total row under the grid and, for pivots, a (Total) column for each row. Totals aggregate the source rows, so means, medians, and distinct counts total correctly.
- Heat map (Space M) shades measure cells by where each value falls in its range. In a pivot, the columns of one aggregate share a scale so they can be compared.
Views store the source path and the exploration configuration. They reference the original source file, so sharing a view also requires making that source available.
Working with the grid
- Selection statistics: the status bar summarizes the selected cells. With several columns selected, Unique rows counts distinct combinations and turns green when every selected row is distinct, a quick check that the columns form a unique key.
- Columns: freeze with F (Shift+F unfreezes all), reorder tables with Alt+←/→, hide the selected columns with Space H, and choose visible columns with Space Shift+H. Hidden columns keep their place in the column order, and a
column:search term still searches them. Recalculate column widths in the command palette refits every column to its contents, headers, and totals. - Number formatting: , toggles thousands grouping and < / > change decimal places for the active column.
- Cell detail: D opens a pane beside the grid with the active cell's whole value, following the cursor. JSON objects and arrays are pretty-printed.
- Information: I opens the Info dialog with column profiles: nulls, unique count, minimum, maximum, and the five most frequent values for every column, plus the SQL behind the view.
Copy and export
Ctrl+C copies the selection as TSV. Ctrl+Shift+C chooses a format: TSV (raw or formatted), CSV, JSON records, JSON columns, or Python lists.
Export result to file (Space E) writes the rows on screen, matching the search, filters, sort, column order, and hidden columns. The file extension picks the format: .csv, .tsv, .parquet, .json, .ndjson / .jsonl, or .xlsx, with .gz or .zst compression for text formats. A query result cut off at the row limit is rerun without the limit, so the file is complete.
SQL editor
Press Ctrl+J or choose Open SQL editor to open a resizable panel below the grid. Ctrl+Enter runs selected SQL, or the statement at the cursor; Run All executes the script in order. Stop interrupts execution. The grid shows the last result set and keeps search, sorting, navigation, and copy/export available without running SQL again.
SQL runs against the active profile database, including imported tables in the files schema. Database changes are allowed. Temporary objects and explicit transactions survive between runs in the same SQL document. Run All stops on the first error and follows DuckDB's normal transaction behavior. The row limit caps captured results, including RETURNING, without limiting writes; a changed limit applies on the next run.
When the script's last statement is a plain query run outside a transaction, the whole result is kept, so slicers, = / - filters, search, and sort see every row. Other results keep only the rows up to the limit, and slicers and filters explain why they are off.
Completion suggests database tables and DuckDB views after FROM, JOIN, or simplified PIVOT. Typing a. suggests columns only when the statement contains an explicit alias such as FROM files.apples a, including when it appears below the cursor. Typing a path inside a '...' string lists matching folders and files; relative paths search DuckDB's file_search_path. Completion does not infer CTE/subquery columns or include saved application views. Use Enter or Tab to accept a suggestion; Escape dismisses suggestions before returning focus to the grid.
Save SQL with Ctrl+S. Saved scripts appear under SQL views and reopen without execution unless you tick Auto-run in the toolbar. Results and temporary objects are not saved. Closing the panel keeps its text and connection while the document remains open. F freezes leading result columns, and the view remembers them.
Open startup SQL script in the command palette edits startup.sql, which runs whenever the profile database opens. Use it for settings and attachments you always want, for example:
ATTACH 'C:\data\warehouse.duckdb' AS warehouse (READ_ONLY);
SET file_search_path = 'C:\data';
Ask AI for SQL
In the SQL editor, press Ctrl+K (or Ctrl+I, or choose Ask AI for SQL) to open a prompt above the editor. Describe what you want and press Enter. If you select SQL first, the request asks for that selection to be rewritten. DuckDB checks the reply against the database, and errors go back to the model to be fixed, up to twice, before the SQL is shown with DuckDB's verdict. Press Tab to insert it at the cursor, Ctrl+Enter to insert and run it, or Escape to discard it. Show log lists every request and reply.
Type @ to mention a table. When the prompt names tables, only those are described in detail.
Set up a provider with AI providers in the command palette. Any OpenAI-compatible chat API works: enter a base URL, model, and API key, plus any extra headers your gateway needs. The key can be written as {env:NAME} to read it from an environment variable instead of storing it in settings.json. Test connection sends a one-line request to check the settings.
What is sent: your request, the SQL in the editor (or the selection), the current result's column names, and the names, types, and comments of tables and columns. For @-mentioned tables, row counts, null shares, and approximate distinct counts are added. Actual data values are sent only when Allow sending data to improve SQL output is turned on for the provider. It then adds minimum and maximum values, every value of columns with 25 or fewer distinct values, and the five most frequent values of other text columns, for @-mentioned tables only.
View actions
Actions turn the active row into a lookup: open a web search, a record in an internal site, or a file in another program. Press Space then X to show the view's actions, then press an action's key to run it for the active row. With no actions yet, Space X (or Edit view actions in the command palette) opens the editor, where each action has a single-character key (case-sensitive), a description, and a command.
In the command, {Column} inserts the active row's value for that column, and {{ / }} insert literal braces. Commands starting with http:// or https:// open in the browser, with inserted values URL-encoded, for example https://www.google.com/search?q={Customer}. Any other command starts a program directly without a shell: the first word is the program, double quotes group an argument (code "C:/notes/{Id}.md"), and an inserted value always stays inside its argument. For shell features such as pipes or start, write the shell yourself (cmd /C start "" "{Path}").
In the editor, a preview under the command shows it filled in with the active row's values, Run tries the command in the form without saving it (each saved action has its own Run too), and Use loads one of the examples into the form. Actions are saved with the view, so save it (Space S) to keep them.
History and undo
Press U in the grid to go Back, or R to go Forward through files and views opened in that window. History remembers the current view configuration (including unsaved changes) and search text, with up to 100 entries until the window closes. It stores no data or result tables: returning rebuilds table and pivot results from the source, while SQL text reopens without execution or prior results. Opening another view after going back replaces the forward branch.
Ctrl+Z and Ctrl+Y undo and redo changes to the view: group-by, pivot, aggregations, totals, sort, slicers, filters, and column layout. Undo history starts over when you open something else or save. Text inputs keep their own Ctrl+Z.
Customization
- Keymap Editor (Ctrl+Shift+K): rebind any command, per context.
- Theme Editor: adjust the theme's colors.
- Font picker and Choose editor font: set the grid font and the monospaced font used by the code editors. Ctrl+= and Ctrl+- change the size of both.
- Open settings directory: opens the profile folder in File Explorer.
Command-line options
# Open a source file; a positional path also works.
datadiver --file "C:\data\sales.parquet"

# Open a saved view.
datadiver --view "C:\views\sales-summary.json"

# Open a file with an initial search and column slicer.
datadiver --file "C:\data\sales.csv" --search "North" --slicer "Region"

# Use a separate persistent profile.
datadiver --home ".\demo-profile" --rows 10000
| Option | Purpose |
|---|---|
--file PATH |
Open a supported source file |
--view PATH |
Open a saved JSON view |
--rows N |
Generate synthetic data |
--search TEXT |
Set the initial row search |
--slicer COLUMN |
Add a source-column slicer; may be repeated |
--home DIRECTORY |
Store all profile files directly in this directory |
--ephemeral |
Use a temporary profile |
--no-restore |
Skip restoring the previous session and window geometry |
--window WxH |
Set the initial window size |
--help, -h |
Print basic usage |
Choose one of --file, --view, or --rows per launch. --home and --ephemeral cannot be combined. With no explicit source, the app attempts to restore the last source or view.
File formats and local storage
CSV and TSV imports use a header row and automatic type detection. Excel imports read the first worksheet with a header row. Older .xls files, .xlsb, and .ods are not supported. The first Excel import or export may need internet access for DuckDB to download its excel extension.
Imported sources are cached in an on-disk DuckDB database. Reopening an unchanged file can reuse its imported data instead of parsing it again. Source changes are detected using file size and modification time. Open windows check on activation and every second, then refresh their grids and pivots when the data changes; Ctrl+R forces a fresh import when needed.
Each file has one table in the files schema: sales.csv becomes files.sales_csv. Names are lowercase, with punctuation replaced by underscores. Files that map to the same table name are rejected. Reloads replace the table transactionally.
On Windows, the profile is stored in %LOCALAPPDATA%\datadiver; other platforms use ~/.local/share/datadiver. Custom --home profiles store everything in the specified directory. The profile contains:
| Path | Contents |
|---|---|
datadiver.duckdb |
Imported sources and anything you create in SQL |
settings.json |
Preferences, favorites, and AI providers |
keymap.json, theme.json |
Custom shortcuts and theme |
startup.sql |
The startup SQL script |
state.json |
Session state restored at startup |
views/ |
Saved views; archived views move to deleted/ |
pasted/ |
Tables opened from the clipboard |
Build from source
The project has been developed and tested on Windows. The commands below use PowerShell.
You will need:
- A current stable Rust toolchain with Cargo and Rust 2024 edition support.
- For Windows builds, the MSVC Rust target, Visual Studio C++ Build Tools, and the Windows SDK.
- Internet access to download Cargo dependencies for the first build.
DuckDB is compiled from bundled source, so a separate DuckDB installation is not required. The first build can take a while because it includes native dependencies.
From the repository root:
cargo build --release
.\target\release\datadiver.exe
To try the app with generated data:
cargo run --release -- --rows 10000 --ephemeral
Development
Run the regular tests and the tests with UI snapshot support:
cargo test
cargo test --features snapshots
The app can capture its own UI when built with the snapshots feature:
cargo run --features snapshots -- --rows 60 --show info --capture "target\ui\info.png" --ephemeral
Use --window 1400x900 to specify capture dimensions and --capture-delay 1000 to set the capture delay in milliseconds. Other --show targets include editor:sql, editor:sql-results, editor:sql-completion, editor:sql-error, editor:sql-ask, and ai-providers.
The source is organized into:
src/domain: data models, pivots, selection, formatting, and copy formats.src/application: application state, commands, preferences, and editing workflows.src/infrastructure: DuckDB storage, source imports, persistence, and performance instrumentation.src/ui: the table interface, panels, editors, and palettes.
For measured performance results and implementation details, see the storage comparison, query modes, and table width behavior.
Releasing
From a clean main, run:
.\scripts\release.ps1 0.2.0
The script sets the version in Cargo.toml, runs the tests, commits, tags v0.2.0, and pushes. The tag starts the Release workflow, which builds the Windows wheel with maturin using the optimized dist profile, attaches it and a zipped exe to a GitHub release, and publishes the wheel to PyPI. To check the wheel locally, run maturin build --release and pipx install target\wheels\datadiver-*.whl.
1 maintainer

Metadata
1 maintainer
Release files for datadiver 0.1.1
For a detailed explanation of source distributions (sdists) and built distributions (wheels), please see the package formats documentation.
Built distribution (wheel)
| File | Interpreter | ABI | Platform | Reset |
|---|---|---|---|---|
| datadiver-0.1.1-py3-none-win_amd64.whl | Python 3 | none | Windows x86-64 | Details |
Release files / datadiver-0.1.1-py3-none-win_amd64.whl
| Download URL | datadiver-0.1.1-py3-none-win_amd64.whl |
|---|---|
| Size | 24.4 MB |
| Tags | Python 3 Windows x86-64 |
|
SHA-256 checksum How to use checksums |
d1e8b2d5b3b083d14dcc1c4c1feda74ab62764120cb6fde1951a0a06655ddc17
|
|
BLAKE2b-256 checksum How to use checksums |
99fb788304e80894e42fc9fd6497a05b1623dce7d9eebcff308e5b2dbc86dac2
|
| Upload date | |
|
Uploaded using Trusted Publishing? What is trusted publishing? |
Yes |
| Uploaded via |
twine/7.0.0 CPython/3.13.14
|
Provenance
Provenance describes where a file came from. On PyPI, provenance is shared via attestations, which provide a verifiable record of the build or publishing details. View details, limitations and caveats.


PyPI Publish Attestation
PyPI verified that this artifact, at this checksum, originated from the publisher listed below.
Signed by GitHub Actions, verified by PyPI on Oct 11, 2026.
Transparency log













