
datagraph
The open-source data engine: lineage · relationships · data profiling · dimensional modelling · knowledge graph for AI assistants
built deterministically from your database, dbt project, SQL and code — no LLM in the loop.





pip install "datagraph-core[sql]"
datagraph analyze --warehouse "snowflake://user:pw@account/db" --schemas analytics -o out/
#  -> lineage.html · relationships.json · MODEL.md + er-diagram.mmd · profiles · wiki/ (for AI assistants) · datagraph.json
Brownfield data platform, hundreds of tables, no documentation? One command turns the schema (and dbt / SQL / code if you have them) into a graph you can query: where does this come from, what does it feed, how are the tables related, what does the data look like, what is the dimensional model, what breaks if I change this — and hands the same graph to your AI assistant over MCP.
How it works
flowchart LR
    subgraph IN["📥 Inputs (any combination)"]
        W[("Warehouse / DB<br/>information_schema<br/>FKs · views · types")]
        D["dbt manifest + catalog"]
        S["SQL files"]
        C["Python / JS code<br/>Airflow · Lambda"]
        O["OpenLineage · DataHub<br/>· plugins"]
    end
    subgraph X["⚙️ Deterministic extractors"]
        E["AST · sqlglot · metadata · git diff<br/>every edge tagged extracted / inferred / llm"]
    end
    subgraph G["🕸️ One graph"]
        N["tables · columns · models · sources<br/>functions · DAG tasks · lambdas · APIs · dashboards"]
    end
    subgraph A["🔎 Analyses"]
        L["Lineage<br/>table + column"]
        R["Relationships<br/>FKs · schema map"]
        P["Profiling<br/>rows · nulls · distinct · freshness"]
        M["Dimensional model<br/>Kimball facts / dims / bus matrix / SCD"]
        I["Impact<br/>blast radius · risk · owners · tests"]
    end
    subgraph OUT["📤 Outputs"]
        T["CLI · JSON · interactive HTML"]
        K["Wiki · llms.txt · context packs"]
        MCP["MCP server<br/>Claude Code · Cursor · Claude Desktop"]
        PR["impactgraph<br/>PR comment · GitHub Action"]
    end
    W & D & S & C & O --> E --> N
    N --> L & R & P & M & I
    L & R & P & M --> T & K & MCP
    I --> PR
    AI(["optional LLM — Anthropic · Bedrock/Nova · OpenAI-compatible<br/><i>explains results, never builds the graph</i>"]) -.-> T
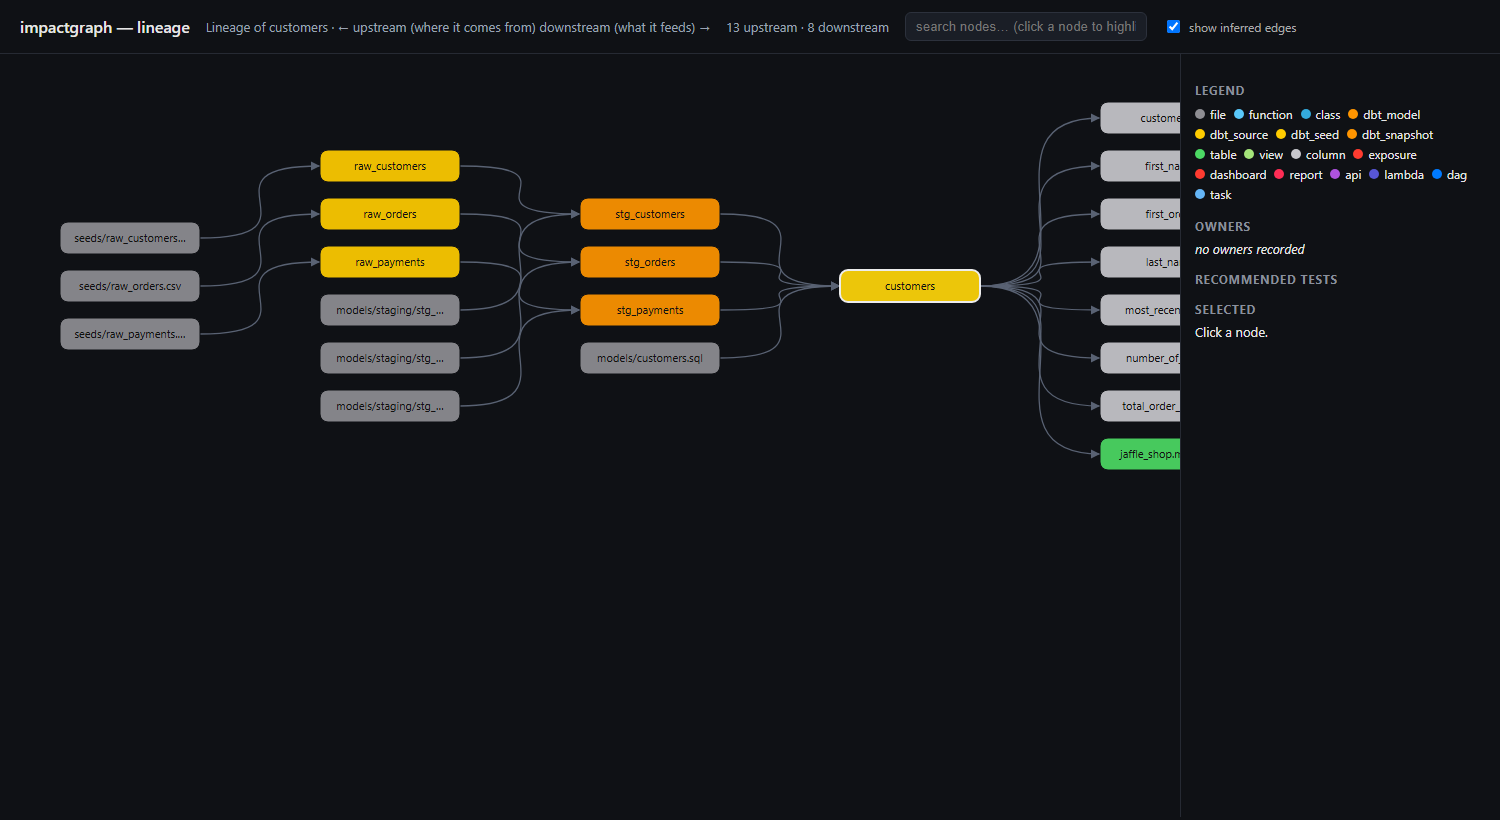
Real output: datagraph lineage customers --html on dbt's public jaffle_shop project — upstream through staging models to seed files, downstream to the table and its columns.
Why datagraph
| You ask | datagraph answers with | From |
|---|---|---|
| Where does this table / column come from, what does it feed? | column-level lineage, interactive HTML, JSON | lineage |
| How are my tables related? | foreign keys, view lineage, per-table column map | relationships |
| What does the data look like? | row counts, freshness, null %, distinct, min/max, top values (sensitive columns masked) | profile |
| What is my dimensional model — is it sound? | Kimball facts / dimensions / bridges, bus matrix, grain, SCD types, issues; star-schema proposal from a wide table | model |
| Give my AI assistant the context | context packs, Markdown wiki + llms.txt, stdio MCP server |
context · wiki · mcp |
| If I change this, what breaks? | blast radius, risk score, owners, test plan; PR comment via impactgraph | impact · diff |
Principles: the graph is built deterministically from artifacts (never by an LLM) · every edge carries provenance (extracted / inferred / llm) and --no-inferred strips heuristics · nothing to deploy — pip, one JSON file, runs in CI · secrets never stored, personal data masked · LLMs are optional and only explain.
New here? Run the guided tour - it builds a demo warehouse and walks through every feature with real output:
python examples/example_datagraph.py
Contents
- Install
- The standard flow: connection in → lineage, profiling, model out
- What goes into the graph
- Commands
- Dimensional modelling
- Data profiling
- Knowledge base & MCP for AI assistants
- Impact analysis & the impactgraph companion
- Python API
- Security
- How it compares
- Node ids, provenance, propagation
- Development & roadmap
Install
pip install datagraph-core              # core: graph, warehouse/dbt/code extractors, lineage, profiling, modelling, wiki
pip install "datagraph-core[sql]"       # + sqlglot: SQL files, view definitions, column-level lineage   (recommended)
pip install "datagraph-core[mcp]"       # + MCP server for Claude Code / Claude Desktop / Cursor
pip install "datagraph-core[ai]"        # + Anthropic Claude for explanations / LLM lineage fallback
pip install "datagraph-core[bedrock]"   # + Amazon Bedrock (Nova, Claude on Bedrock, Llama ...) for the same; OpenAI-compatible needs nothing extra
pip install "datagraph-core[all]"       # everything (also PyYAML for YAML lineage files / serverless.yml)
The PyPI distribution is datagraph-core (the bare name datagraph is not allowed on PyPI); the import name, CLI and MCP server are all datagraph:
pip install datagraph-core → import datagraph / datagraph analyze ….
Database drivers: SQLite and DuckDB files work out of the box; for Snowflake / Postgres / BigQuery / Redshift / MySQL / SQL Server
install SQLAlchemy plus the driver and pass a SQLAlchemy URL (or pass an open DB-API connection from Python).
From source: pip install "datagraph-core[sql] @ git+https://github.com/sumit-gupta03/datagraph".
The standard flow: connection in → lineage, profiling, model out
datagraph analyze --warehouse "snowflake://user:pw@account/db" --schemas analytics,raw -o out/
datagraph analyze --warehouse warehouse.db -o out/            # a SQLite / DuckDB file works too
flowchart LR
    A["🔌 connect<br/>(read-only role)"] --> B["📐 schema<br/>tables · columns · PK/FK · views"]
    B --> C["🕸️ graph<br/>datagraph.json"]
    C --> D["🔗 relationships.json"]
    C --> E["📊 profiling<br/>rows · nulls · distinct · freshness<br/>(sensitive columns masked)"]
    C --> F["⭐ Kimball model<br/>MODEL.md · model.json · er-diagram.mmd"]
    C --> G["🖼️ lineage.html"]
    C --> H["📚 wiki/ + llms.txt<br/>for AI assistants"]
    H --> I["🤖 datagraph mcp<br/>Claude Code · Cursor"]
One command runs the standard sequence (use a read-only database role; the password is never stored or logged):
| Step | What datagraph does | Output in out/ |
|---|---|---|
| connect | opens the connection (sqlite / duckdb file, or any SQLAlchemy URL) |
— |
| schema | reads information_schema: tables, views, columns + types, primary & foreign keys, view definitions → graph |
datagraph.json |
| relationships | table↔table and column↔column relationships (FKs, view lineage), per-table column lists | relationships.json |
| profiling | row count, freshness, per-column null %, distinct, min/max, top values (sampled); sensitive-looking columns masked | stored on the graph |
| dimensional model | Kimball: facts, dimensions, bridges, bus matrix, grain, measures & additivity, SCD types, conformed dimensions, issues | MODEL.md, model.json, er-diagram.mmd |
| lineage view | interactive HTML of the whole graph | lineage.html |
| knowledge base | index.md, one page per table, GRAPH_REPORT.md, MODEL.md, llms.txt |
wiki/ |
Then ask questions against the saved graph:
datagraph lineage fact_sales --graph out/datagraph.json            # upstream / downstream (add --html lineage.html)
datagraph relationships --graph out/datagraph.json --search customer
datagraph context dim_customer --graph out/datagraph.json          # compact knowledge pack for an assistant
datagraph model --graph out/datagraph.json --from-table wide_orders
datagraph mcp --graph out/datagraph.json                           # MCP server for your coding assistant
Options: --schemas a,b · --database NAME · --dialect snowflake|postgres|bigquery|… (for view SQL) · --no-profile (metadata only) ·
--sample N · --no-top-values · --no-inferred (declared foreign keys only) · --json.
What goes into the graph
datagraph build accepts any combination; fragments merge by shared node ids and table aliases (analytics.orders vs prod.analytics.orders) are linked automatically.
| Source | Flag | Contributes |
|---|---|---|
| Warehouse / database | --warehouse DSN (+ --warehouse-schemas, --warehouse-database) |
tables, views, columns + types, primary keys, foreign keys (table and column level), view lineage |
| dbt project | --dbt-manifest (+ --dbt-catalog) |
models, sources, seeds, snapshots, exposures, the DAG, materialized tables, columns + types, owners, column-to-column lineage from compiled SQL (expands select * with the catalog), compiled SQL and test names per model |
| Raw SQL files | --sql DIR |
table/view lineage and column lineage (aliases, CTEs, renames) via sqlglot |
| Python | --repo DIR |
files, functions, classes, imports, calls (inferred), and SQL found inside code → table edges |
| JavaScript / TypeScript | --js DIR |
files, functions, imports, calls, SQL-in-code |
| Airflow | --airflow DIR |
DAGs, tasks, dependencies (>>, lists, chain), python_callable links, SQL in operators |
| AWS Lambda | --lambda FILE |
serverless.yml / SAM / CloudFormation: lambdas → handlers, HTTP APIs, S3/SQS/DynamoDB events, env-referenced tables |
| OpenLineage | --openlineage FILE |
datasets, jobs, schema + columnLineage facets, ownership |
| DataHub | --lineage-file FILE, --datahub URL |
curated lineage files, or a live GraphQL import of datasets, owners, table and column lineage |
| Git | datagraph diff |
which files and which functions changed |
| Your own tool | --<plugin> |
any package exposing a datagraph.extractors entry point (see Python API) |
Commands
| Command | Purpose |
|---|---|
analyze --warehouse DSN -o DIR |
the standard flow above, in one go |
build [inputs] -o datagraph.json |
build / refresh the graph from any inputs (--update skips when inputs are unchanged) |
lineage NODE [--html F] [--json] |
upstream (where it comes from) and downstream (what it feeds) |
relationships [--search X] [--json] |
schema map: every table with columns, foreign keys, lineage relationships, profiles |
profile --warehouse DSN [--tables a,b] |
data profiling stored on the graph |
model [--from-table T] [--mermaid F] [--markdown F] [--json] |
dimensional model / proposed star schema |
context NODE |
compact knowledge pack for one node |
wiki -o DIR |
Markdown knowledge base + GRAPH_REPORT.md + MODEL.md + llms.txt |
impact NODE · diff --repo . · paths A B · hotspots |
change impact: blast radius, risk, owners, tests; propagation paths; riskiest nodes |
html NODE -o F · html --all -o F · export --format graphml|dot|cypher|json |
pictures and exports |
nodes --search X |
find node ids |
graph-diff old.json new.json |
schema / dependency drift between two graphs |
watch · hook-install |
keep the graph fresh (file watcher, git pre-commit hook) |
enrich [--dry-run] · explain NODE |
optional LLM lineage fallback / plain-language explanation ([ai]) |
mcp --graph F |
MCP server ([mcp]) |
plugins |
list installed extractor plugins |
Every command takes --graph PATH (default datagraph.json), most take --json and --no-inferred.
Dimensional modelling
datagraph model                                   # classify + star schema + issues + Mermaid ER diagram (Markdown to stdout)
datagraph model --markdown MODEL.md --mermaid er.mmd --json
datagraph model --from-table wide_orders          # propose fact + dimensions from one flat / wide table
datagraph model --no-inferred                     # declared foreign keys only
Real output of datagraph model --mermaid on a small warehouse (fact + three dimensions, SCD type 2 detected on dim_product):
erDiagram
  fact_sales {
    numeric amount
    key customer_id FK
    key date_key FK
    key product_id FK
    numeric quantity
    key sale_id PK
  }
  dim_customer {
    key customer_id PK
    string country
    string email
    string name
    string updated_at
  }
  dim_product {
    key product_id PK
    string category
    string is_current
    string product_name
    string valid_from
    string valid_to
  }
  dim_date {
    key date_key PK
    string full_date
    string month
    string year
  }
  fact_sales }o--|| dim_customer : "customer_id"
  fact_sales }o--|| dim_product : "product_id"
  fact_sales }o--|| dim_date : "date_key"
…and the matching report:
## Bus matrix (facts x dimensions)
| fact       | dim_customer | dim_product | dim_date |
|------------|--------------|-------------|----------|
| fact_sales | X            | X           | X        |

### table:fact_sales - fact (confidence 0.95)
- grain: date_key, customer_id, product_id        - measures: amount, quantity
- Kimball: process `sales` -> grain: one row per date_key x customer_id x product_id -> 3 dimension(s) -> 2 fact measure(s)

## Dimensions
- dim_customer - key customer_id, 4 attribute(s), used by fact_sales; SCD type 1
- dim_product  - key product_id,  5 attribute(s), used by fact_sales; SCD type 2
- dim_date     - key date_key,    3 attribute(s), used by fact_sales; SCD type static
Standard Kimball approach, computed deterministically and explained (every classification lists its reasons):
- Column roles — pk / fk / date / measure / flag / attribute from names, declared types (warehouse or dbt catalog) and profiles.
- Table roles — fact / dimension / bridge / lookup / derived (views without key links) with a confidence and reasons: foreign keys out/in, measures, dates, attributes, naming conventions, row counts.
- Key links — declared foreign keys (
extracted) plus name inference such asorders.customer_id → customers(inferred, flagged to verify). - Star schema — per fact: business process → grain → dimensions → facts (the four-step design), measures with additivity;
per dimension: key, attributes, used-by, SCD type (2 when
valid_from/valid_to/is_currentexist, 1 whenupdated_at, else undecided with a recommendation); bus matrix (facts × dimensions) and conformed dimensions; snowflake chains. - Issues — fact without a time grain, key with no dimension, fact-to-fact links, measures sitting in a dimension, unused
dimensions, natural/text keys (surrogate key advice), missing
dim_date, high-null keys (late-arriving dimensions). - Propose from a wide table — groups low-cardinality attributes by prefix into dimensions (
customer_name,customer_country→dim_customer), numeric columns into measures, dates intodim_date; near-unique text stays as degenerate dimensions.
MODEL.md is part of the wiki, model is an MCP tool, and the role shows up in context packs.
Data profiling
datagraph profile --warehouse prod.db [--tables customers,orders] [--sample 100000] [--no-top-values]
Per table: row count, freshness (max of date-like columns); per column: null %, distinct, min/max, top values (sampled). Results are
stored on the graph nodes and surface in relationships, context, lineage HTML tooltips and the wiki. Columns whose names look
sensitive (email, phone, name, address, card, token, …) keep counts only — no sample values. Profiles also make the risk score
data-aware (empty tables count half, >1M-row tables 1.5×) and feed the optional LLM lineage fallback.
Knowledge base & MCP for AI assistants
datagraph context dim_customer        # description, owner, columns (+type, pk, profile, where each column comes from),
                                      # upstream, downstream, relationships, dbt tests, modelling role,
                                      # risk-if-changed + test plan, and the SQL that builds it
datagraph wiki -o kb/                 # index.md, nodes/*.md (cross-linked), GRAPH_REPORT.md, MODEL.md, llms.txt
GRAPH_REPORT.md lists hotspots, high-impact dbt models without tests, ownerless nodes, roots and leaves. Everything is generated
from the graph, so an assistant explains rather than guesses.
MCP (Claude Code, Claude Desktop, Cursor — any MCP client), after pip install "datagraph-core[mcp]" and one analyze/build:
{
  "mcpServers": {
    "datagraph": {
      "command": "python",
      "args": ["-m", "datagraph.cli", "mcp", "--graph", "/path/to/out/datagraph.json"]
    }
  }
}
(examples/mcp/claude-mcp.json; for Claude Code put it in .mcp.json or run
claude mcp add datagraph -- python -m datagraph.cli mcp --graph /path/to/datagraph.json.) Tools: impact, diff, find_nodes,
paths, hotspots, lineage, relationships, context, model. The server is stdio-only, read-only over the graph file you pass,
and never receives connection strings.
Claude Code skill: copy skills/datagraph/ to .claude/skills/datagraph/ (or ~/.claude/skills/) and ask "where does
fact_booking come from?", "how are these tables related?", "what is the dimensional model?", "what breaks if I change dim_customer?".
Impact analysis & the impactgraph companion
flowchart LR
    classDef changed fill:#ffe0b2,stroke:#e65100,stroke-width:2px
    classDef hit fill:#fde2e2,stroke:#c62828
    F["func load_customers()<br/><i>git diff</i>"]:::changed -->|writes_to| T["table analytics.customer"]:::hit
    T -->|depends_on ⟲| M1["dbt dim_customer"]:::hit
    M1 -->|depends_on ⟲| M2["dbt fact_booking"]:::hit
    M2 -->|exposes| D1["📊 revenue_report<br/>owner: finance"]:::hit
    M2 -->|exposes| D2["📊 customer_dashboard<br/>owner: growth"]:::hit
    M2 -.->|"risk HIGH · notify finance, growth<br/>tests: pytest -k load_customers · dbt build --select dim_customer+"| R(( ))
datagraph impact dbt:customer                    # a model / table / column / function / task
datagraph diff --repo . --graph datagraph.json   # what my uncommitted change can break
datagraph paths dbt:customer exposure:revenue_report
datagraph hotspots
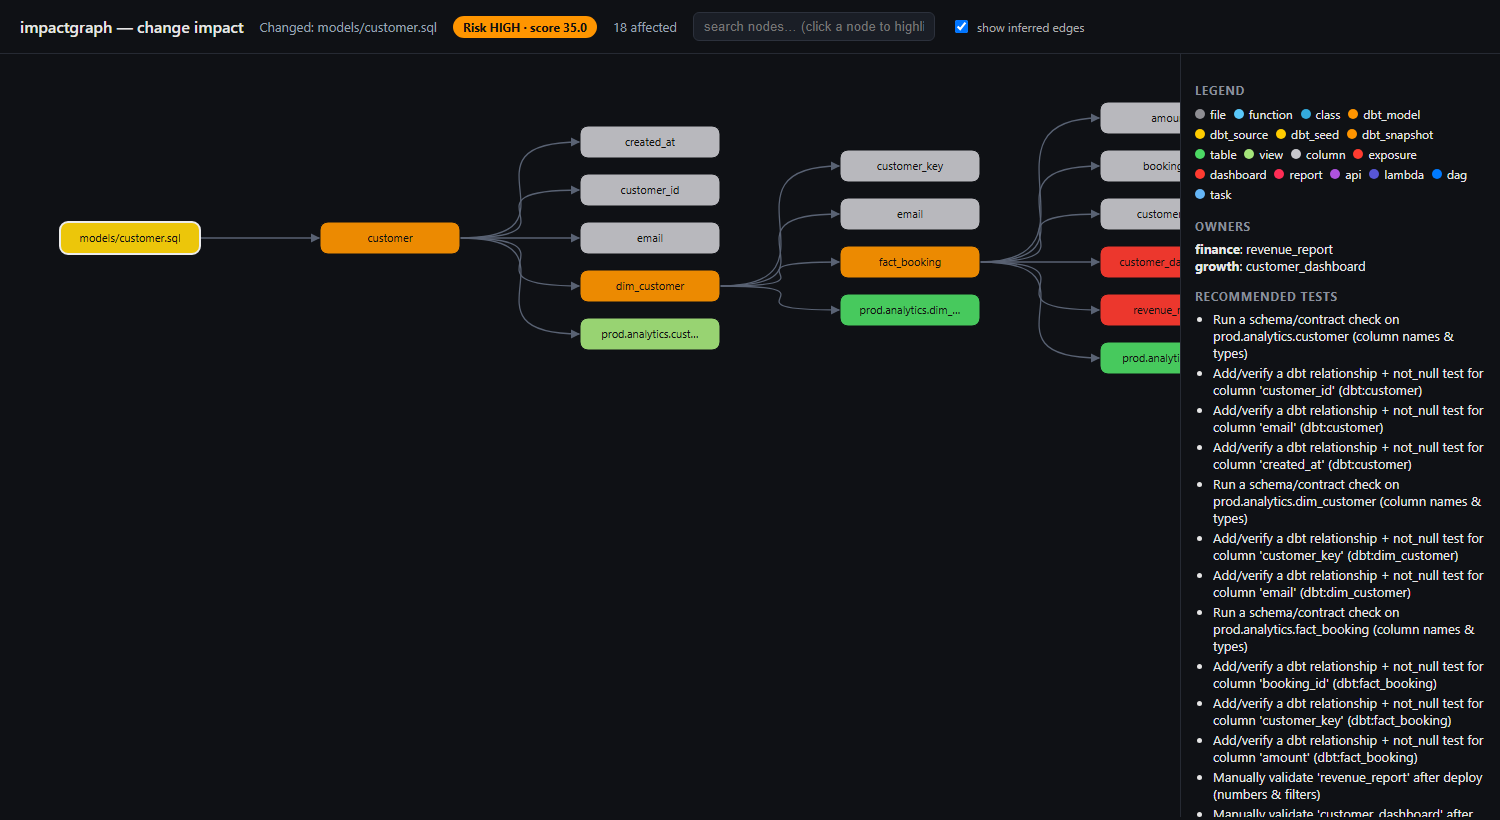
⚠ Change Impact                     Changed: customer      Risk: HIGH (score 24.5)

⬢ customer (dbt_model)
├── ⬢ dim_customer (dbt_model) via depends_on
│   └── ⬢ fact_booking (dbt_model) via depends_on
│       ├── 📊 revenue_report (dashboard) via exposes
│       └── 📊 customer_dashboard (dashboard) via exposes
└── ▤ prod.analytics.customer (view) via writes_to

Affected: 3 dbt model(s) · 2 dashboard(s) · 2 table(s)
Notify (owners of affected artifacts):  finance: revenue_report · growth: customer_dashboard
Recommended tests:
  ✓ dbt build --select customer+ dim_customer+ fact_booking+
  ✓ Run a schema/contract check on prod.analytics.fact_booking
  ✓ Manually validate 'revenue_report' after deploy (numbers & filters)
datagraph html models/customer.sql — one SQL file → models → tables → dashboards and the Python API, with risk, owners and the test plan.
The pull-request product — impactgraph check / pr, a GitHub Action that comments the blast radius on every PR, --fail-on
gating — lives in impactgraph, a thin layer over this engine that re-exports its
whole API. datagraph = everything data-related; impactgraph = "what breaks if I merge this?".
Python API
from datagraph import (ImpactGraph, WarehouseExtractor, DbtExtractor, SqlExtractor, PythonExtractor,
                       AirflowExtractor, LambdaExtractor, JsExtractor, OpenLineageExtractor,
                       LineageFileExtractor, DataHubExtractor, analyze_impact,
                       profile_warehouse, star_schema, propose_from_table, classify_tables,
                       context, build_wiki, ExtractorPlugin, register)

# 1. build (any combination; a DSN, a file path or an open DB-API connection)
graph = ImpactGraph()
graph.merge(WarehouseExtractor("snowflake://...", schemas=["analytics"]).extract())
graph.merge(DbtExtractor("target/manifest.json", catalog_path="target/catalog.json").extract())
graph.merge(PythonExtractor("./src").extract())
graph.link_table_aliases()

# 2. lineage & relationships
graph.lineage("table:analytics.dim_customer")             # {'upstream': {...}, 'downstream': {...}}
from datagraph.analysis.relationships import relationships
relationships(graph)["table_relationships"]               # foreign keys + lineage between tables

# 3. profiling, dimensional model, knowledge base
profile_warehouse("snowflake://...", graph)               # stores node.meta["profile"] (sensitive columns masked)
model = star_schema(graph)                                # facts, dimensions, bus_matrix, scd, issues
from datagraph.analysis.modeling import to_markdown, to_mermaid
print(to_markdown(model)); print(to_mermaid(model))
propose_from_table(graph, "wide_orders")                  # star from a flat table
print(context(graph, "dim_customer"))                     # compact text pack
build_wiki(graph, "kb/")

# 4. impact
analysis = analyze_impact(graph, ["dbt:customer"])
analysis.risk, analysis.owners, analysis.recommended_tests, analysis.trees

# 5. your own extractor (BI tool, orchestrator, catalog ...) -> also becomes `datagraph build --mytool X`
register(ExtractorPlugin(name="mytool", factory=MyToolExtractor, help="...", options={"token": "API token"}))
# or in your package's pyproject:  [project.entry-points."datagraph.extractors"]  mytool = "my_pkg:MyToolExtractor"

# 6. optional AI (pip install datagraph-core[ai])
from datagraph.ai import explain_impact, suggest_lineage, apply_suggestions
print(explain_impact(analysis))                                          # explains; never changes the graph
apply_suggestions(graph, suggest_lineage(graph), min_confidence=0.7)     # tagged provenance=llm, excludable
Optional AI layer and LLM providers
The AI layer is optional and never builds the graph: datagraph explain narrates an impact analysis, datagraph enrich /
build --llm-fallback asks for relationship suggestions (schema-validated, must reference existing nodes, tagged llm,
confidence-gated). Three interchangeable providers; pick with --provider or DATAGRAPH_LLM_PROVIDER, model with --model or
DATAGRAPH_LLM_MODEL; credentials always come from the environment / cloud SDK, never from the graph:
| Provider | Install | Credentials | Default model | Example |
|---|---|---|---|---|
anthropic (default) |
datagraph-core[ai] |
ANTHROPIC_API_KEY |
claude-opus-5 |
datagraph explain dbt:customer |
bedrock — Amazon Nova, Claude on Bedrock, Llama, Mistral … |
datagraph-core[bedrock] |
standard AWS chain (AWS_ACCESS_KEY_ID/AWS_SECRET_ACCESS_KEY/AWS_REGION, profile, SSO, instance role) |
amazon.nova-pro-v1:0 |
datagraph explain dbt:customer --provider bedrock --model amazon.nova-pro-v1:0 |
openai — any OpenAI-compatible endpoint (OpenAI, Azure, Ollama, vLLM, Groq …) |
nothing extra | DATAGRAPH_LLM_API_KEY (+ DATAGRAPH_LLM_BASE_URL, e.g. http://localhost:11434/v1 for Ollama) |
gpt-4o-mini |
DATAGRAPH_LLM_PROVIDER=openai DATAGRAPH_LLM_BASE_URL=http://localhost:11434/v1 datagraph enrich --model llama3 --dry-run |
from datagraph.ai import explain_impact, suggest_lineage, BedrockProvider
print(explain_impact(analysis, provider="bedrock", model="amazon.nova-pro-v1:0"))
suggest_lineage(graph, provider=BedrockProvider(model="anthropic.claude-3-5-sonnet-20241022-v2:0", region="us-east-1"))
Tested live on Amazon Bedrock with amazon.nova-lite-v1:0 (explain + enrich). Bedrock per-model output caps are handled automatically (DATAGRAPH_LLM_MAX_TOKENS to override).
Everything else — lineage, relationships, profiling, dimensional modelling, wiki, MCP — needs no LLM at all.
Security
- Deterministic core, no LLM in the loop. Graph, lineage, profiling and the dimensional model are computed from artifacts; an LLM
is optional and only explains or suggests (suggestions are schema-validated, must reference existing nodes, are tagged
llmand gated by confidence). Nothing an LLM returns is executed. - Prompt injection. Names, descriptions, docs and SQL are data from your repos and warehouses. Every LLM prompt wraps them in
<data>tags with an instruction to never follow instructions found inside; text is stripped of control/bidi characters and truncated; wiki/context output and the MCP server instructions carry the same "untrusted text" notice for downstream assistants. - Secrets. Connection strings are used only to open a connection; they are never written to the graph, the cache or outputs, and passwords are redacted wherever a DSN is printed. Prefer environment variables / key-pair / SSO auth from your driver.
- Personal data. Profiling keeps counts but masks sample values (min/max/top values) for sensitive-looking columns;
--no-top-valuesdisables value sampling;--no-profileskips data access entirely. - SQL / HTML injection. Identifiers are quoted and literals escaped in every generated query; HTML reports escape embedded JSON.
- MCP server. stdio-only local process (no network port), read-only over the graph file you pass, accepts no connection strings.
- Access. Use a read-only database role; datagraph only issues
SELECTs againstinformation_schemaand the tables you profile. - Plugins are Python entry points — install only extractor packages you trust (same trust level as any pip package).
How it compares: Graphify · DataHub · OpenLineage · datagraph
| Graphify | DataHub | OpenLineage | datagraph | |
|---|---|---|---|---|
| What it is | A skill that turns a folder into a knowledge graph for AI assistants | A deployed metadata platform / catalog | An open standard for emitting lineage events (Marquez as reference server) | A pip library + CLI + MCP for lineage, relationships, profiling, dimensional modelling and impact |
| Question answered | "Help my AI assistant understand this repo" | "What data exists, who owns it, how is it connected, is it healthy?" | "What did this job read and write at run time?" | "Where does this come from, how is it related, what does it look like, what is the model, what breaks if I change it?" |
| Inputs | 13 languages via tree-sitter, docs, PDFs, images | 50+ connectors, OpenLineage events | Emitters in Airflow, Spark, dbt, Flink… | warehouse information_schema (FKs, views), dbt manifest + catalog, SQL, Python/JS, git diff, Airflow, Lambda, OpenLineage, DataHub, plugins |
| Graph built by | AST + Claude for non-code | ingestion connectors | the emitting jobs | deterministic extractors; optional llm fallback clearly tagged |
| Knows application code | yes (structure) | no | no | yes — functions, calls, SQL-in-code, Lambda handlers, Airflow callables |
| Column-level lineage | no | yes (connectors) | yes (facet) | yes (sqlglot, catalog-aware; imports OL/DataHub column lineage) |
| Foreign keys / schema relationships | no | yes | no | yes |
| Data profiling | no | yes (ingestion recipes) | no | yes (light, masked, feeds risk & modelling) |
| Dimensional modelling | no | no | no | yes (Kimball: facts/dims/bus matrix/SCD/issues, wide-table proposals) |
| Direction-aware impact + risk + test plan | no | impact view only | no | yes, across code and data (and impactgraph for PRs) |
| AI assistant integration | skill + MCP | MCP / API | via a backend | skill, MCP, context packs, wiki + llms.txt |
| Infrastructure | none | platform (DB, search, Kafka) | events need a backend | none — pip, a JSON file; runs in CI |
Positioning: OpenLineage is the wire format lineage travels in; DataHub is the catalog it lands in; Graphify is the repo map for an assistant; datagraph is the local data engine that reads your warehouse, dbt and code, and imports OpenLineage / DataHub rather than competing with them. It is deliberately not a catalog (no search UI, glossary, governance or monitoring).
Known limits: code languages are Python and JS/TS (regex-based for JS); call edges are name-resolved (tagged inferred); column
lineage needs SQL or a catalog — otherwise a same-name heuristic (tagged inferred) or the opt-in llm fallback applies; dimensional
classification is heuristic and always shows its reasons and confidence.
Node ids, provenance, propagation
table:prod.analytics.customer  column:dim_customer.customer_key   dbt:dim_customer   source:raw.customers
file:models/customer.sql       func:src/api.py::customers_endpoint   class:src/models.py::Customer
exposure:revenue_report        job:airflow/load_dim_customer   dag:nightly   task:nightly/build_dim   lambda:GetBookings   api:GET /bookings
Every edge carries a provenance — extracted (from an artifact), inferred (heuristic: name-resolved call, same-name column,
name-inferred foreign key) or llm (accepted suggestion); --no-inferred keeps only extracted. Edges are typed and each type knows
which way change flows (contains, writes_to, exposes forward; calls, imports, depends_on reverse): impact() walks forward,
upstream() backward, lineage() both.
Development
git clone https://github.com/sumit-gupta03/datagraph && cd datagraph
pip install -e ".[dev]"
pytest            # 140 tests, offline, ~20 s — includes dbt's real jaffle_shop project as a fixture
Docs: docs/datagraph-documentation.pdf (how it was built, A to Z) and docs/datagraph-learning-guide.pdf (graphs and lineage from
zero). Tagging vX.Y.Z builds wheels, creates a GitHub Release and publishes datagraph-core to PyPI via trusted publishing
(.github/workflows/publish.yml).
Roadmap
- Plugin packages for Looker / Tableau / Power BI / Dagster / Prefect / Kafka (the
datagraph.extractorsentry point is ready) - Tree-sitter parsers for Java / Scala / Go (today: Python via ast, JS/TS via regex)
- Data-quality rule suggestions from profiles + model (uniqueness of keys, referential integrity, freshness SLAs)
- Incremental per-file rebuilds (today
--updateskips unchanged inputs)
License
MIT
1 maintainer

Download files
Download the file for your platform. If you're not sure which to choose, learn more about installing packages.
Source Distribution
Built Distribution
Filter files by name, interpreter, ABI, and platform.
If you're not sure about the file name format, learn more about wheel file names.
Copy a direct link to the current filters
File details
Details for the file datagraph_core-0.8.4.tar.gz.
File metadata
- Download URL: datagraph_core-0.8.4.tar.gz
- Upload date:
- Size: 143.8 kB
- Tags: Source
- Uploaded using Trusted Publishing? Yes
- Uploaded via:
twine/7.0.0 CPython/3.13.14
File hashes
| Algorithm | Hash digest | |
|---|---|---|
| SHA256 |
bd03d4439484c67bdbb869d7c3e8f94ecba35c31d24a5a104c25917583a28f28
|
|
| MD5 |
eaba2a0d7120889921dc06db6b72e517
|
|
| BLAKE2b-256 |
c003d3e6e6f9759f3ba967355539c1244f24ea1607d8b2824887f62eb799bb57
|
Provenance
The following attestation bundles were made for datagraph_core-0.8.4.tar.gz:
Publisher:
publish.yml on sumit-gupta03/datagraph
-
Statement:
-
Statement type:
https://in-toto.io/Statement/v1 -
Predicate type:
https://docs.pypi.org/attestations/publish/v1 -
Subject name:
datagraph_core-0.8.4.tar.gz -
Subject digest:
bd03d4439484c67bdbb869d7c3e8f94ecba35c31d24a5a104c25917583a28f28 - Sigstore transparency entry: 2579918384
- Sigstore integration time:
-
Permalink:
sumit-gupta03/datagraph@80f9fbddaff3e8f1bdbd85feed5d703332b1dd05 -
Branch / Tag:
refs/tags/v0.8.4 - Owner: https://github.com/sumit-gupta03
-
Access:
public
-
Token Issuer:
https://token.actions.githubusercontent.com -
Runner Environment:
github-hosted -
Publication workflow:
publish.yml@80f9fbddaff3e8f1bdbd85feed5d703332b1dd05 -
Trigger Event:
push
-
Statement type:
File details
Details for the file datagraph_core-0.8.4-py3-none-any.whl.
File metadata
- Download URL: datagraph_core-0.8.4-py3-none-any.whl
- Upload date:
- Size: 111.9 kB
- Tags: Python 3
- Uploaded using Trusted Publishing? Yes
- Uploaded via:
twine/7.0.0 CPython/3.13.14
File hashes
| Algorithm | Hash digest | |
|---|---|---|
| SHA256 |
082e67f2299ba8878c083a3ca98e654c761ac20f7b83f553f039525b966a19fd
|
|
| MD5 |
45bc977694042a64dee4beb2d9556160
|
|
| BLAKE2b-256 |
af20817c6c1ae7abd8291ac0bae10404e7b4565b0ed7fd1af2f12a2876422ec1
|
Provenance
The following attestation bundles were made for datagraph_core-0.8.4-py3-none-any.whl:
Publisher:
publish.yml on sumit-gupta03/datagraph
-
Statement:
-
Statement type:
https://in-toto.io/Statement/v1 -
Predicate type:
https://docs.pypi.org/attestations/publish/v1 -
Subject name:
datagraph_core-0.8.4-py3-none-any.whl -
Subject digest:
082e67f2299ba8878c083a3ca98e654c761ac20f7b83f553f039525b966a19fd - Sigstore transparency entry: 2579918387
- Sigstore integration time:
-
Permalink:
sumit-gupta03/datagraph@80f9fbddaff3e8f1bdbd85feed5d703332b1dd05 -
Branch / Tag:
refs/tags/v0.8.4 - Owner: https://github.com/sumit-gupta03
-
Access:
public
-
Token Issuer:
https://token.actions.githubusercontent.com -
Runner Environment:
github-hosted -
Publication workflow:
publish.yml@80f9fbddaff3e8f1bdbd85feed5d703332b1dd05 -
Trigger Event:
push
-
Statement type:














