
Datalens.ai 🔍
Data health intelligence that learns from your data, and tells you what to do next.
Learns normal. Flags what matters.
Point Datalens at files, MongoDB, BigQuery, S3 or an HTTP API. It profiles every object and field, scores quality with formulas you can read, finds keys, foreign keys and orphans, masks PII, learns what normal looks like for your feed, checks it against the schema you expect, and turns every finding into a prioritised action — in one offline HTML report, a JSON summary for CI/CD, and an optional chat you can ask follow-up questions.


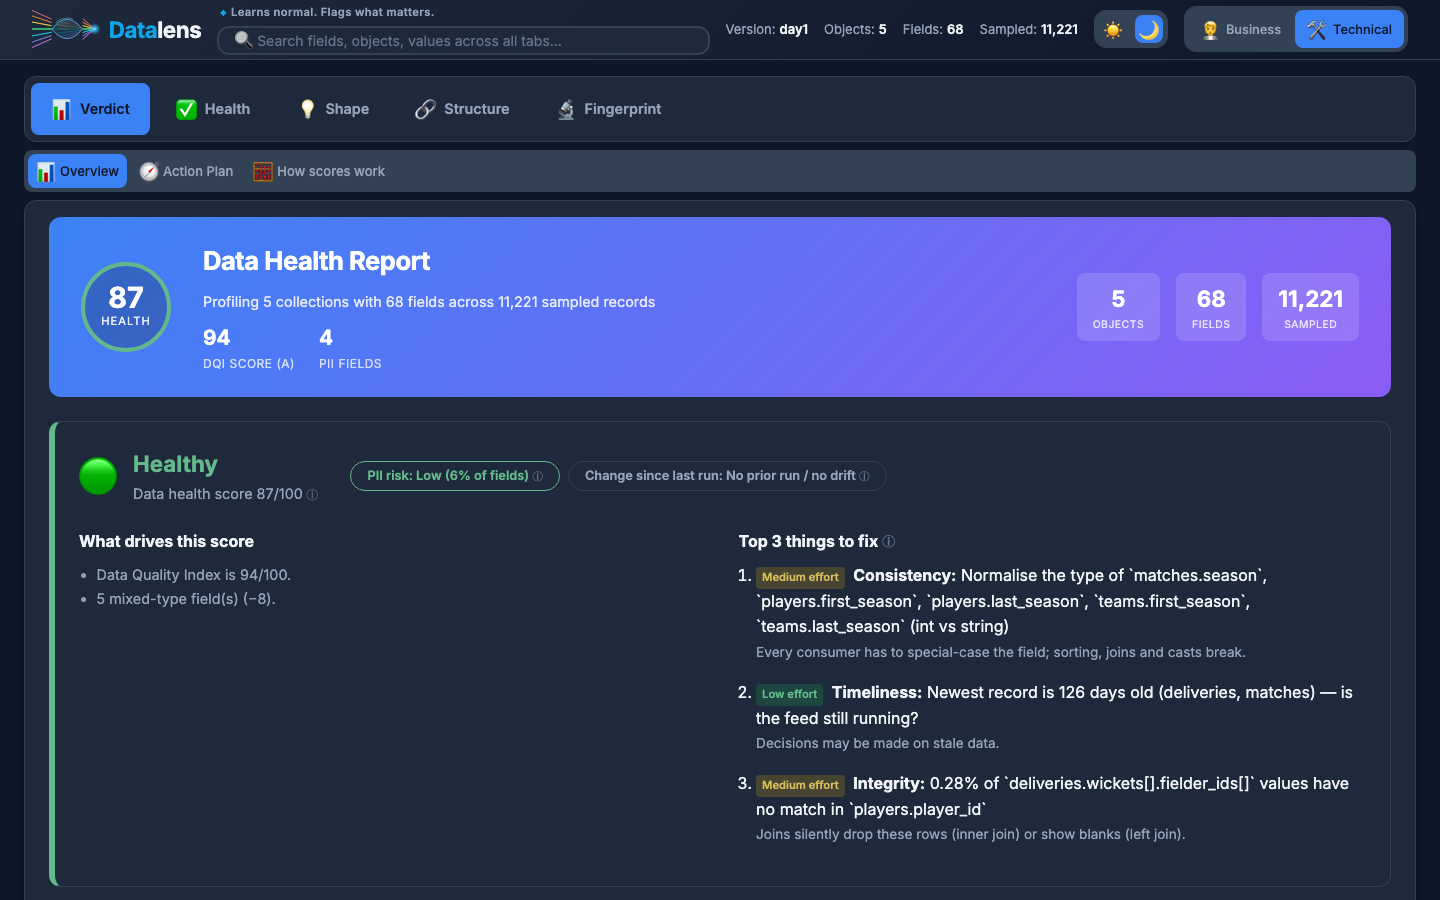
The Verdict for day 1 of the bundled cricket demo: 87 / 100, Healthy, with the 3 fixes worth making first. Day 2's injected problems turn the same screen to At risk and name each one (see below).
Get started in 2 minutes
pip install datalens-ai
datalens analyze --source file --path your_data.csv      # no config needed; report in output/<name>_<tag>/
To reuse settings and keep credentials out of your commands, set up a config folder once:
datalens init                                             # ~/.datalens: config.yaml, secrets.yaml, .env, connections/
datalens connection-new orders --source file --path ./exports   # or mongodb, http, s3, bigquery
datalens analyze --cc orders
Keep config anywhere (a server, a shared repo) with --config-dir /path or DATALENS_CONFIG_DIR, and run
datalens config-show to see what's in use.
📘 Setup Guide (with Setup Connections) · ❓ FAQ: sample size, full scans, output folder, history, how drift works, CI/CD.
Contents
- Get started in 2 minutes
- Day 1 vs day 2 in 60 seconds
- It learns what normal looks like
- It tells you what to do next
- Bring your own schema (BYOS)
- Every number explains itself
- Wire it into CI/CD
- AI review and chat
- Coming from variety.js?
- Install · Examples · Docs · FAQ
Day 1 vs day 2 in 60 seconds
The repo ships a real, related dataset: IPL cricket from Cricsheet — five entities
(matches, deliveries, players, teams, venues), ~160K rows, nested objects and arrays. Day 2 is the next
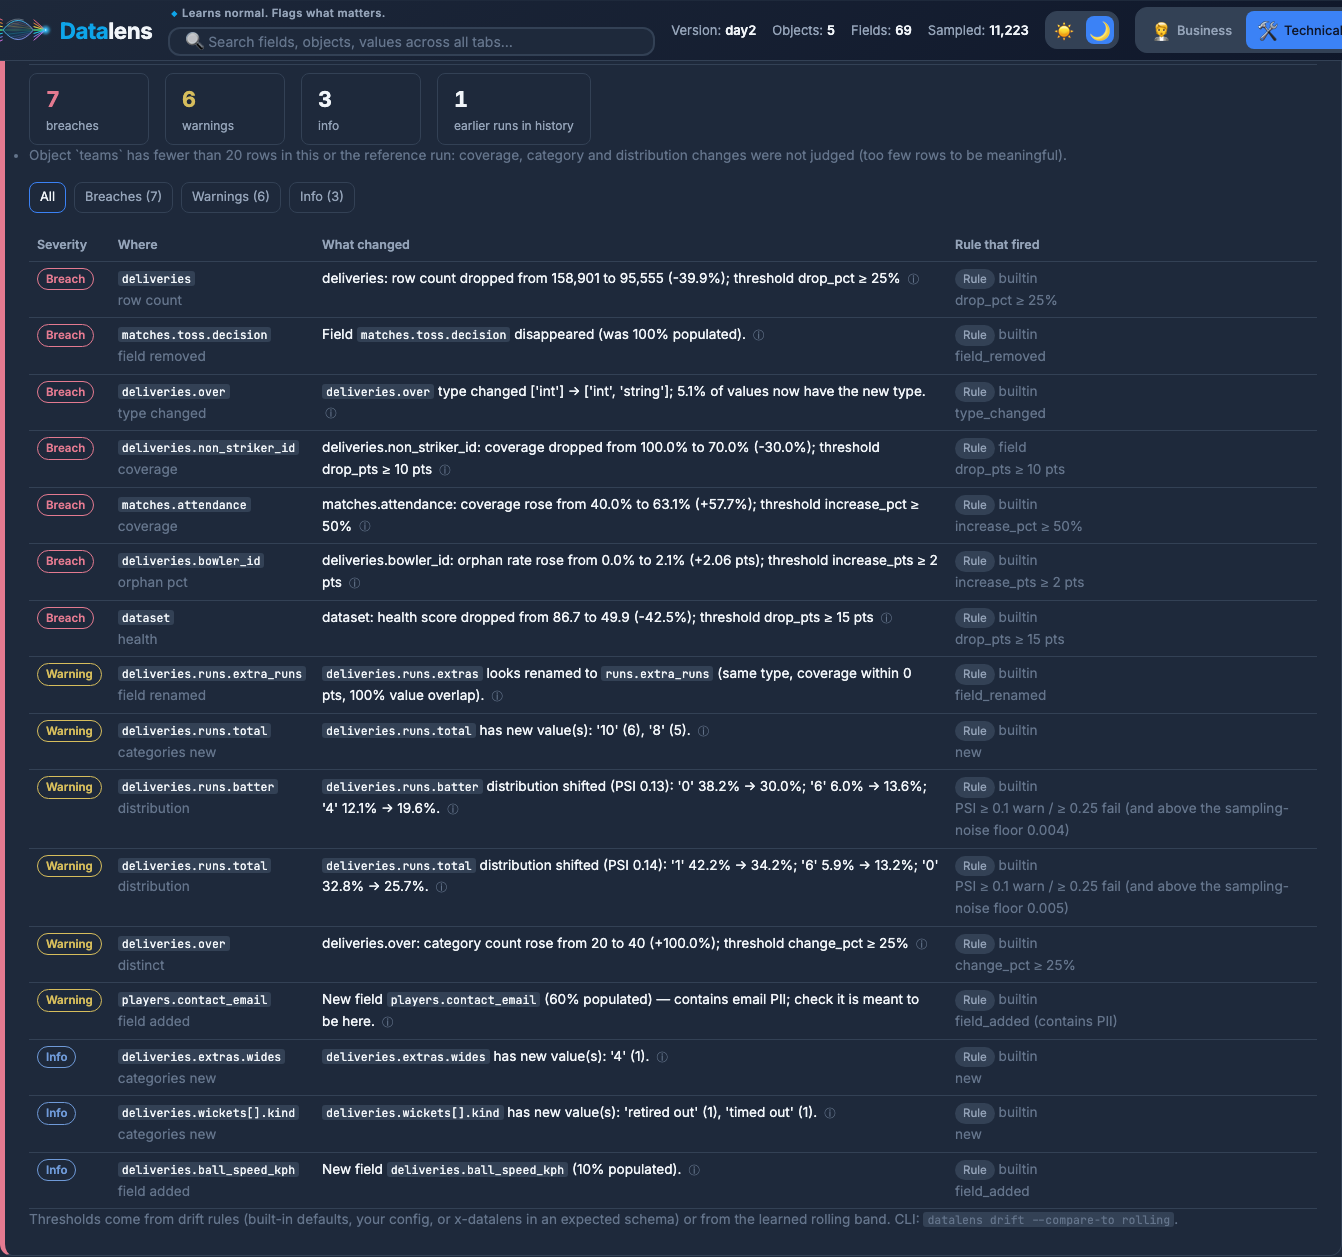
load with 13 deliberate problems injected.
datalens analyze -s file -p test_data/cricket/day1 --pattern "*.jsonl.gz" -o output/demo --version-tag day1
datalens analyze -s file -p test_data/cricket/day2 --pattern "*.jsonl.gz" -o output/demo --version-tag day2 --detect-drift
| Injected on day 2 | Found as |
|---|---|
runs.extras renamed to runs.extra_runs |
likely rename (same type, coverage and values) |
over int → string in 5% of rows |
type change, with the share of new-type values |
new ball_speed_kph, 90% null |
new field, 10% populated |
toss.decision dropped |
removed field (was 100% populated) |
non_striker_id null in 30% of rows |
coverage 100% → 70% |
matches.city blank in 25% of matches |
coverage 94% → 72% (−24%): listed, within the 25% decrease rule |
matches.attendance filled on more matches |
coverage 40% → 63% (+58%): breaches the 50% increase rule |
deliveries.shot_type filled on more rows |
coverage 50% → 56% (+12%): listed, within its rule |
more 4s and 6s in runs.batter |
distribution shift (PSI 0.13, top movers listed) |
| new wicket kind, new venue | new category values |
| 40% of deliveries missing | row count 158,901 → 95,555 |
synthetic players.contact_email |
new field containing email PII — masked in every output |
2% of bowler_id point to no player |
orphan rate 0% → 2.1% on deliveries.bowler_id → players.player_id |
Along the way it also finds real issues in the source: season is an integer for 2017–2019 and a string
("2020/21", "2022") afterwards — across five fields in three objects, reported as one root cause.
It learns what normal looks like
Real feeds wobble. In IPL, most days have one match (~250 deliveries) and some have two (~500). Fixed day-over-day thresholds cry wolf on every double-header; ignoring volume misses a truncated load.
With --compare-to rolling, each metric — row counts, coverage of every field, category counts, orphan rates,
every score — learns its own normal range from recent runs:
M = median(last N values)      MAD = median(|x − M|)      σ̂ = 1.4826·MAD   (robust: one bad day can't inflate it)
band = [min(M − 3σ̂ₑ, min seen·0.95),  max(M + 3σ̂ₑ, max seen·1.05)]      σ̂ₑ = max(σ̂, 5%·|M|, sampling noise)
Recurring patterns are learned as normal, runs that breached are kept out of the baseline, and values seen anywhere in the window aren't "new". Replaying 12 real match days plus one broken load (feed truncated, 30% nulls):
| Normal days alerted | Broken day | |
|---|---|---|
Fixed day-over-day rules (--detect-drift) |
9 of 11 | caught |
Learned baseline (--compare-to rolling) |
2 during the 3-run cold start, then 0 of 9 | caught — rows 29 vs normal 204–528, non_striker_id 55% vs 85–100%, innings lost value 2 |
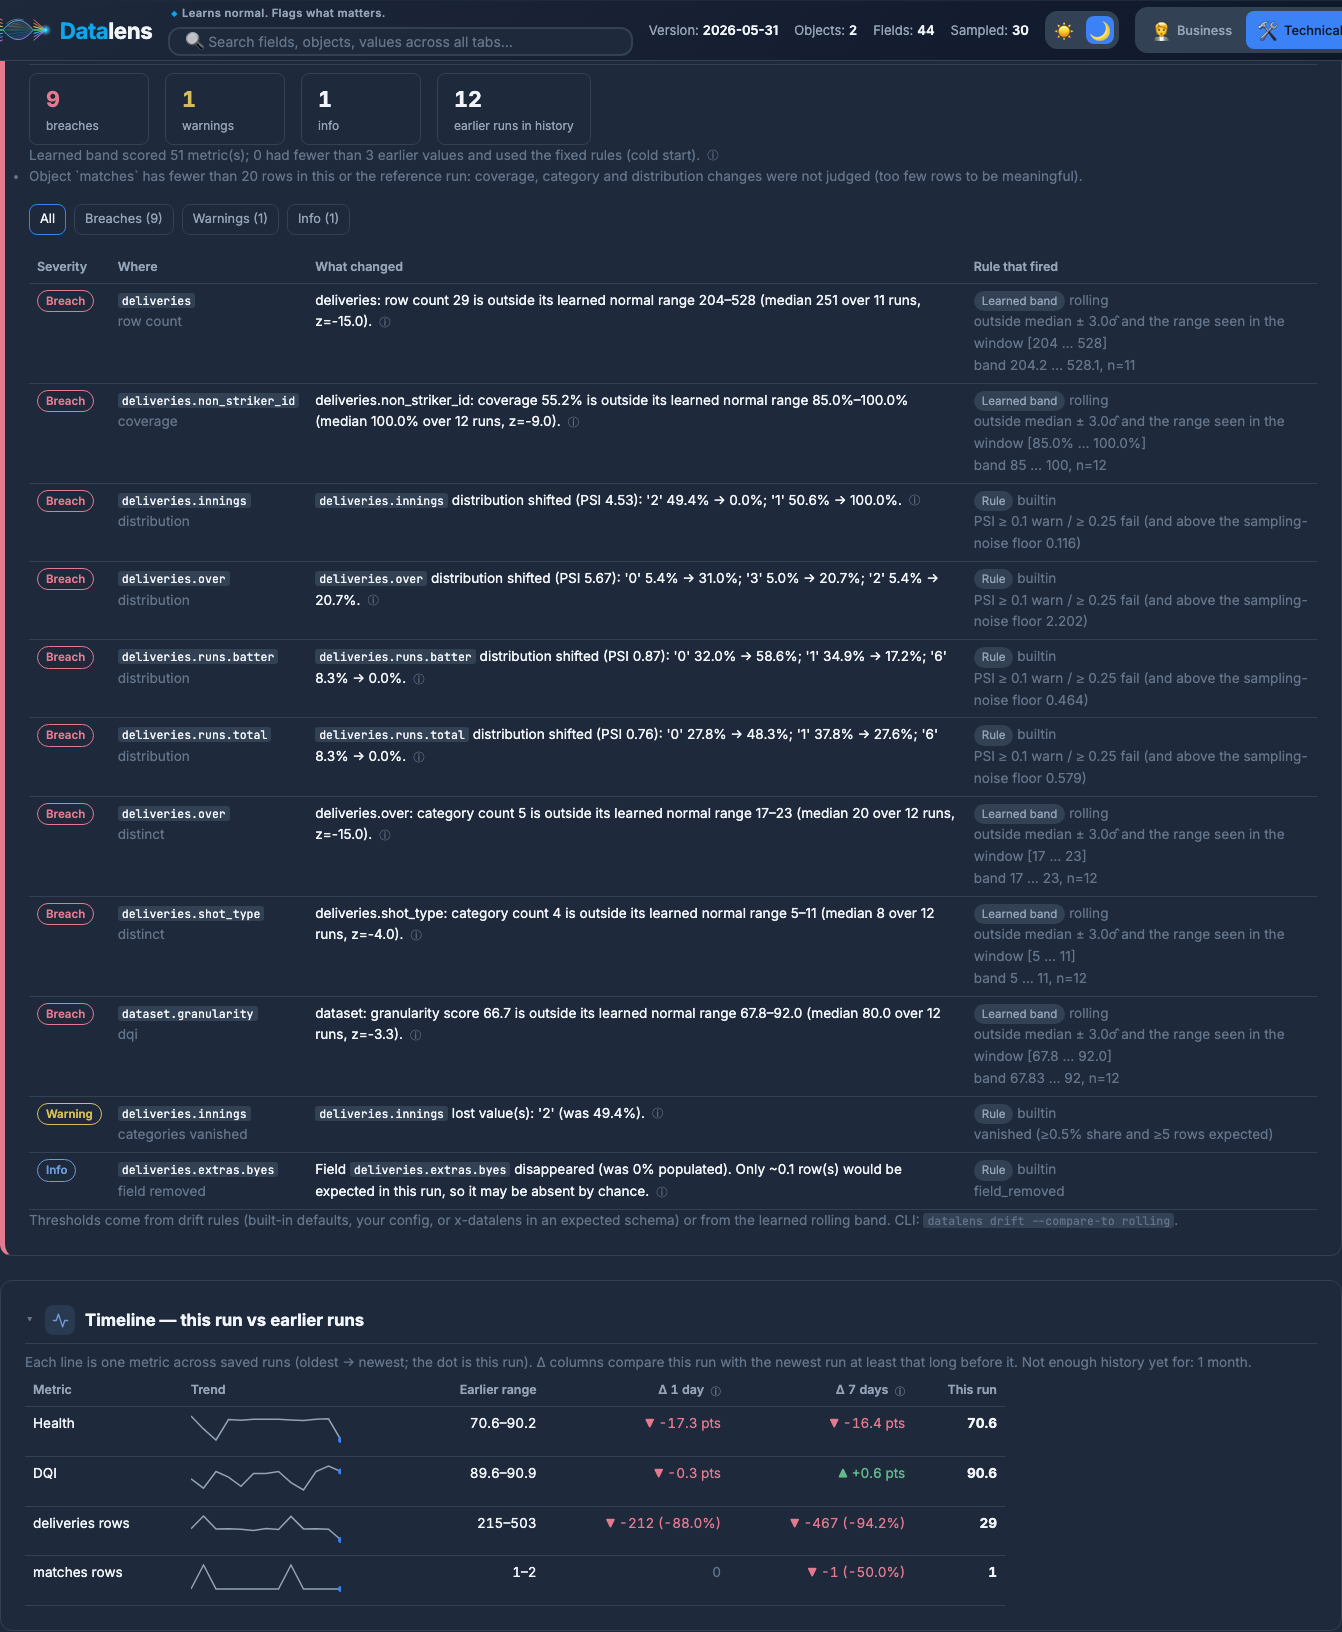
Try it: examples/scenarios/05-rolling-daily-baseline.
Prefer fixed rules? Every threshold is configurable per dataset, object and field, with separate drop and
increase limits and your own messages — see Drift rules.
It tells you what to do next
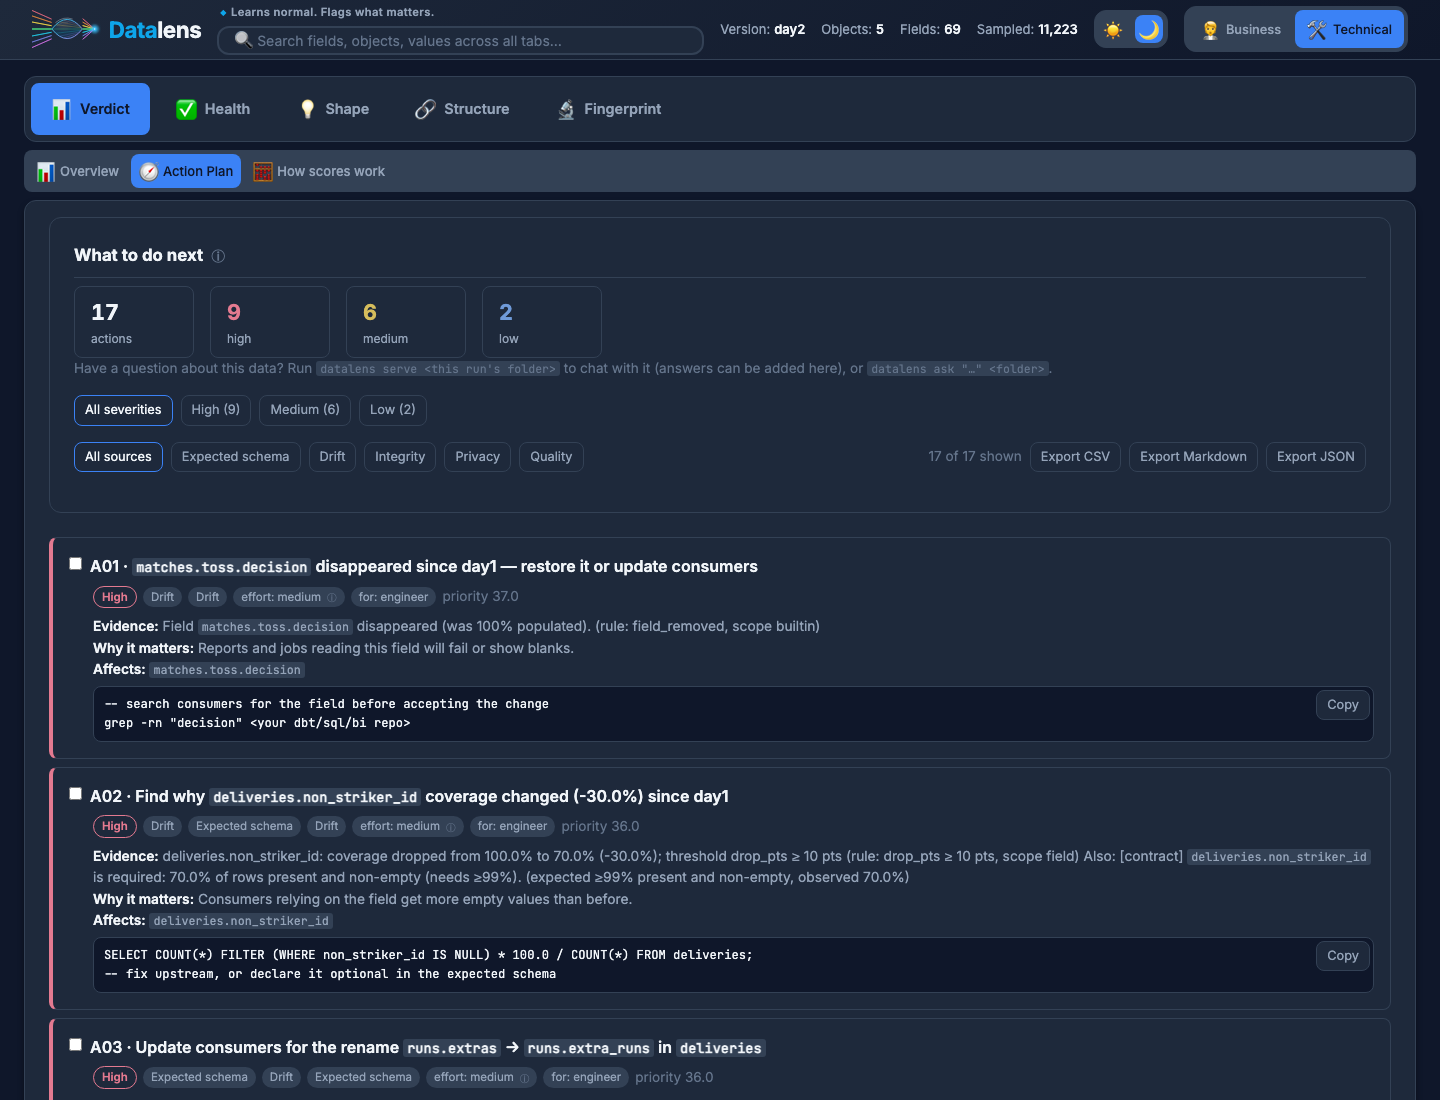
The Action Plan turns every finding — drift, expected-schema failures, PII, orphans, mixed types, stale data, AI suggestions — into one action with the evidence, why it matters, the affected fields and a copy-ready fix. Related findings are merged (the rename explains "required field missing"), priorities come from severity and breadth, and you can tick items off and export the plan as CSV, Markdown or JSON.
Bring your own schema (BYOS)
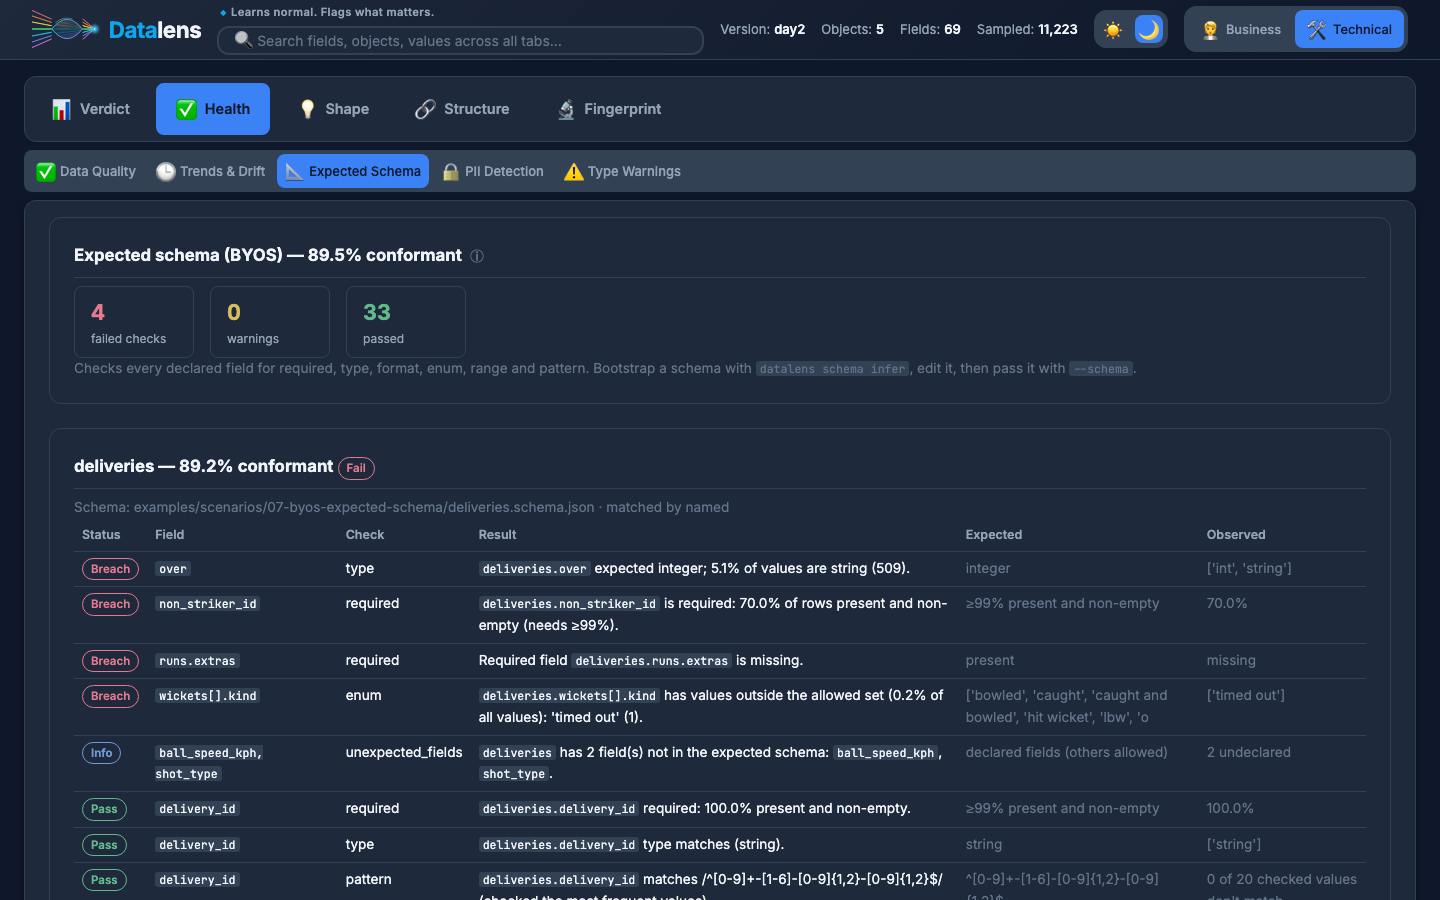
Tell Datalens what the data should look like with a JSON Schema — required fields, types, enums, ranges, patterns — and put thresholds right next to the fields:
{"title": "orders", "type": "object", "required": ["id", "title"],
 "x-datalens": {"defaults": {"coverage": {"change_pct": 20}}},
 "properties": {
   "id":      {"type": "string", "x-datalens": {"coverage": {"drop_pct": 5}}},
   "title":   {"type": "string", "x-datalens": {"coverage": {"drop_pct": 10}}},
   "country": {"type": "string", "x-datalens": {"coverage": {"change_pct": 20}}}}}
datalens schema infer -s file -p data/ -o expected.json     # no schema yet? learn one from a good load, then edit it
datalens analyze -s file -p data/ --schema expected.json --detect-drift
Failures show up in Health → Expected Schema, in the Action Plan, in the health score and in the CI exit code.
Every number explains itself
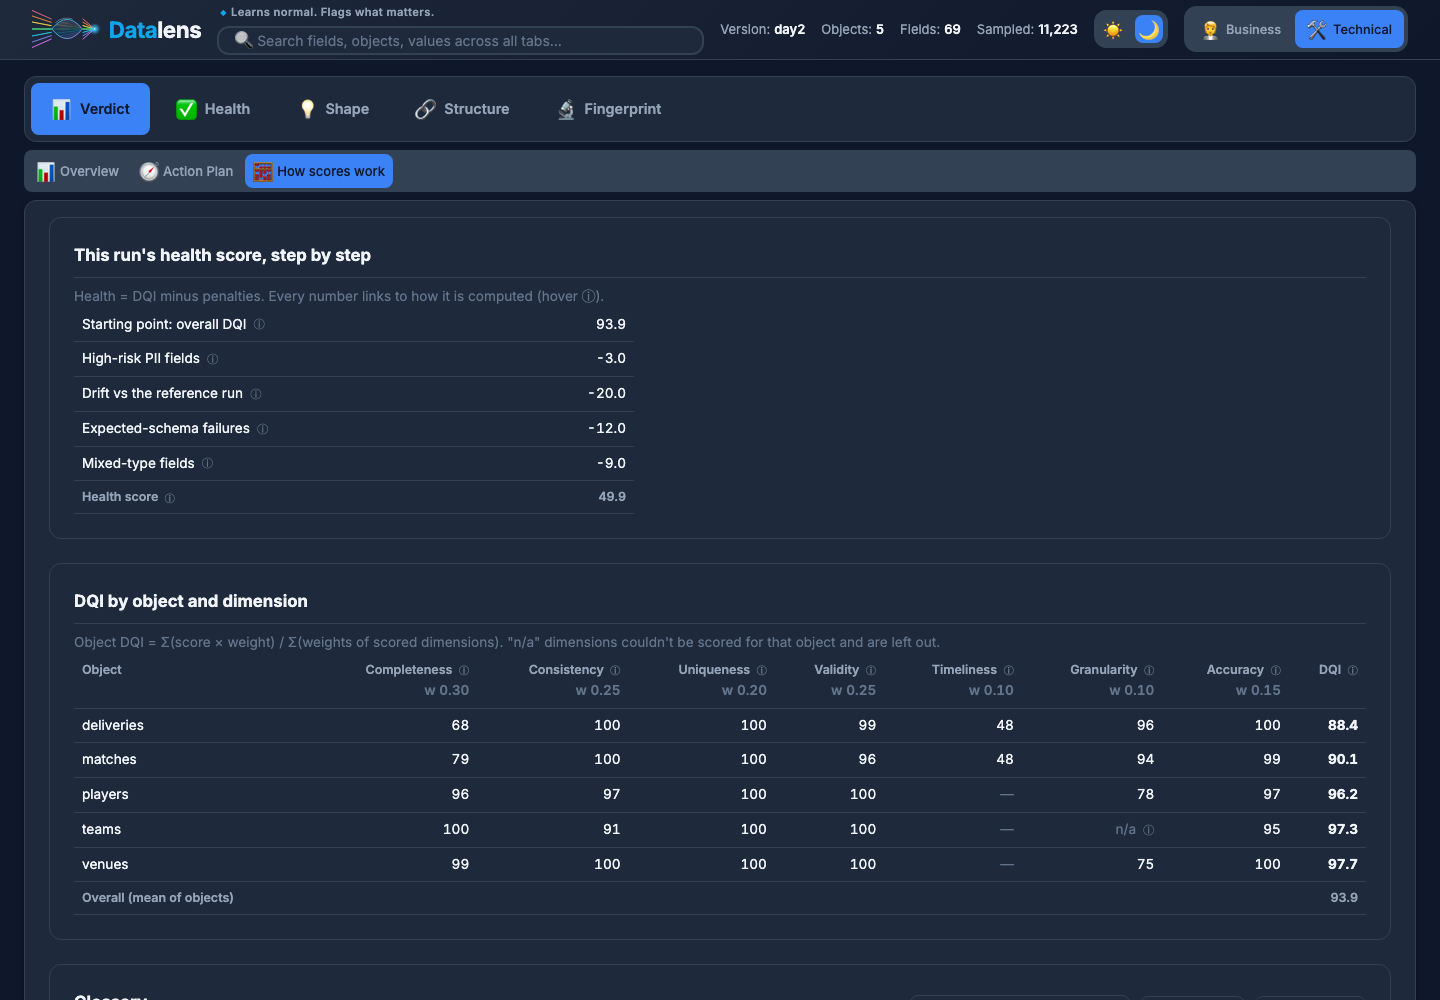
Hover any ⓘ for what a metric means and how it's calculated. Verdict → How scores work shows this run's
health score step by step and the DQI of every object and dimension with its weight. The same definitions are in
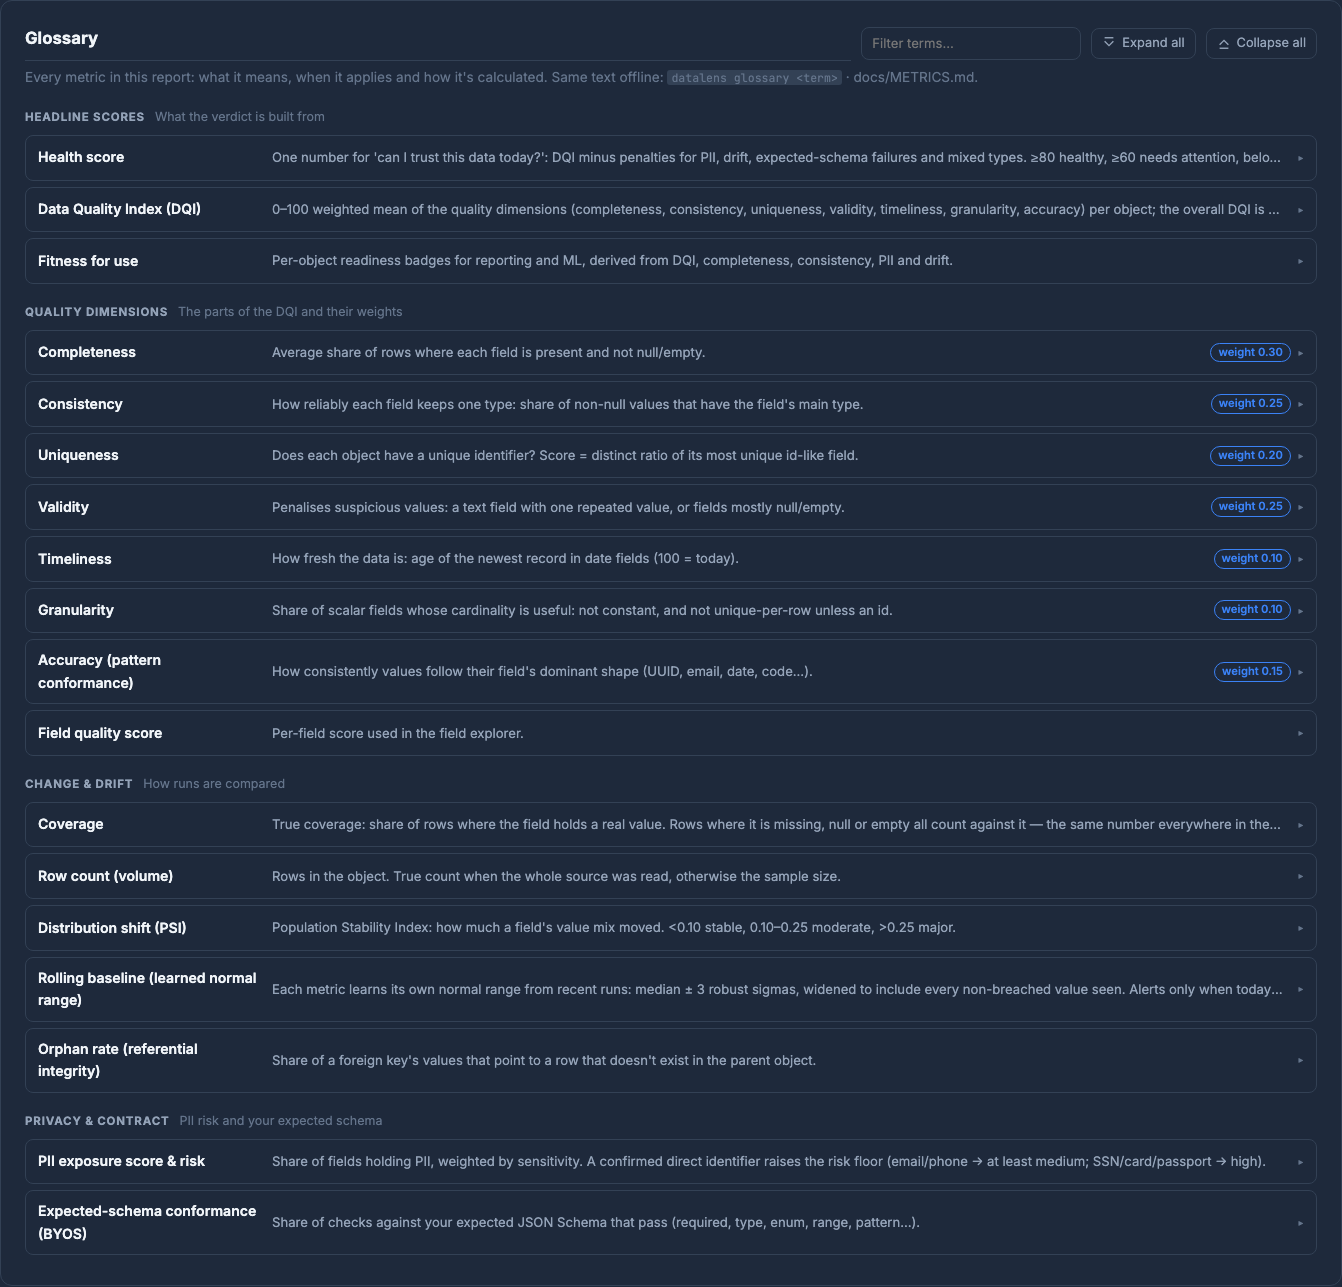
docs/METRICS.md and in the terminal (datalens glossary dqi), generated from the code's own
constants so they can't disagree.
| Score | In one line |
|---|---|
| Health | DQI minus penalties for high-risk PII, drift, expected-schema failures and mixed types |
| DQI | weighted mean of the dimensions below, per object; overall = mean of objects |
| Completeness (0.30) | share of rows with a non-empty value; nested fields measured against their parent |
| Consistency (0.25) | share of non-null values with the field's main type |
| Uniqueness (0.20) | does each object have a unique identifier? |
| Validity (0.25) | penalises placeholder-like constant text and mostly-empty fields |
| Timeliness (0.10) | age of the newest record (100 = today) |
| Granularity (0.10) | fields with useful cardinality (not constant, not unique free text) |
| Accuracy (0.15) | how consistently values follow their field's dominant pattern |
Wire it into CI/CD
Everything in the report is available from the CLI:
datalens analyze --cc nightly_export -o output --version-tag "$(date +%F)" --run-date "$(date +%F)" \
  --compare-to rolling --schema expected.json \
  --fail-on fail --min-score health=70,dqi=85 --max-drop dqi=5 \
  --notify "slack:$SLACK_WEBHOOK" --format json > summary.json
Exit codes: 0 ok · 1 warnings (with --fail-on warn) · 2 breach or failed gate · 3 error.
Also: datalens scores, datalens drift (re-check from history without reading data), datalens history list.
A ready GitHub Actions workflow is in examples/scenarios/08-ci-gate.
AI review and chat
Datalens is fully useful offline. Add --ai claude (logged-in Claude CLI), anthropic, openai, cursor or
copilot (the model is auto unless you pin one with --ai-model; a rejected model falls back to auto) and a
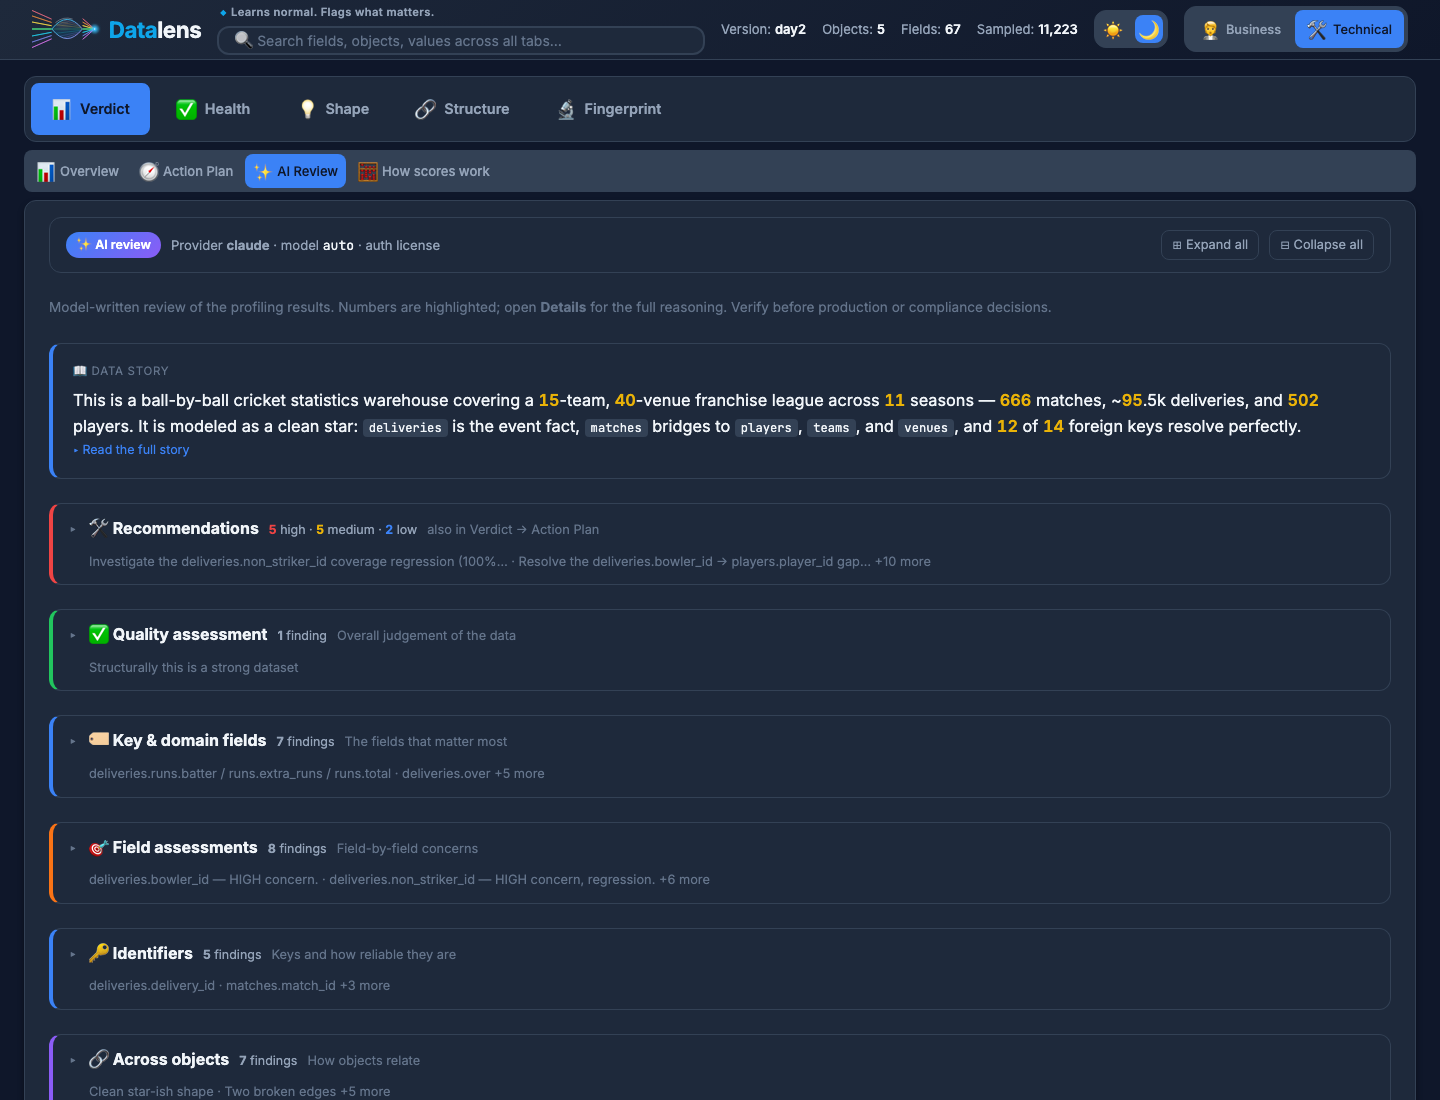
model reviews the findings — schema, keys, orphans, drift — and adds domain-aware recommendations
to the Action Plan, marked AI — shown as scannable finding cards (gist, highlighted numbers, details on
demand) in Verdict → AI Review. No sample values are sent; PII fields are flagged as masked.
Then ask follow-up questions:
datalens serve output/demo/day2_day2      # report + chat on http://127.0.0.1:8765
datalens ask "Which bowler ids are orphaned most often?" output/demo/day2_day2
datalens serve output/demo/day2_day2 --ai copilot --ai-model claude-opus-5   # any provider and model
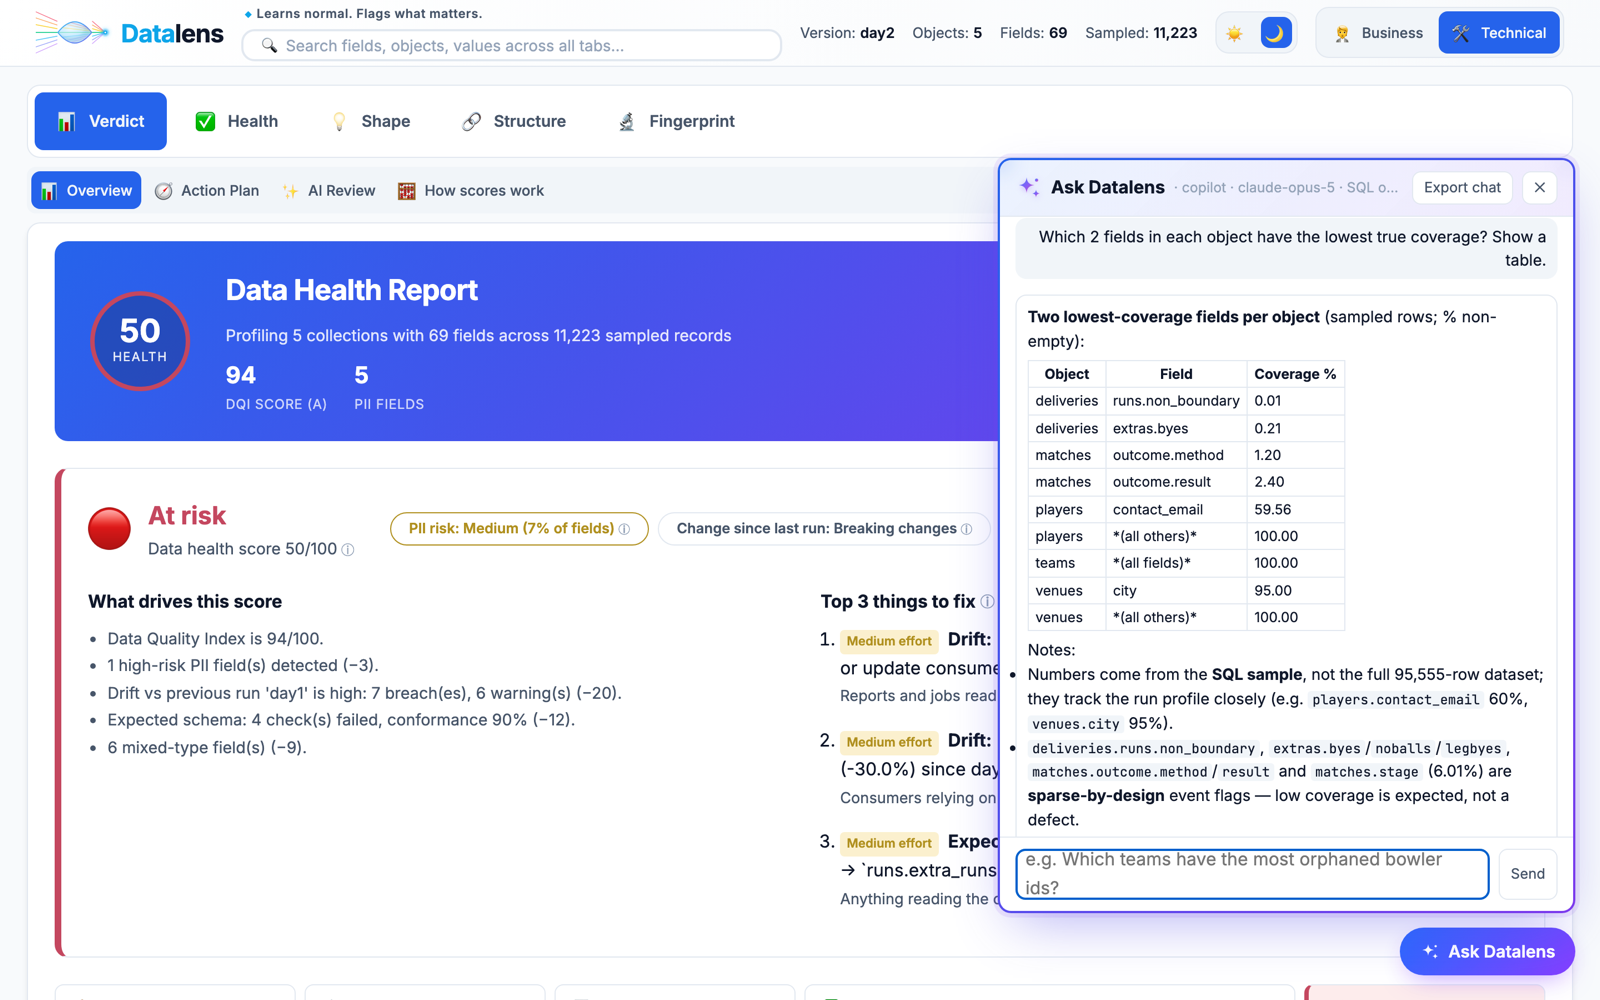
The model can run read-only SQL on a PII-masked sample of the data; every query is shown with the answer. Answers can be downloaded (CSV/Markdown), added to the Action Plan, or the whole session exported. Localhost only, per-session token, and the report file is never changed.
Opened directly, a report shows a dimmed Ask Datalens · OFF button. Click it for the copyable serve command.
Pick any provider and model with --ai and --ai-model: see scenario 13.
Coming from variety.js?
variety.js tells you which keys exist, with which types, in what share of documents. That's where Datalens starts:
| variety.js | Datalens | |
|---|---|---|
| Keys, types, occurrence % (nested, arrays) | ✅ | ✅ |
| Value distributions and examples | – | ✅ |
| Quality scores with visible formulas | – | ✅ |
| PII detection and masking | – | ✅ |
| Primary keys, foreign keys and orphans across collections | – | ✅ |
| Drift vs yesterday, a baseline, or a learned normal range | – | ✅ |
| Expected-schema (BYOS) checks | – | ✅ |
| Prioritised action plan, CI exit codes, notifications | – | ✅ |
| AI review and chat over the data | – | ✅ |
datalens analyze --source mongodb --uri "$MONGO_URI" --db shop --collections orders,customers --detect-drift
datalens analyze --source bigquery --project my-proj --dataset shop --tables orders,customers --detect-drift
Install
pip install datalens-ai                 # core: files, MongoDB, HTTP
pip install "datalens-ai[ai]"           # + Anthropic / OpenAI SDKs (CLI logins need nothing extra)
pip install "datalens-ai[bigquery]"     # + Google BigQuery connector
pip install "datalens-ai[all]"          # everything
The command is datalens (datalens --help). From source, for development:
git clone https://github.com/m8d8/datalens.ai.git
cd datalens.ai
uv sync                      # or: pip install -e .
uv sync --extra ai           # optional: Anthropic / OpenAI SDKs (CLI logins need nothing extra)
uv sync --extra bigquery     # optional: Google BigQuery connector
uv sync --extra dev          # tests: uv run pytest
Quick start on your own file:
uv run datalens analyze --source file --path data.csv --out-dir output
Each run writes to output/<source>_<tag>/: the HTML report, a run summary (JSON), the drift report and
expected-schema check (when used), the masked schema JSON, a markdown summary and, with --ai, the AI review.
Reusable connections with secrets kept out of git: Setup Guide and Setup Connections.
Library use:
from datalens import analyze

result = analyze({"source": "file", "path": "data.csv"})
result.decision["health_verdict"]   # {'status': 'attention', 'score': 79.2, 'drivers': [...], 'penalties': {...}}
result.decision["next_steps"]       # every action with evidence and fix
result.drift_report                 # when a reference run is given
Examples for every scenario
Reproduce every run and screenshot in this README: AI=claude bash examples/demo/run_demo.sh.
Documentation
| Guide | What it covers |
|---|---|
| ⚙️ Setup Guide | Config folder (init, --config-dir), app config, secrets, environments, servers and CI. |
| ↳ 🔐 Setup Connections | One file per data source: every source type, auth and option. |
| ❓ FAQ | Common questions: what it does, getting started, sampling, history, drift, CI/CD. |
| 📘 Quick Start | First report in under 5 minutes. |
| 🛠️ Usage Guide | Every flag and command, drift modes and rules, BYOS, CI/CD, chat, library use. |
| 📊 Report Guide | Every tab and how to act on it. |
| 🧮 Metrics | Every score and check: what, when, and the exact formula. |
| 🤖 AI Providers | Claude / Copilot / Cursor logins, Anthropic and OpenAI keys. |
| 🤝 Contributing | Add a connector via the Connector interface. |
| 📦 Publishing | Release checklist and PyPI publishing (maintainers). |
Data attribution
The demo data in test_data/cricket/ is derived from Cricsheet, available under the
Open Data Commons Attribution License. Day 2 and the last daily
load contain deliberately injected problems and synthetic email addresses — see
test_data/cricket/ATTRIBUTION.md. Regenerate with
python examples/demo/build_demo_data.py.
License
MIT License — see LICENSE.
1 maintainer

Metadata
1 maintainer
Release files for datalens-ai 1.0.0
For a detailed explanation of source distributions (sdists) and built distributions (wheels), please see the package formats documentation.
Source distribution (sdist)
| File | Size | Uploaded | |
|---|---|---|---|
| datalens_ai-1.0.0.tar.gz | 326.8 kB | Details |
Built distribution (wheel)
| File | Interpreter | ABI | Platform | Reset |
|---|---|---|---|---|
| datalens_ai-1.0.0-py3-none-any.whl | Python 3 | none | any | Details |
Total release size: 656.4 kB
Release files / datalens_ai-1.0.0.tar.gz
| Download URL | datalens_ai-1.0.0.tar.gz |
|---|---|
| Size | 326.8 kB |
| Tags | Source |
|
SHA-256 checksum How to use checksums |
05391b4431ac64f39500889f5fbac6b2328c3c1b5eeb445bf10f453063cc4074
|
|
BLAKE2b-256 checksum How to use checksums |
e89921d8d5d94eafa1b21a09cf361eded0ed4f2d8285f3d3eb0e09f756ca51db
|
| Upload date | |
|
Uploaded using Trusted Publishing? What is trusted publishing? |
Yes |
| Uploaded via |
twine/7.0.0 CPython/3.13.14
|
Provenance
Provenance describes where a file came from. On PyPI, provenance is shared via attestations, which provide a verifiable record of the build or publishing details. View details, limitations and caveats.


PyPI Publish Attestation
PyPI verified that this artifact, at this checksum, originated from the publisher listed below.
Signed by GitHub Actions, verified by PyPI on Oct 2, 2026.
Transparency logRelease files / datalens_ai-1.0.0-py3-none-any.whl
| Download URL | datalens_ai-1.0.0-py3-none-any.whl |
|---|---|
| Size | 329.6 kB |
| Tags | Python 3 |
|
SHA-256 checksum How to use checksums |
22312553da1081e29253c15969d9f5f9da1d2d2ee5b85ad341e88c3b156e13bc
|
|
BLAKE2b-256 checksum How to use checksums |
c5fef3f58ad1400d4b9b72fcabbdae592f5869098063c041cdcbad0b7cefe1a1
|
| Upload date | |
|
Uploaded using Trusted Publishing? What is trusted publishing? |
Yes |
| Uploaded via |
twine/7.0.0 CPython/3.13.14
|
Provenance
Provenance describes where a file came from. On PyPI, provenance is shared via attestations, which provide a verifiable record of the build or publishing details. View details, limitations and caveats.
PyPI Publish Attestation
PyPI verified that this artifact, at this checksum, originated from the publisher listed below.
Signed by GitHub Actions, verified by PyPI on Oct 2, 2026.
Transparency log












