
Welcome to the dataoutsider visualization toolbox!
Featuring:
- Multi-Chord Diagram
- Pie-Tree Chart (or Pie-Map Chart)
- Bubble Series Chart


Multi-Chord Diagram
Have too many sets for a Venn Diagram?
- Prepare groups a. Select 2 fields that identify 1. a group (ex: sports event) and 2. an entity (ex: athlete) to identify the many-to-many relationships (ex: many athletes to many events) or b. Pre-group data and provide each unique group combination (ex: athletes that competed in only the [100 meter] vs those that competed in only the [100 meter & 200 meter], etc.) and associated entity count (ex: # of athletes per group)
- Configure the parent-group order
- The multi-chord diagram will create bonds between many-to-many relationships, sized by the entity count per each unique group combination (ex: 10 athletes competed in only the [50 meter, 100 meter, & meter], 23 athletes competed in only the [100 meter], etc.)
Assumes 1 row = 1 unit for 1. a.
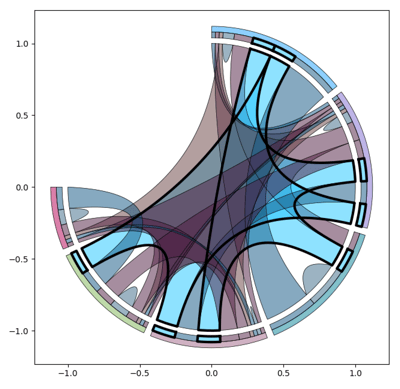
Example 1 (1. a.):
from dataoutsider import multi_chord as mc

df = mc.load_olympics_df()
df = df.loc[(df['Year'] >= 2014) & (df['Sex'] == 'F') & (df['Sport'] == 'Speed Skating')]
outer = 'Event'
inner = 'ID'
lookup = mc.multi_chord_get_alias(df, outer, inner)
print(lookup)
df_mc = mc.multi_chord_alias(df, outer, inner, percent = 75.)

df_mc_venn = mc.multi_chord_venn(df_mc)

mc.multi_chord_plot(df_mc, level = 4, transparency = 0.5)
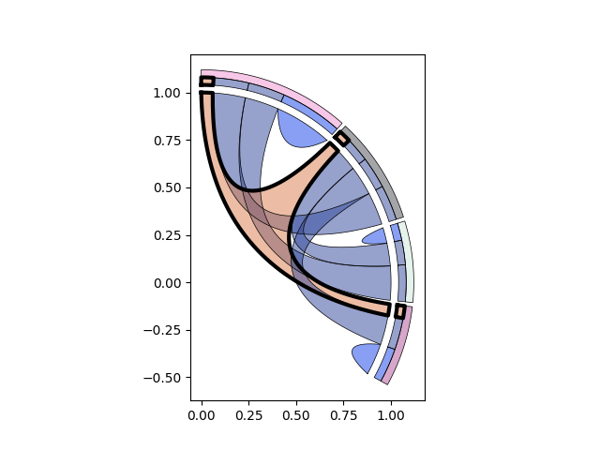
Example 2 (1. b.):
from dataoutsider import multi_chord as mc
import pandas as pd

data = [['a', 25.5], ['a,b', 15], ['a,c', 14.4], ['a,c,d', 5], ['c,d', 13], ['d', 14], ['c,b', 10], ['b', 7]]
df = pd.DataFrame(data, columns = ['group', 'value'])
df_mc = mc.multi_chord_on_groups_alias(df, percent=33.)
df_mc_venn = mc.multi_chord_venn(df_mc)
mc.multi_chord_plot(df_mc, level = 3, transparency = 0.5)
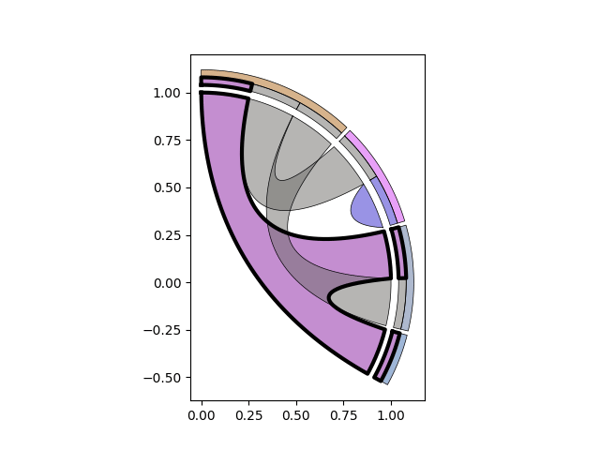
Example 3 (1. a.):
from dataoutsider import multi_chord as mc
import pandas as pd

data = [['5', 'a'], ['5', 'b'], ['5', 'd'], ['2', 'b'], ['2', 'c'], ['3', 'b'], ['3', 'd'], ['4', 'c']]
df = pd.DataFrame(data, columns = ['inner', 'outer'])
lookup = mc.multi_chord_get_alias(df, 'outer', 'inner')
print(lookup) # use outer_ID (alias) to set manual order
df_mc = mc.multi_chord_alias(df, outer='outer', inner='inner', order='1,3,2,4', percent=33.) #, order = 'b,c,d,a'
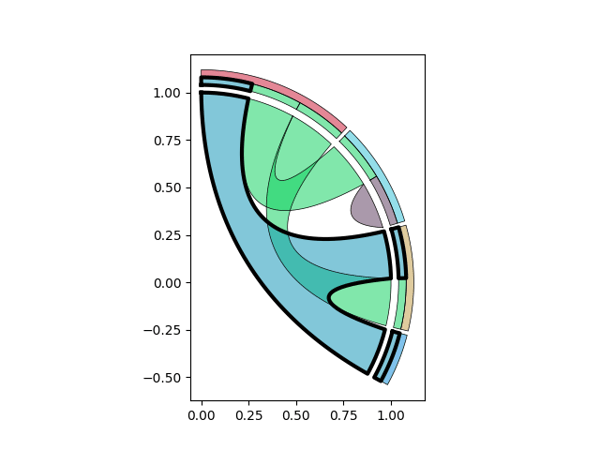
mc.multi_chord_plot(df_mc, level = 3, transparency = 0.5)
Example 4 (1. b. version of Example 3):
from dataoutsider import multi_chord as mc
import pandas as pd

data = [['a,b,d', 1], ['b,c', 1], ['b,d', 1], ['c', 1]]
df = pd.DataFrame(data, columns = ['group', 'value'])
df_mc = mc.multi_chord_on_groups_alias(df, order = 'b,c,d,a', percent=33.)
mc.multi_chord_plot(df_mc, level = 3, transparency = 0.5)
Functions:
multi_chord_alias(df, outer, inner, percent=100., order=None, buffer = 1., elements_offset = 0.04, elements_height = 0.04, group_offset = 0., group_height = 0.04)

multi_chord_get_alias(df, outer, inner)

multi_chord_on_groups_alias(df_chord, percent=100., order=None, buffer = 1., elements_offset = 0.04, elements_height = 0.04, group_offset = 0., group_height = 0.04)

multi_chord_venn(df_mc)

multi_chord_plot(df_mc, level = None, transparency = 0.5)
- multi_chord_alias: Multi-Chord Diagram generator that encodes the supplied groups with an alias, output: Pandas DataFrame
- multi_chord_get_alias: retreive the alias for the supplied groups (can use to create a manual ordering)
- multi_chord_on_groups_alias: Multi-Chord Diagram generator based on pre-defined groupings, output: Pandas DataFrame
- multi_chord_venn: output for creating an Upset plot, output: Pandas DataFrame
- multi_chord_plot: generate a plot using Matplotlib
Parameters:
| Parameter | Values | Description |
|---|---|---|
| df | (DataFrame) | Pandas DataFrame |
| outer | (string) | Column name of group |
| inner | (string) | Column name of group entity |
| percent | (float: 0-100) | Percent of full circle to draw within |
| order | (csv string) | Group order |
| buffer | (float) | Radial distance between groups |
| elements_offset | (float) | Distance offset of element legend for entities |
| elements_height | (float) | Height of element legend for entities |
| group_offset | (float) | Distance offset of group legend |
| group_height | (float) | Height of group legend |
| df_mc | (DataFrame) | Pandas DataFrame of multi-chord results |
| level | (int) | Bold chords by count of groups in chord (optional) |
| transparency | (float: 0-1) | Add color transparency (optional) |
Pie-Tree Chart
Need to display hierarchical density as pie-shaped areas?
- Select [1 to n] categorical columns from a dataframe to group by
- Configure the chart ordering and hierarchy orientation
- The pie-tree chart will create a hierarchical set of areas sized by the number of rows in each group at each level
Assumes 1 row = 1 unit
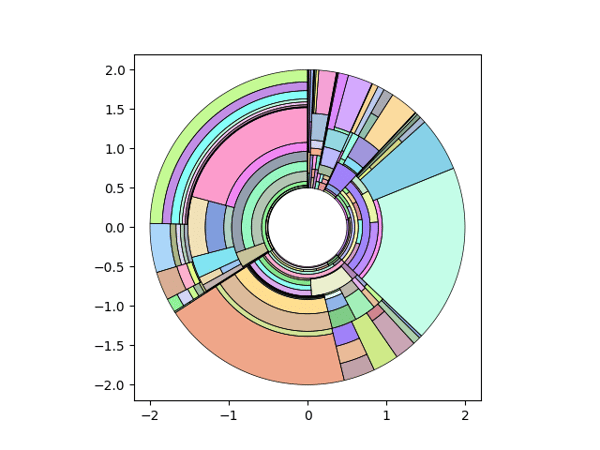
Example:
from dataoutsider import pie_tree as pt

df = pt.load_aircraft_df()
levels = ['Registrant', 'Aircraft', 'Engine', 'seats_bin']

inner_radius = 0.5
outer_radius = 2.0
starting_angle = 0.0
ending_angle = 360.0
point_resolution = 200
pie_tree_df = pt.pie_tree_calc(
    df, levels,
    inner_radius,
    outer_radius,
    starting_angle,
    ending_angle,
    point_resolution)

pt.pie_tree_plot(pie_tree_df, 4)
Functions:
def pie_tree_calc(df, groupers, r1, r2, start_angle, end_angle, points, default_sort = False, default_sort_override = True, default_sort_override_reversed = False, all_vertical = False)

pie_tree_plot(pie_tree_df, level = 1, transparency = 0.5, line_level = 0)
- pie_tree_calc: Pie-Tree (Pie-Map) Chart generator, output: Pandas DataFrame
- multi_chord_plot: generate a plot using Matplotlib
Parameters:
| Parameter | Values | Description |
|---|---|---|
| df | (DataFrame) | Pandas DataFrame |
| groupers | list of (string) | Columns names in df |
| r1 | (float) | Innder radius |
| r2 | (float) | Outer radius (> inner radius) |
| start_angle | (float) | Angle to start drawing |
| end_angle | (float) | Angle to end drawing |
| points | (int) | Resolution for curve drawing |
| default_sort | True/False | Default: False, True: pandas sort, False: data sort |
| default_sort_override | True/False | Default: True, True: overrides default_sort |
| default_sort_override_reversed | True/False | Default: False, sort areas True: desc, False: asc |
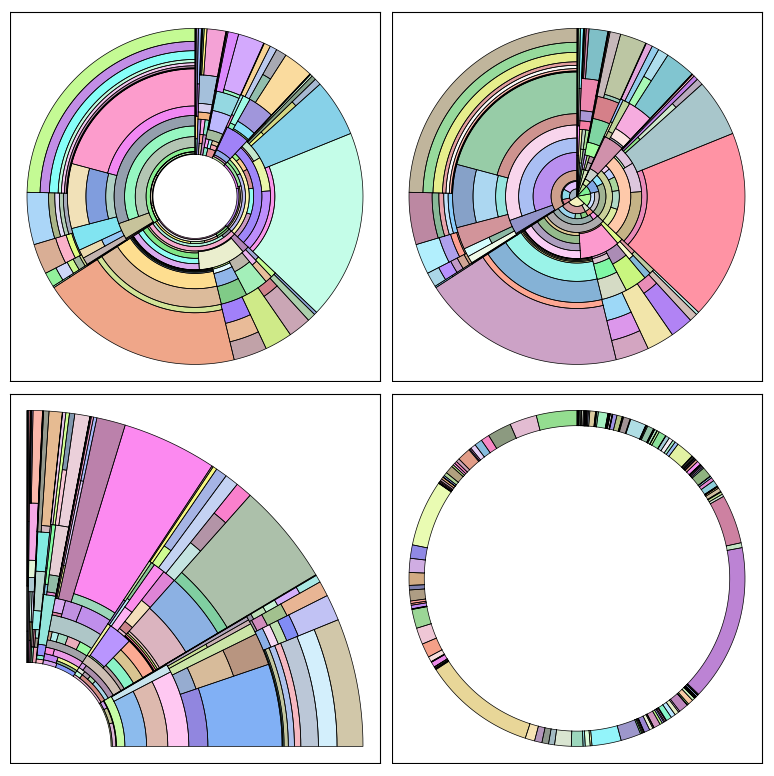
| all_vertical | True/False | Default: False, True: break levels vertically, False: alternate |
| level | (int) | Hierarchy level to plot (optional) |
| transparency | (float: 0-1) | Add color transparency (optional) |
| line_level | (int) | Hierarchy level to bold (optional) |
Variations:
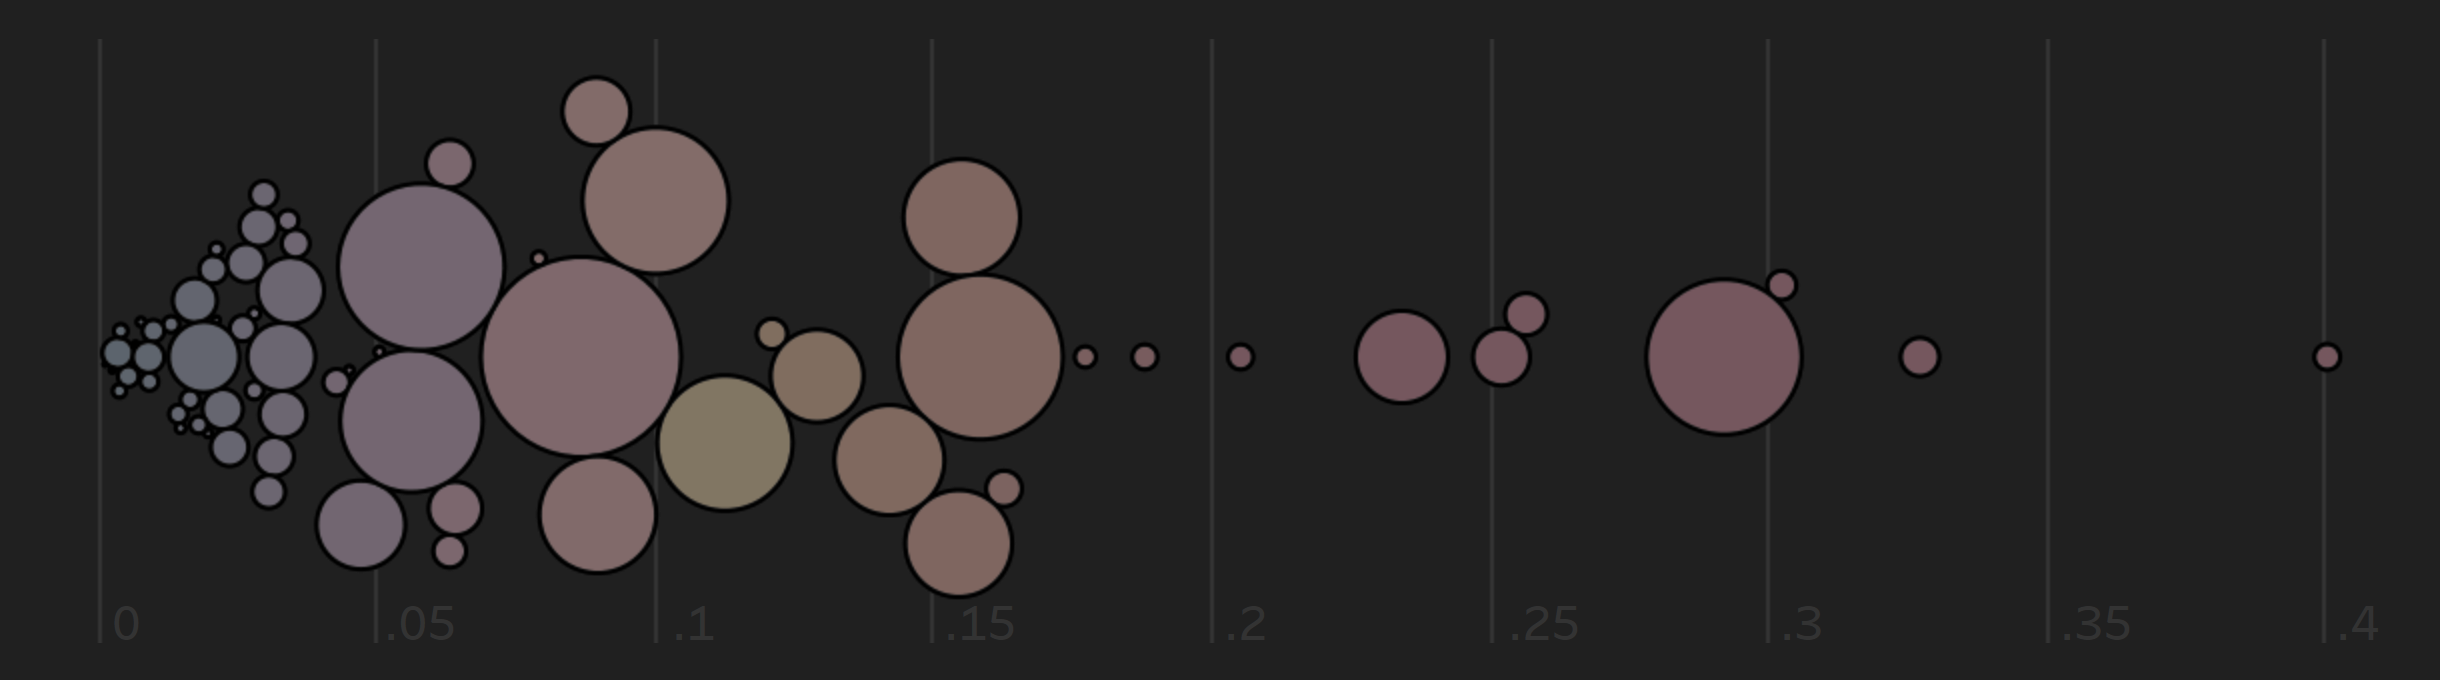
Bubble Series Chart
Need to visualize sized bubbles that have a positional feature?
- Identify the columns names in the data for item, position, and size (circle area)
- Add an optional radius buffer to separate the circles
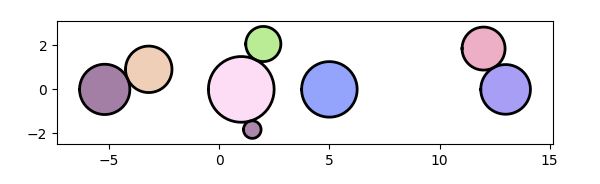
- The bubble series chart will pack all of the sized circles deterministically according to their positions (along the horizontal axis)
Assumes 1 row = 1 unit
Example:
from dataoutsider import bubble_series as bs

data = [
    ('a',-5.2,4.1),
    ('b',-3.2,3.5),
    ('c',2,2),
    ('d',1,7),
    ('e',5,5),
    ('f',13,4),
    ('g',12,3),
    ('h',1.5,0.5)]
df = pd.DataFrame(data, columns = ['name', 'position', 'size'])

df_bs = bs.bubble_series_calc(df, 'name', 'position', 'size', 0.0)
bs.bubble_series_plot(df_bs)
Functions:
bubble_series_calc(df, item_col_name, position_col_name, size_col_name, r_buffer=0.0)

bubble_series_plot(bubble_series_calc_df, transparency = 0.5)
- bubble_series_calc: Bubble Series Chart generator, output: Pandas DataFrame
- bubble_series_plot: generate a plot using Matplotlib
Parameters:
| Parameter | Values | Description |
|---|---|---|
| df | (DataFrame) | Pandas DataFrame |
| item_col_name | (string) | Columns name of items |
| position_col_name | (string) | Columns name of item's positions |
| size_col_name | (string) | Columns name of item's sizes |
| r_buffer | (float) | radius buffer to add separation between bubbles (optional) |
| transparency | (float: 0-1) | Add color transparency (optional) |
Tableau users
Output:
- Polygon chart: Columns: [x], Rows: [y], Path: [path], Detail: varies by algorithm, use grouping fields as needed (see examples below)
Examples:
- Multi-Chord Diagram: Sink or Swim
- Pie-Tree Chart: Takeoff
- Bubble Series Chart: Black Hole Sun
License
The dataoutsider package is dual-licensed:
-
For non-commercial use, dataoutsider is available under the Non-Commercial Use License (LICENSE-NC). See the LICENSE-NC file for more details. This includes specific provisions against unauthorized adaptations of the software's core functionality or algorithms in any other programming language or environment without explicit permission.
-
For commercial use, a separate Commercial Use License (LICENSE-COM) is required. This license includes provisions against the creation and commercial exploitation of adaptations or derivative works without obtaining a specific commercial license. Please contact Nick Gerend at nickgerend@gmail.com for terms and inquiries.
1 maintainer

Metadata
1 maintainer
Release files for dataoutsider 1.2.3
For a detailed explanation of source distributions (sdists) and built distributions (wheels), please see the package formats documentation.
Source distribution (sdist)
| File | Size | Uploaded | |
|---|---|---|---|
| dataoutsider-1.2.3.tar.gz | 5.4 MB | Details |
Built distribution (wheel)
| File | Interpreter | ABI | Platform | Reset |
|---|---|---|---|---|
| dataoutsider-1.2.3-py3-none-any.whl | Python 3 | none | any | Details |
Total release size: 21.9 MB
Release files / dataoutsider-1.2.3.tar.gz
| Download URL | dataoutsider-1.2.3.tar.gz |
|---|---|
| Size | 5.4 MB |
| Tags | Source |
|
SHA-256 checksum How to use checksums |
0d1d56cf3f34863a74ae87720f8041e1b6060d4dc85aeccf73b54d23e7b9ca93
|
|
BLAKE2b-256 checksum How to use checksums |
69191ba2b2c2cd91ad083309b6987c14a13d5fa772a551fcad88131db74a017e
|
| Upload date | |
|
Uploaded using Trusted Publishing? What is trusted publishing? |
No |
| Uploaded via |
twine/3.8.0 pkginfo/1.8.2 readme-renderer/32.0 requests/2.27.1 requests-toolbelt/0.9.1 urllib3/1.26.8 tqdm/4.63.0 importlib-metadata/4.11.2 keyring/23.5.0 rfc3986/2.0.0 colorama/0.4.4 CPython/3.7.9
|
Release files / dataoutsider-1.2.3-py3-none-any.whl
| Download URL | dataoutsider-1.2.3-py3-none-any.whl |
|---|---|
| Size | 16.4 MB |
| Tags | Python 3 |
|
SHA-256 checksum How to use checksums |
980781f1a8d7cf21acd88668efd665129281b88b945af40a2ead7b951df6a3ea
|
|
BLAKE2b-256 checksum How to use checksums |
fdd00cfea243746e4602c70e1fa888f7b194dfb4cb03212a9adf9b908d08a845
|
| Upload date | |
|
Uploaded using Trusted Publishing? What is trusted publishing? |
No |
| Uploaded via |
twine/3.8.0 pkginfo/1.8.2 readme-renderer/32.0 requests/2.27.1 requests-toolbelt/0.9.1 urllib3/1.26.8 tqdm/4.63.0 importlib-metadata/4.11.2 keyring/23.5.0 rfc3986/2.0.0 colorama/0.4.4 CPython/3.7.9
|














